

Spatial and temporal evolution of distal 10q deletion, a prognostically unfavorable event in diffuse low-grade gliomas
- PMID: 25245118
- PMCID: PMC4195855
- DOI: 10.1186/s13059-014-0471-6
Spatial and temporal evolution of distal 10q deletion, a prognostically unfavorable event in diffuse low-grade gliomas
Abstract
Background: The disease course of patients with diffuse low-grade glioma is notoriously unpredictable. Temporal and spatially distinct samples may provide insight into the evolution of clinically relevant copy number aberrations (CNAs). The purpose of this study is to identify CNAs that are indicative of aggressive tumor behavior and can thereby complement the prognostically favorable 1p/19q co-deletion.
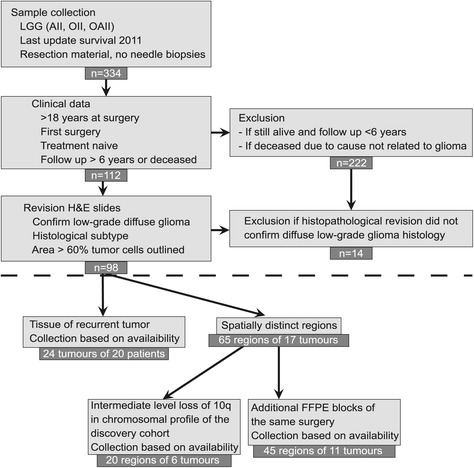
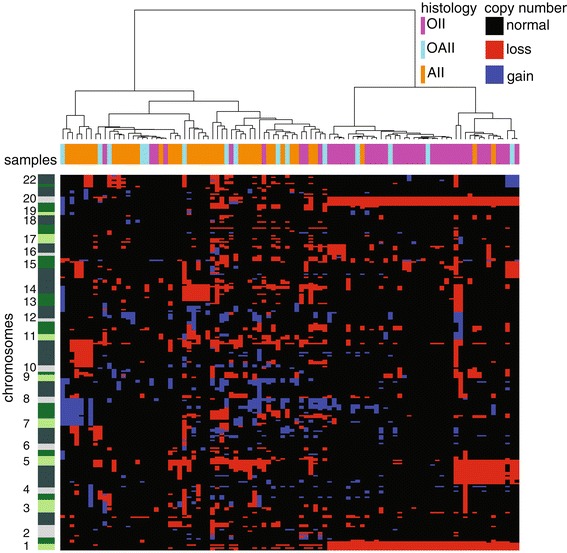
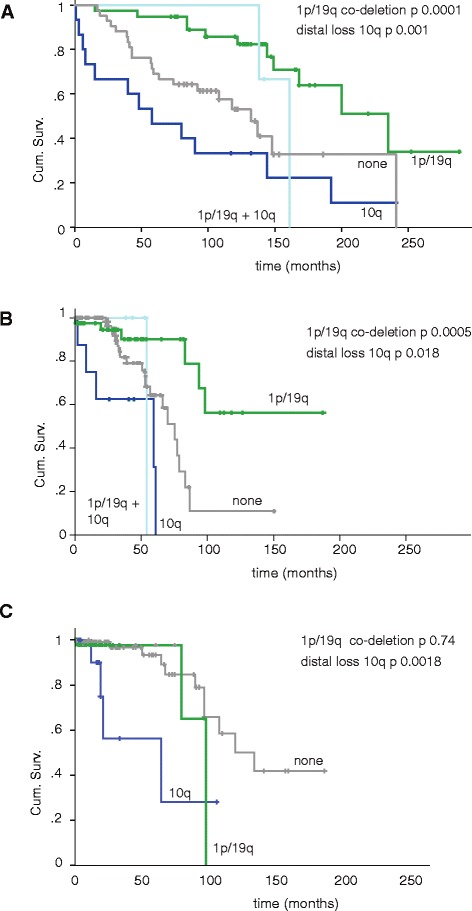
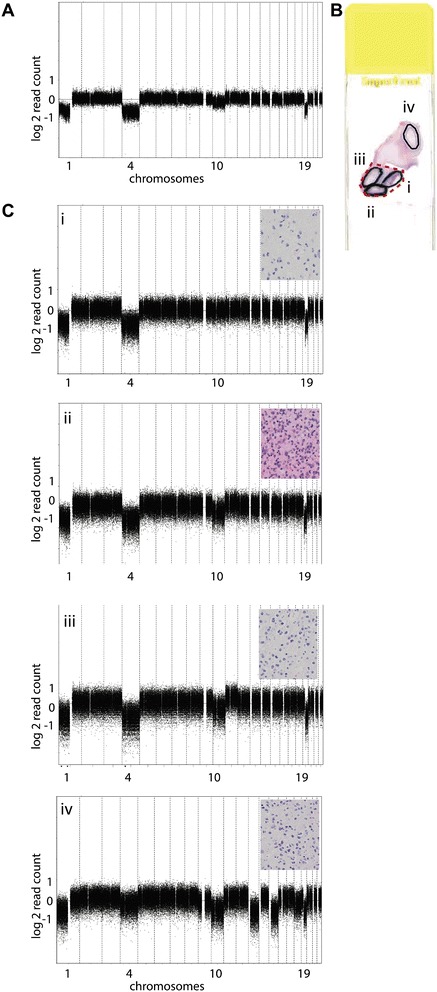
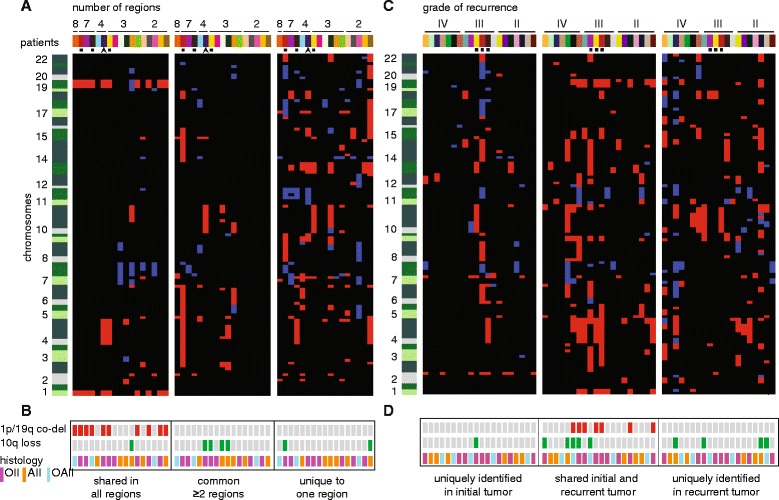
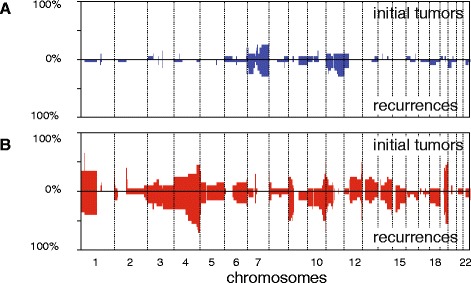
Results: Genome-wide, 50 base pair single-end sequencing was performed to detect CNAs in a clinically well-characterized cohort of 98 formalin-fixed paraffin-embedded low-grade gliomas. CNAs are correlated with overall survival as an endpoint. Seventy-five additional samples from spatially distinct regions and paired recurrent tumors of the discovery cohort were analyzed to interrogate the intratumoral heterogeneity and spatial evolution. Loss of 10q25.2-qter is a frequent subclonal event and significantly correlates with an unfavorable prognosis. A significant correlation is furthermore observed in a validation set of 126 and confirmation set of 184 patients. Loss of 10q25.2-qter arises in a longitudinal manner in paired recurrent tumor specimens, whereas the prognostically favorable 1p/19q co-deletion is the only CNA that is stable across spatial regions and recurrent tumors.
Conclusions: CNAs in low-grade gliomas display extensive intratumoral heterogeneity. Distal loss of 10q is a late onset event and a marker for reduced overall survival in low-grade glioma patients. Intratumoral heterogeneity and higher frequencies of distal 10q loss in recurrences suggest this event is involved in outgrowth to the recurrent tumor.
Figures
Similar articles
-
Chromosome 9p and 10q losses predict unfavorable outcome in low-grade gliomas.Neuro Oncol. 2010 Jan;12(1):2-6. doi: 10.1093/neuonc/nop002. Epub 2009 Oct 15. Neuro Oncol. 2010. PMID: 20150361 Free PMC article.
-
Loss of genetic material within 1p and 19q chromosomal arms in low grade gliomas of central nervous system.Folia Neuropathol. 2013;51(1):26-32. doi: 10.5114/fn.2013.34193. Folia Neuropathol. 2013. PMID: 23553134
-
Analysis of IDH mutation, 1p/19q deletion, and PTEN loss delineates prognosis in clinical low-grade diffuse gliomas.Neuro Oncol. 2014 Jul;16(7):914-23. doi: 10.1093/neuonc/not299. Neuro Oncol. 2014. PMID: 24470545 Free PMC article.
-
Impact of gross total resection in patients with WHO grade III glioma harboring the IDH 1/2 mutation without the 1p/19q co-deletion.J Neurooncol. 2016 Sep;129(3):505-514. doi: 10.1007/s11060-016-2201-2. Epub 2016 Jul 11. J Neurooncol. 2016. PMID: 27401154
-
The T2-FLAIR-mismatch sign as an imaging biomarker for IDH and 1p/19q status in diffuse low-grade gliomas: a systematic review with a Bayesian approach to evaluation of diagnostic test performance.Neurosurg Focus. 2019 Dec 1;47(6):E13. doi: 10.3171/2019.9.FOCUS19660. Neurosurg Focus. 2019. PMID: 31786548
Cited by
-
IDH mutation status and role of WHO grade and mitotic index in overall survival in grade II-III diffuse gliomas.Acta Neuropathol. 2015 Apr;129(4):585-96. doi: 10.1007/s00401-015-1398-z. Epub 2015 Feb 21. Acta Neuropathol. 2015. PMID: 25701198 Free PMC article.
-
Tumor mutational burden predicts survival in patients with low-grade gliomas expressing mutated IDH1.Neurooncol Adv. 2020 Mar 27;2(1):vdaa042. doi: 10.1093/noajnl/vdaa042. eCollection 2020 Jan-Dec. Neurooncol Adv. 2020. PMID: 32642696 Free PMC article.
-
Reduced rate of copy number aberrations in mucinous colorectal carcinoma.Oncotarget. 2015 Sep 22;6(28):25715-25. doi: 10.18632/oncotarget.4706. Oncotarget. 2015. PMID: 26329972 Free PMC article.
-
Evolution of DNA repair defects during malignant progression of low-grade gliomas after temozolomide treatment.Acta Neuropathol. 2015 Apr;129(4):597-607. doi: 10.1007/s00401-015-1403-6. Epub 2015 Feb 28. Acta Neuropathol. 2015. PMID: 25724300 Free PMC article.
-
Oligodendroglioma: pathology, molecular mechanisms and markers.Acta Neuropathol. 2015 Jun;129(6):809-27. doi: 10.1007/s00401-015-1424-1. Epub 2015 May 6. Acta Neuropathol. 2015. PMID: 25943885 Free PMC article. Review.
References
-
- Douw L, Klein M, Fagel SS, van den Heuvel J, Taphoorn MJ, Aaronson NK, Postma TJ, Vandertop WP, Mooij JJ, Boerman RH, Beute GN, Sluimer JD, Slotman BJ, Reijneveld JC, Heimans JJ. Cognitive and radiological effects of radiotherapy in patients with low-grade glioma: long-term follow-up. Lancet Neurol. 2009;8:810–818. doi: 10.1016/S1474-4422(09)70204-2. - DOI - PubMed
-
- Erdem-Eraslan L, Gravendeel LA, de Rooi J, Eilers PH, Idbaih A, Spliet WG, den Dunnen WF, Teepen JL, Wesseling P, Sillevis Smit PA, Kros JM, Gorlia T, van den Bent MJ, French PJ. Intrinsic molecular subtypes of glioma are prognostic and predict benefit from adjuvant procarbazine, lomustine, and vincristine chemotherapy in combination with other prognostic factors in anaplastic oligodendroglial brain tumors: a report from EORTC study 26951. J Clin Oncol. 2013;31:328–336. doi: 10.1200/JCO.2012.44.1444. - DOI - PMC - PubMed
-
- Alentorn A, van Thuijl HF, Marie Y, Alshehhi H, Carpentier C, Boisselier B, Laigle-Donadey F, Mokhtari K, Scheinin I, Wesseling P, Ylstra B, Capelle L, Hoang-Xuan K, Delattre JY, Reijneveld JC, Idbaih A. Clinical value of chromosome arms 19q and 11p losses in low-grade gliomas. Neuro Oncol. 2014;16:400–408. doi: 10.1093/neuonc/not227. - DOI - PMC - PubMed
Publication types
MeSH terms
Supplementary concepts
Grants and funding
LinkOut - more resources
Full Text Sources
Other Literature Sources
Medical
