

Effects of contralateral acoustic stimulation on spontaneous otoacoustic emissions and hearing threshold fine structure
- PMID: 25245498
- PMCID: PMC4389962
- DOI: 10.1007/s10162-014-0485-5
Effects of contralateral acoustic stimulation on spontaneous otoacoustic emissions and hearing threshold fine structure
Abstract
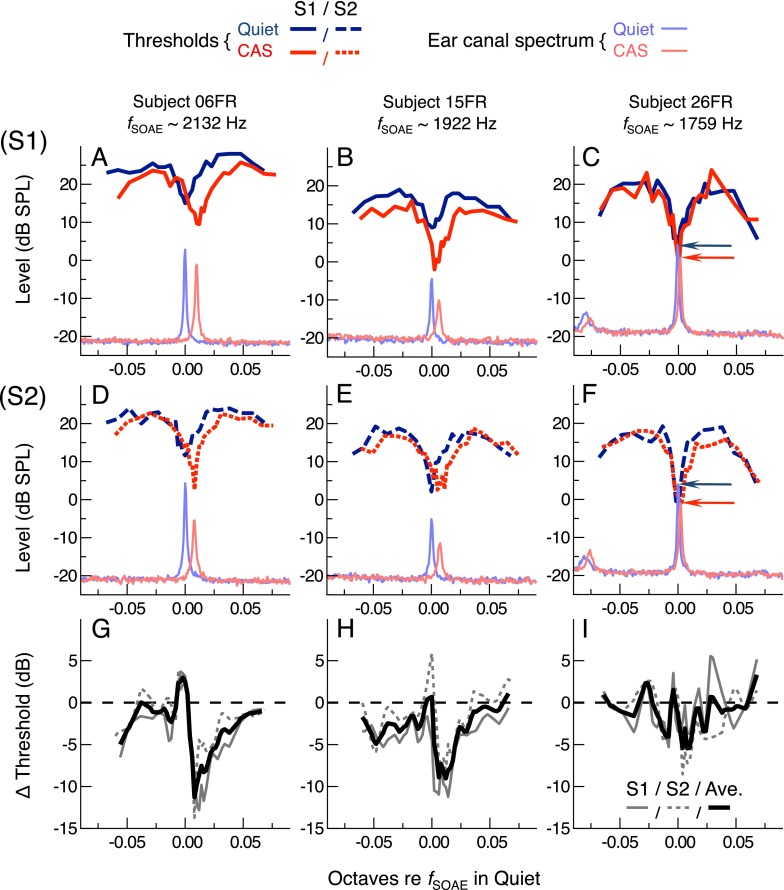
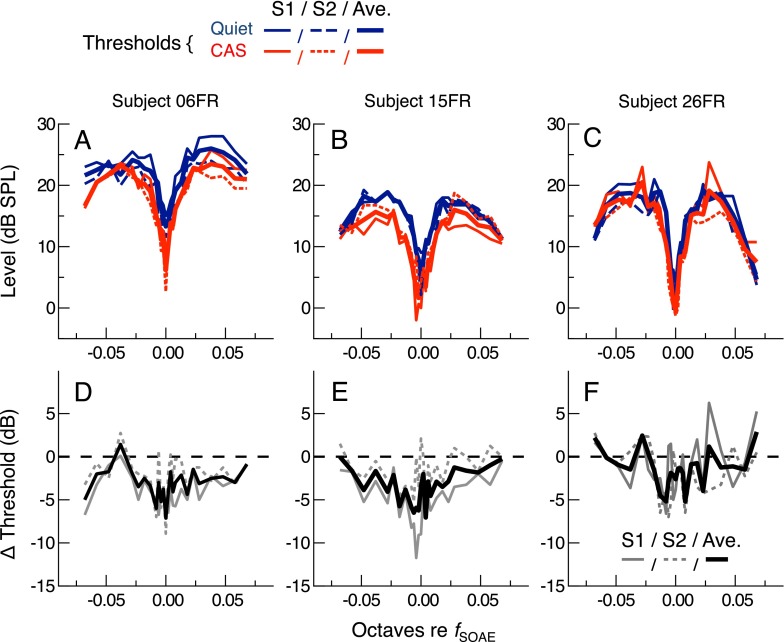
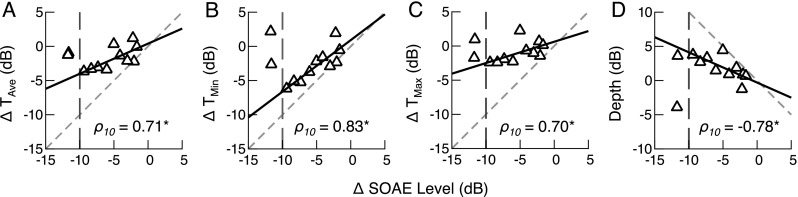
Medial olivocochlear (MOC) influence on cochlear mechanics can be noninvasively, albeit indirectly, explored via the effects of contralateral acoustic stimulation (CAS) on otoacoustic emissions. CAS-mediated effects are particularly pronounced for spontaneous otoacoustic emissions (SOAEs), which are typically reduced in amplitude and shifted upward in frequency by CAS. We investigated whether similar frequency shifts and magnitude reductions were observed behaviorally in the fine structure of pure-tone hearing thresholds, a phenomenon thought to share a common underlying mechanism with SOAEs. In normal-hearing listeners, fine-resolution thresholds were obtained over a narrow frequency range centered on the frequency of an SOAE, both in the absence and presence of 60-dB SPL broadband CAS. While CAS shifted threshold fine structure patterns and SOAEs upward in frequency by a comparable amount, little reduction in the presence or depth of fine structure was observed at frequencies near those of SOAEs. In fact, CAS typically improved thresholds, particularly at threshold minima, and increased fine structure depth when reductions in the amplitude of the associated SOAE were less than 10 dB. Additional measurements made at frequencies distant from SOAEs, or near SOAEs that were more dramatically reduced in amplitude by the CAS, revealed that CAS tended to elevate thresholds and reduce threshold fine structure depth. The results suggest that threshold fine structure is sensitive to MOC-mediated changes in cochlear gain, but that SOAEs complicate the interpretation of threshold measurements at nearby frequencies, perhaps due to masking or other interference effects. Both threshold fine structure and SOAEs may be significant sources of intersubject and intrasubject variability in psychoacoustic investigations of MOC function.
Figures


Similar articles
-
Spontaneous otoacoustic emissions, threshold microstructure, and psychophysical tuning over a wide frequency range in humans.J Acoust Soc Am. 2014 Jan;135(1):300-14. doi: 10.1121/1.4840775. J Acoust Soc Am. 2014. PMID: 24437770 Free PMC article.
-
Effects of contralateral acoustic stimulation on spontaneous otoacoustic emissions.J Acoust Soc Am. 1993 Nov;94(5):2649-58. doi: 10.1121/1.407349. J Acoust Soc Am. 1993. PMID: 8270741
-
Influence of spontaneous otoacoustic emissions on distortion product otoacoustic emission amplitudes.Hear Res. 1999 Jan;127(1-2):129-36. doi: 10.1016/s0378-5955(98)00184-1. Hear Res. 1999. PMID: 9925024
-
Whistling While it Works: Spontaneous Otoacoustic Emissions and the Cochlear Amplifier.J Assoc Res Otolaryngol. 2022 Feb;23(1):17-25. doi: 10.1007/s10162-021-00829-9. Epub 2022 Jan 3. J Assoc Res Otolaryngol. 2022. PMID: 34981262 Free PMC article. Review.
-
Something in Our Ears Is Oscillating, but What? A Modeller's View of Efforts to Model Spontaneous Emissions.J Assoc Res Otolaryngol. 2024 Aug;25(4):313-328. doi: 10.1007/s10162-024-00940-7. Epub 2024 May 6. J Assoc Res Otolaryngol. 2024. PMID: 38710871 Free PMC article. Review.
Cited by
-
A parametric blueprint for optimum cochlear outer hair cell design.J R Soc Interface. 2023 Feb;20(199):20220762. doi: 10.1098/rsif.2022.0762. Epub 2023 Feb 15. J R Soc Interface. 2023. PMID: 36789510 Free PMC article.
-
Olivocochlear efferent function: issues regarding methods and the interpretation of results.Front Syst Neurosci. 2014 Aug 12;8:142. doi: 10.3389/fnsys.2014.00142. eCollection 2014. Front Syst Neurosci. 2014. PMID: 25161612 Free PMC article.
-
Efferent Modulation of Stimulus Frequency Otoacoustic Emission Fine Structure.Front Syst Neurosci. 2015 Dec 10;9:168. doi: 10.3389/fnsys.2015.00168. eCollection 2015. Front Syst Neurosci. 2015. PMID: 26696843 Free PMC article.
-
Synchronized Spontaneous Otoacoustic Emissions Provide a Signal-to-Noise Ratio Advantage in Medial-Olivocochlear Reflex Assays.J Assoc Res Otolaryngol. 2018 Feb;19(1):53-65. doi: 10.1007/s10162-017-0645-5. Epub 2017 Nov 13. J Assoc Res Otolaryngol. 2018. PMID: 29134475 Free PMC article.
-
Sources of Microstructure in Mammalian Cochlear Responses.J Assoc Res Otolaryngol. 2025 Feb;26(1):1-15. doi: 10.1007/s10162-025-00974-5. Epub 2025 Jan 29. J Assoc Res Otolaryngol. 2025. PMID: 39881102 Free PMC article. Review.
References
Publication types
MeSH terms
Grants and funding
LinkOut - more resources
Full Text Sources
Other Literature Sources
Miscellaneous
