. 2015 Jan:88:82-90.
doi: 10.1016/j.neuropharm.2014.09.014. Epub 2014 Sep 22.

Activation of calcineurin underlies altered trafficking of α2 subunit containing GABAA receptors during prolonged epileptiform activity

Affiliations

Activation of calcineurin underlies altered trafficking of α2 subunit containing GABAA receptors during prolonged epileptiform activity

Ramona Eckel et al. Neuropharmacology. 2015 Jan.

Abstract

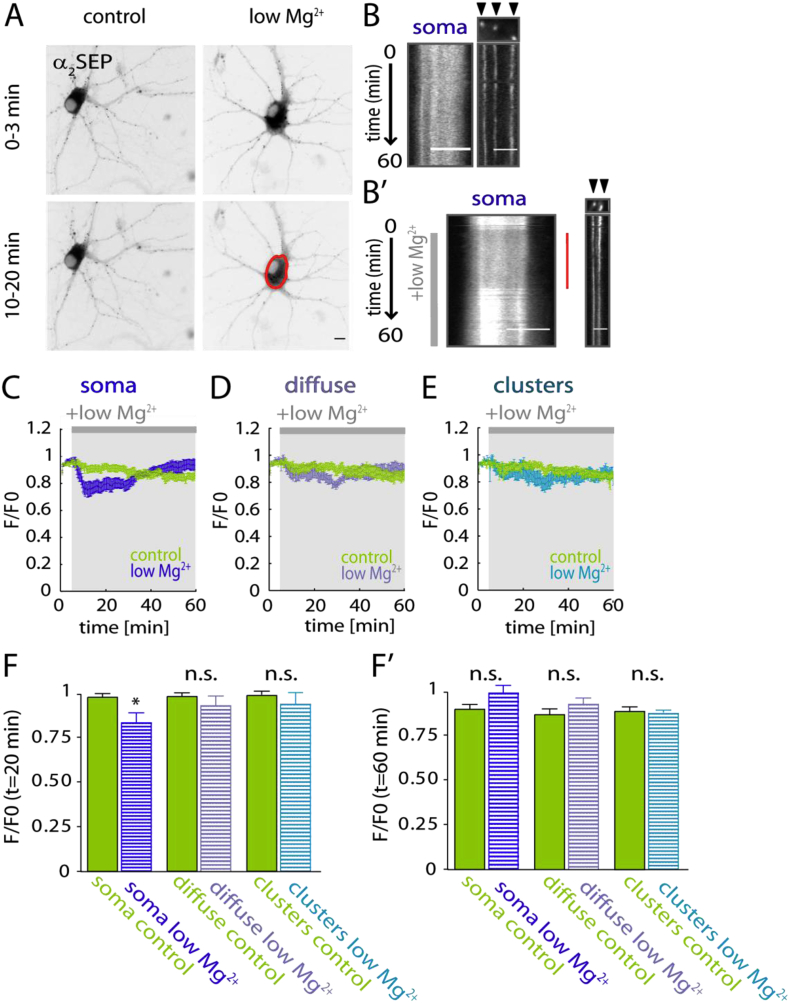
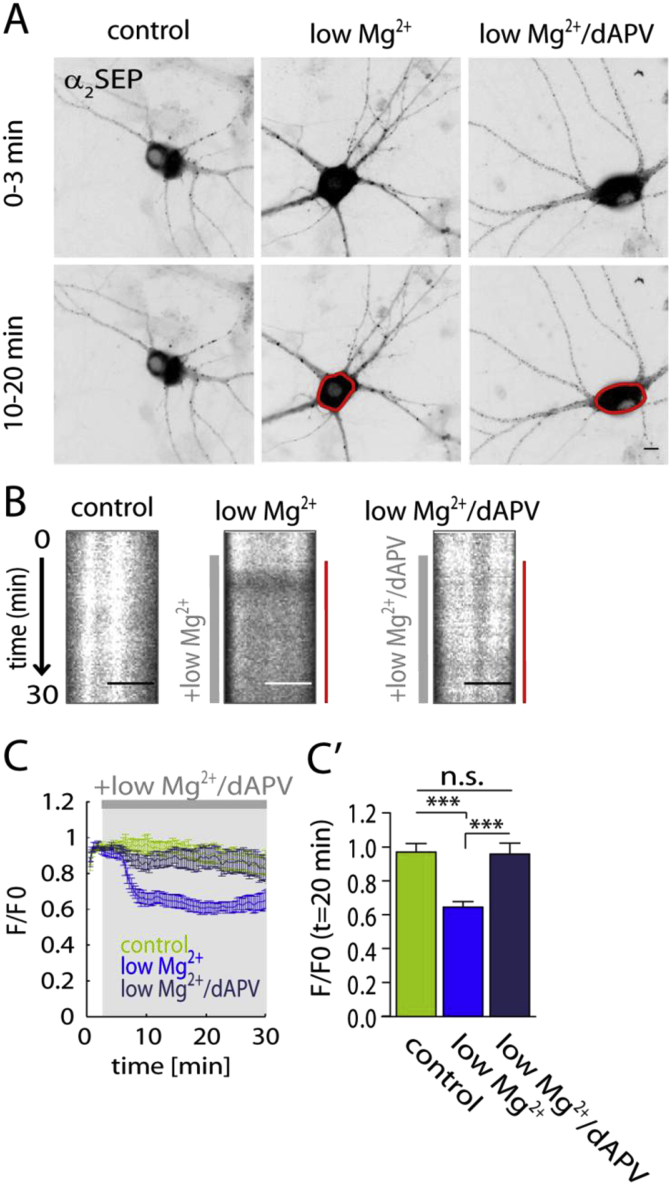
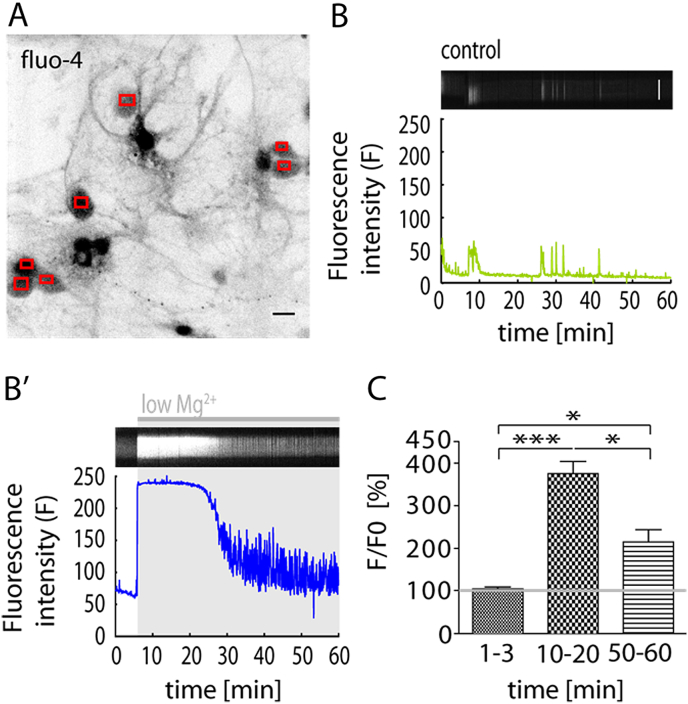
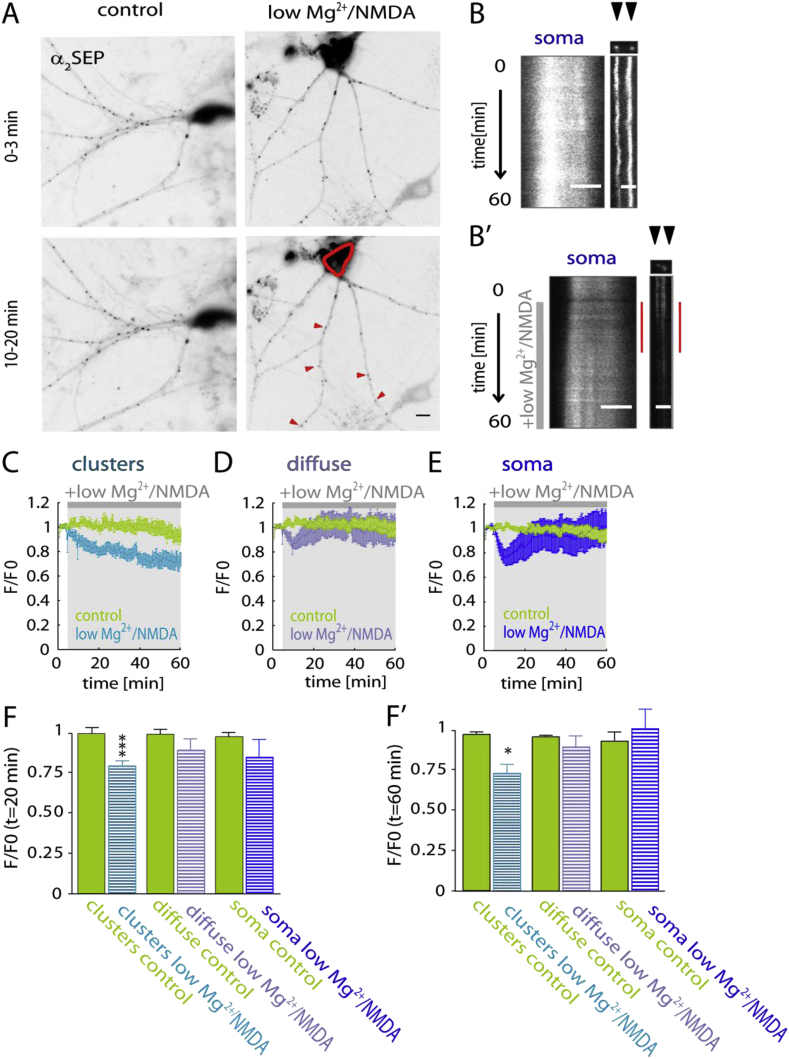
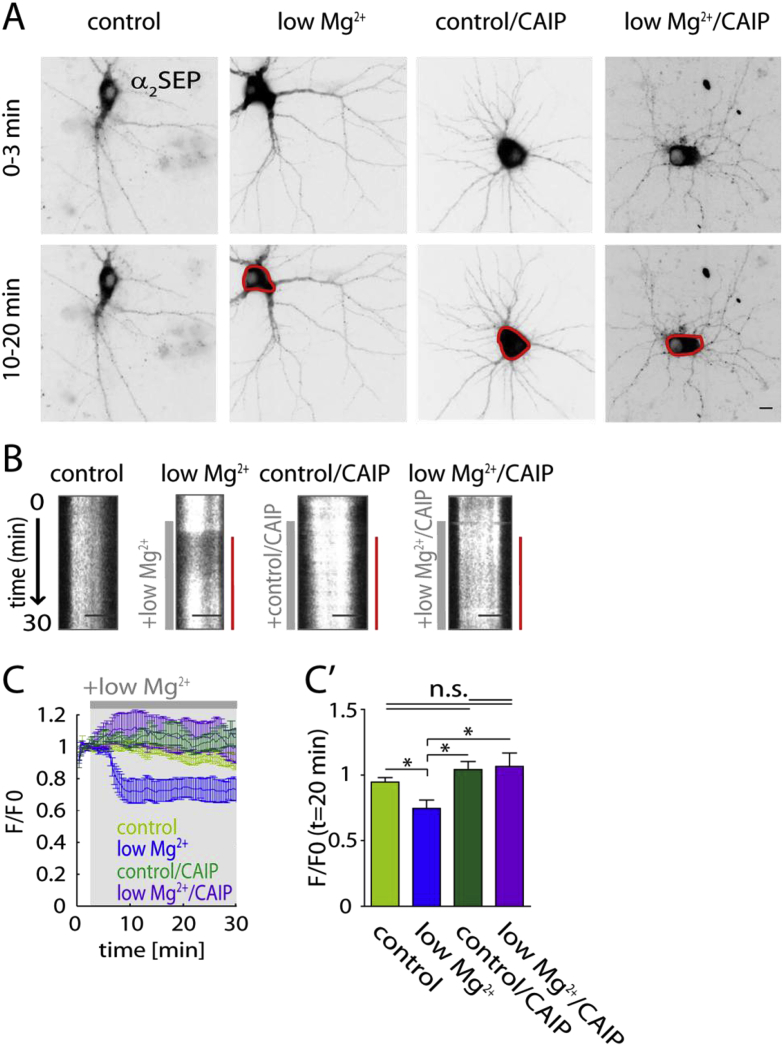
Fast inhibitory signalling in the mammalian brain is mediated by gamma-aminobutyric acid type A receptors (GABAARs), which are targets for anti-epileptic therapy such as benzodiazepines. GABAARs undergo tightly regulated trafficking processes that are essential for maintenance and physiological modulation of inhibitory strength. The trafficking of GABAARs to and from the membrane is altered during prolonged seizures such as in Status Epilepticus (SE) and has been suggested to contribute to benzodiazepine pharmacoresistance in patients with SE. However, the intracellular signalling mechanisms that cause this modification in GABAAR trafficking remain poorly understood. In this study, we investigate the surface stability of GABAARs during SE utilising the low Mg(2+) model in hippocampal rat neurons. Live-cell imaging of super ecliptic pHluorin (SEP)-tagged α2 subunit containing GABAARs during low Mg(2+) conditions reveals that the somatic surface receptor pool undergoes down-regulation dependent on N-methyl-d-aspartate receptor (NMDAR) activity. Analysis of the intracellular Ca(2+) signal during low Mg(2+) using the Ca(2+)-indicator Fluo4 shows that this reduction of surface GABAARs correlates well with the timeline of intracellular Ca(2+) changes. Furthermore, we show that the activation of the phosphatase calcineurin was required for the decrease in surface GABAARs in neurons undergoing epileptiform activity. These results indicate that somatic modulation of GABAAR trafficking during epileptiform activity in vitro is mediated by calcineurin activation which is linked to changes in intracellular Ca(2+) concentrations. These mechanisms could account for benzodiazepine pharmacoresistance and the maintenance of recurrent seizure activity, and reveal potential novel targets for the treatment of SE.

Keywords: Calcium signaling; Epilepsy; GABA(A) receptor; Surface stability; Trafficking.


Figures

Fig. 1
Fig. 1
Somatic surface α2SEP-GABAARs decrease upon low Mg2+ treatment. (A) Representative average intensity projection of α2SEP expression in control and low Mg2+ treated neurons over time (0–3 min and 10–20 min). Scale bar, 10 μm. (B) Kymograph (a line scan vertically projected over time) showing somatic (left; scale bar, 5 μm) and clustered (right; arrow heads indicate clusters; scale bar, 2 μm) α2SEP fluorescence intensity over the movie in control (aCSF) conditions and in the presence of low Mg2+ (grey bar). Red bar on the right indicates a decrease in somatic fluorescence intensity upon low Mg2+ treatment. (C) Average fluorescence intensity of somatic α2SEP GABAAR F/F0: control (green, n = 9 cells) and low Mg2+ (blue, n = 7). (D) Time course of diffuse α2SEP GABAAR F/F0: control (green, n = 9 cells); low Mg2+ (purple, n = 7). (E) Time course of α2SEP GABAAR clusters F/F0: control (green, n = 9 cells) and low Mg2+ (light blue, n = 7). (F) Bar graph of ROI's F/F0: soma (left), diffuse (middle) clusters (right). Significant loss of fluorescence in the soma compared to control at 20 min following low Mg2+ treatment (p = 0.02). Diffuse fluorescence is not altered at 20 min (p = 0.36) after low Mg2+ treatment. Fluorescence intensity of α2SEP GABAAR clusters is unaltered following low Mg2+ treatment (t = 20 min; p = 0.28) compared to control. (F') At 60 min after low Mg2+ treatment somatic (p = 0.09), diffuse (p = 0.85) and clustered (p = 0.42) fluorescence intensity are not significantly altered.*p < 0.05. (For interpretation of the references to colour in this figure legend, the reader is referred to the web version of this article.)
Fig. 2
Fig. 2
NMDARs mediate low Mg2+ induced somatic α2SEP GABAAR surface decrease. (A) Representative images of α2SEP GABAAR fluorescence in control, low Mg2+ and low Mg2+ with dAPV (low Mg2+/dAPV) treated neurons as an average intensity projection over time (0–3 min and 10–20 min). Somatic α2SEP GABAAR loss highlighted in red; scale bar, 10 μm. (B) Kymograph showing somatic (left; scale bar, 5 μm) fluorescence intensity over the movie (duration: 60 min) in control (aCSF) conditions and in the presence of low Mg2+ and low Mg2+/dAPV (grey bar). Red bar on the right indicates decrease in somatic fluorescence intensity upon low Mg2+ treatment and blocking of low Mg2+ induced effect by dAPV (B). (C) Time course of somatic α2SEP GABAAR F/F0: control (green, n = 7 cells), low Mg2+ (blue, n = 8 cells) and low Mg2+/dAPV (dark blue, n = 6 cells). (C') Summary of somatic F/F0 at 20 min after low Mg2+ treatment. Low Mg2+ induces a significant decrease (p < 0.001) in somatic fluorescence intensity, which is inhibited by application of NMDAR blocker dAPV (p < 0.001). ***p < 0.001. (For interpretation of the references to colour in this figure legend, the reader is referred to the web version of this article.)
Fig. 3
Fig. 3
Low Mg2+ treatment induces intracellular Ca2+ accumulation. (A) Representative average intensity projection of fluo-4 loaded neurons (coloured squares indicate individual cell bodies). (B) Raw fluorescence intensity of spontaneous Ca2+ transients in a neuron (bottom) and correlating kymograph (top; segmented line through somatic ROI) showing fluorescence changes over time under control (aCSF) conditions. (B') Raw fluorescence intensity reporting low Mg2+ (grey bar) induced Ca2+ accumulation (bottom) and kymograph (top) indicating increase in fluorescence intensity. (C) Quantification of increase in intracellular Ca2+ (n = 21 cells). Between 10 and 20 min (averaged data points from min 10 to min 20) after low Mg2+ induction, intracellular Ca2+ is significantly elevated (p < 0.001) compared to baseline (averaged data points from min 0 to min 3). At 50–60 min intracellular Ca2+ has decreased (p < 0.001) compared to 10–20 min and significantly increased (p = 0.02) compared to the baseline. *p < 0.05, ***p < 0.001. Scalebar, 10 μm. (For interpretation of the references to colour in this figure legend, the reader is referred to the web version of this article.)
Fig. 4
Fig. 4
Clustered α2SEP GABAARs decrease upon low Mg2+/NMDA treatment. (A) Representative average intensity projection of α2SEP GABAAR fluorescence in control and low Mg2+/NMDA treated neurons over time (0–3 min and 10–20 min). Somatic α2SEP GABAAR fluorescence highlighted in red; scale bar, 10 μm. (B) Kymograph showing somatic (left; scale bar, 5 μm) and clustered (right; scale bar, 2 μm) α2SEP GABAAR fluorescence intensity over the movie in control (aCSF) conditions and in the presence of low Mg2+/NMDA (grey bar). Red bar on the right indicates decrease in somatic α2SEP GABAAR fluorescence intensity upon low Mg2+/NMDA treatment. (C) Average fluorescence intensity time course of clustered α2SEP GABAAR F/F0: control (green, n = 7 cells) and low Mg2+/NMDA, (light blue, n = 9). (D) Time course of diffuse α2SEP GABAAR F/F0: control (green, n = 7 cells); low Mg2+, (purple, n = 9). (E) Time course of somatic α2SEP GABAAR F/F0: control (green, n = 7 cells) and low Mg2+ (blue, n = 9). (F) Bar graph of ROI's F/F0: clusters (left), diffuse (middle) soma (right). Significant loss of fluorescence in the clusters compared to control at 20 min following after low Mg2+ treatment (p = 0.0008). Diffuse fluorescence is not altered upon low Mg2+ treatment at 20 min (p = 0.36) after low Mg2+ treatment. Diffuse fluorescence is unaltered following low Mg2+ treatment (t = 20 min; p = 0.58) compared to control. (F') At 60 after low Mg2+ treatment clustered fluorescence intensity is still significantly reduced (p < 0.001), diffuse (p = 0.99) and somatic (p = 0.63) fluorescence are not significantly altered. *p < 0.05, ***p < 0.001. (For interpretation of the references to colour in this figure legend, the reader is referred to the web version of this article.)
Fig. 5
Fig. 5
Calcineurin mediates the decrease of somatic surface GABAARs during low Mg2+ treatment. (A) Representative images of α2SEP GABAAR fluorescence in control, control with CAIP (control/CAIP), low Mg2+ and low Mg2+ with CAIP (low Mg2+/CAIP) treated neurons as an average intensity projection over time (0–3 min and 10–20 min). Scale bar, 10 μm. (B) Kymographs showing somatic (scale bar: 5 μm) fluorescence intensity over the movie (duration: 30 min) in control conditions, control/CAIP and in the presence of low Mg2+ and low Mg2+/CAIP (grey bar). Red bar on the right indicates decrease in somatic fluorescence intensity upon low Mg2+ treatment. (C) Average fluorescence intensity of α2SEP GABAAR F/F0: control (light green, n = 6 cells); low Mg2+ (dark blue, n = 7 cells); control/CAIP (dark green, n = 6); low Mg2+/CAIP (purple, n = 6). (C') Bar graph showing quantification of α2SEP GABAAR F/F0 at t = 20 min. Somatic fluorescence intensity of low Mg2+ treated cells is significantly decreased compared to control at t = 20 min (dark blue bar, p < 0.05). Treatment of low Mg2+ perfused cells with a calcineurin autoinhibitory peptide prevents the change in fluorescence intensity (dark green bar, p < 0.05). Treatment with calcineurin autoinhibitory peptide alone does not significantly alter the fluorescence intensity of GABAAR α2SEP (magenta bar, p > 0.05). *p < 0.05. (For interpretation of the references to colour in this figure legend, the reader is referred to the web version of this article.)

Similar articles

Cited by

References

    1. Albowitz B., König P., Kuhnt U. Spatiotemporal distribution of intracellular calcium transients during epileptiform activity in guinea pig hippocampal slices. J. Neurophysiol. 1997;77(1):491–501. - PubMed
    1. Bannai H. Activity-dependent tuning of inhibitory neurotransmission based on GABAAR diffusion dynamics. Neuron. 2009;62(5):670–682. - PubMed
    1. Blair R.E. Epileptogenesis causes acute and chronic increases in GABAA receptor endocytosis that contributes to the induction and maintenance of seizures in the hippocampal culture model of acquired epilepsy. J. Pharmacol. Exp. Ther. 2004;310(3):871–880. http://www.ncbi.nlm.nih.gov/pubmed/15084648 Available at: (accessed 11.06.14.) - PubMed
    1. Bogdanov Y. Synaptic GABAA receptors are directly recruited from their extrasynaptic counterparts. EMBO J. 2006;25(18):4381–4389. http://www.pubmedcentral.nih.gov/articlerender.fcgi?artid=1570424&tool=p... Available at: (accessed 28.05.14.) - PMC - PubMed
    1. Brünig I. Intact sorting, targeting, and clustering of gamma-aminobutyric acid A receptor subtypes in hippocampal neurons in vitro. J. Comp. Neurol. 2002;443(1):43–55. - PubMed

Publication types