. 2014 Nov 7;289(45):31241-52.
doi: 10.1074/jbc.M114.584086. Epub 2014 Sep 22.

Second transmembrane helix (M2) and long range coupling in Ca²⁺-ATPase

Affiliations

Second transmembrane helix (M2) and long range coupling in Ca²⁺-ATPase

Takashi Daiho et al. J Biol Chem. .

Abstract

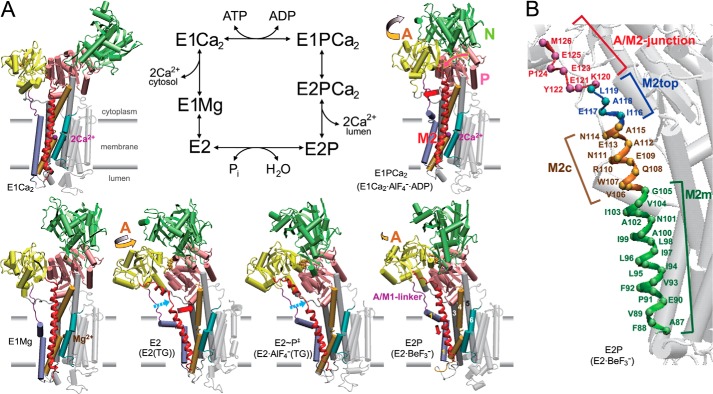
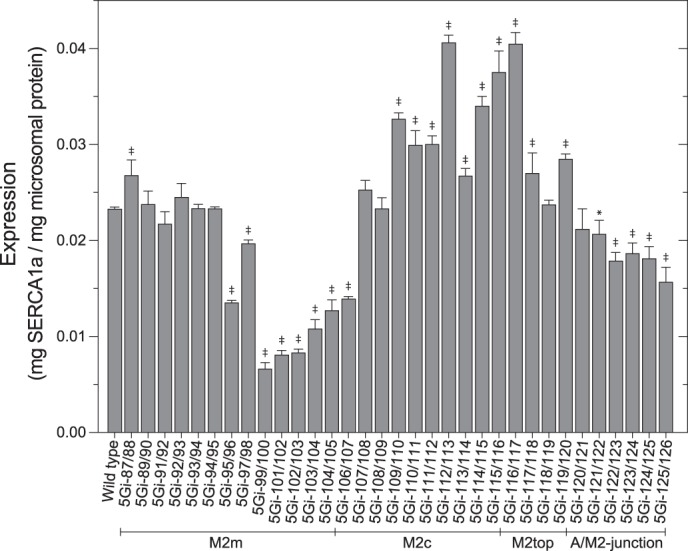
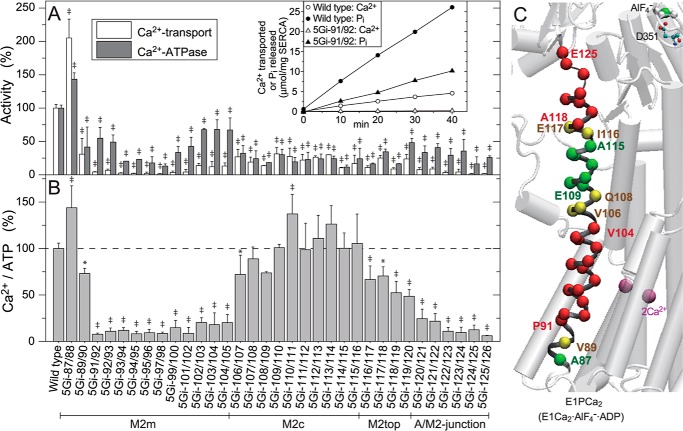
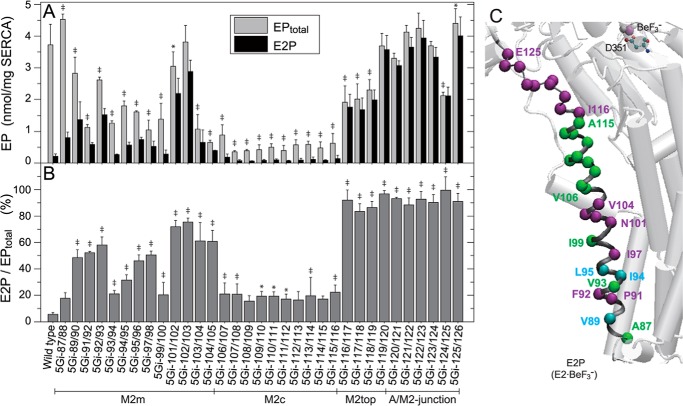
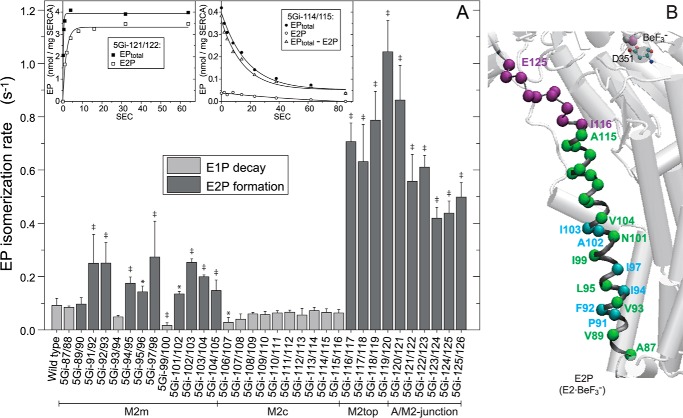
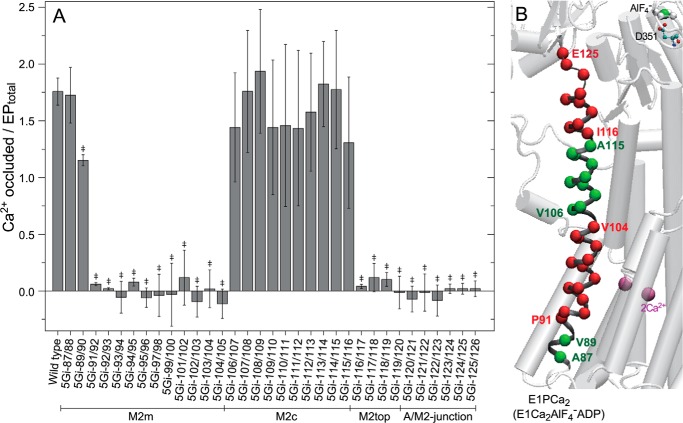
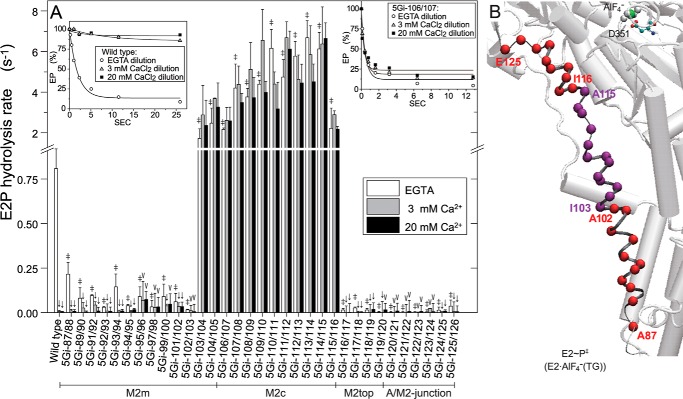
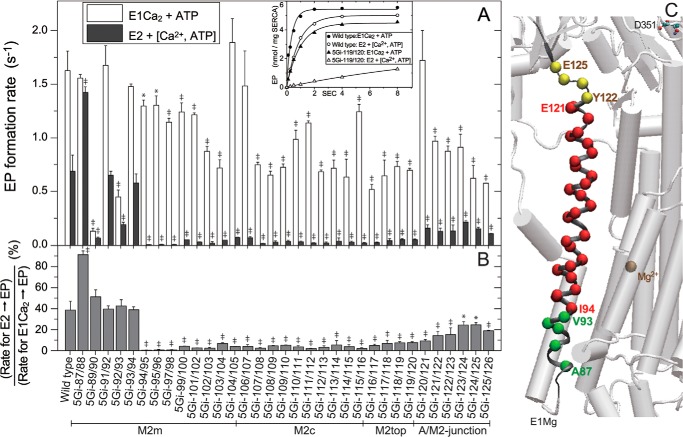
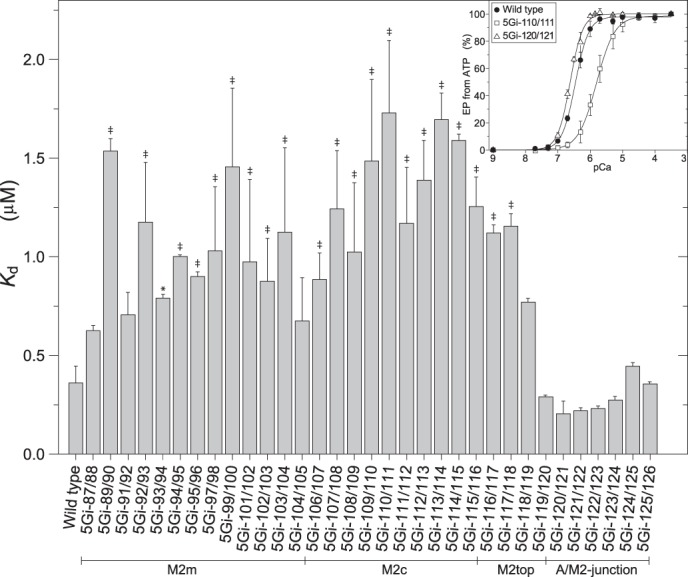
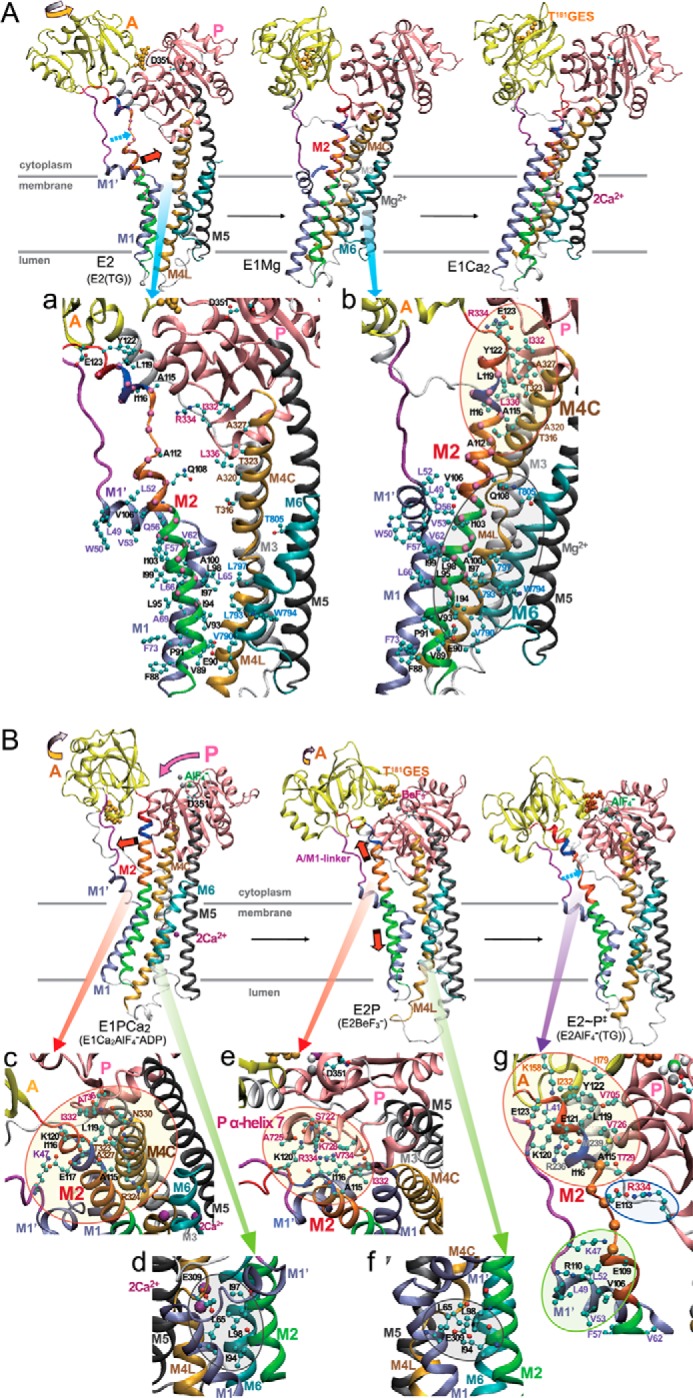
The actuator (A) domain of sarco(endo)plasmic reticulum Ca(2+)-ATPase not only plays a catalytic role but also undergoes large rotational movements that influence the distant transport sites through connections with transmembrane helices M1 and M2. Here we explore the importance of long helix M2 and its junction with the A domain by disrupting the helix structure and elongating with insertions of five glycine residues. Insertions into the membrane region of M2 and the top junctional segment impair Ca(2+) transport despite reasonable ATPase activity, indicating that they are uncoupled. These mutants fail to occlude Ca(2+). Those at the top segment also exhibited accelerated phosphoenzyme isomerization E1P → E2P. Insertions into the middle of M2 markedly accelerate E2P hydrolysis and cause strong resistance to inhibition by luminal Ca(2+). Insertions along almost the entire M2 region inhibit the dephosphorylated enzyme transition E2 → E1. The results pinpoint which parts of M2 control cytoplasm gating and which are critical for luminal gating at each stage in the transport cycle and suggest that proper gate function requires appropriate interactions, tension, and/or rigidity in the M2 region at appropriate times for coupling with A domain movements and catalysis.

Keywords: Calcium ATPase; Domain Motion; Enzyme Kinetics; Enzyme Mutation; Enzyme Structure; Phosphoenzyme Intermediate; Phosphoryl Transfer; Sarco(endo)plasmic Reticulum; Transmembrane Helix.


Figures

FIGURE 1.
FIGURE 1.
Reaction cycle and structural changes of Ca2+-ATPase. A, the structural changes are modeled on the crystal structures E1Ca2·AlF4·ADP as the E1∼P·ADP·Ca2 analog (PDB code 1T5T (10)), E2·BeF3 as the E2P ground state analog (7) (PDB code 2ZBE (11)), E2·AlF4(TG) as the transition state analog for E2P hydrolysis (7) (PDB 2ZBG (11)), E2(TG) as the E2 state fixed with thapsigargin (PDB 1IWO (6)), E1Mg2+ (PDB 3W5A (14)), and E1Ca2 (PDB 1SU4 (4)). The structures are aligned with the static M8–M10 helices. The N, P, and A domains and M1–M6 helices are colored as indicated. The approximate position of the membrane is shown by gray lines. The binding sites for two Ca2+ (purple spheres) consist of residues on M4, M5, M6, and M8. The yellow, pink, and red arrows indicate the approximate motions of the A and P domains and M2 (depicted in red), respectively, to the next structural state during the EP processing (isomerization and hydrolysis) and the E2 → E1 transition. The broken light blue arrow indicates the unwound M2 part. B, the regions of M2 are named as M2m (transmembrane part), M2c (cytoplasmic part), M2top (top part), and A/M2-junction (junction with the A domain) and indicated with different colors on the α-carbon of residues.
FIGURE 2.
FIGURE 2.
Expression levels. The expression levels of wild-type and 5Gi mutant SERCA1a in the microsomes prepared from COS-1 cells were determined and shown as values relative to the total amount of protein in the microsomes. Statistical significance compared with the wild type is shown as follows: *, p < 0.05; ‡, p < 0.01. Error bars, S.D.
FIGURE 3.
FIGURE 3.
Ca2+-ATPase and oxalate-dependent Ca2+ transport activities. A, the specific activities of the expressed SERCA1a 5Gi mutants were determined and shown as values relative to the respective wild-type activities (ATP hydrolysis, 0.594 ± 0.028 μmol of Pi/min/mg of SERCA1a protein (n = 5); oxalate-dependent Ca2+ transport, 0.116 ± 0.006 μmol Ca2+/min/mg SERCA1a protein (n = 5); very similar to the values obtained by our group and other groups under optimum conditions with the microsomes prepared from the COS cells (e.g. see Refs. 29, 47–49)). Typical time courses of Pi liberation and Ca2+ accumulation in the wild type and mutant 5Gi-91/92 are shown in the inset. B, the coupling ratio (i.e. Ca2+ transport activity per Ca2+-ATPase activity (Ca2+/ATP)), is shown as a percentage of the wild-type ratio. In A and B, statistical significance compared with the respective wild-type value is shown; *, p < 0.05; ‡, p < 0.01. C, the mutational effects of residues in B are visualized with α-carbon coloring on M2; green, Ca2+/ATP higher than 80% of the wild type (coupled transport); yellow, 80 to 60% (slightly uncoupled); red, less than 60% (severely uncoupled). Error bars, S.D.
FIGURE 4.
FIGURE 4.
Total amount of EP (EPtotal) at steady state and E2P fraction. A, microsomes expressing wild type or the 5Gi mutant were phosphorylated with [γ-32P]ATP at 0 °C for 1 min in 50 μl of a mixture containing 1–5 μg of microsomal protein, 10 μm [γ-32P]ATP, 1 μm A23187, 0.1 m KCl, 7 mm MgCl2, 0.1 mm CaCl2, and 50 mm MOPS/Tris (pH 7.0). The EPtotal formed (gray bars) was determined by acid quenching. For determination of E2P (closed bars), an equal volume of a mixture containing 2 mm ADP, 1 μm A23187, 0.1 m KCl, 7 mm MgCl2, 10 mm EGTA, and 50 mm MOPS/Tris (pH 7.0) was added to the above phosphorylation mixture, and the reaction was quenched at 1 s after the ADP addition. ADP-sensitive EP (E1P) disappeared entirely within 1 s after the ADP addition. B, the E2P fraction in EPtotal (E1P plus E2P) is shown. Statistical significance compared with the wild type is shown for EPtotal (A) and for E2P/EPtotal (B): *, p < 0.05; ‡, p < 0.01. C, the mutation effects of residues in B are visualized with α-carbon coloring: green, E2P/EPtotal less than 30% (almost no or slight E2P increase); light blue, 30–50% (moderate increase); purple, higher than 50% (marked increase). Error bars, S.D.
FIGURE 5.
FIGURE 5.
EP isomerization rate. A, for the wild type and mutants that accumulate mostly E1P at steady state (E2P less than 30% of EPtotal; cf. Fig. 4), the E1P to E2P isomerization rate was determined by E1P decay kinetics, which represent the rate-limiting E1P to E2P isomerization (mutant 5Gi-114/115 (right inset) is a typical example). Here, the Ca2+-ATPase was first phosphorylated with [γ-32P]ATP at 0 °C for 1 min as in Fig. 4; phosphorylation was terminated by Ca2+ removal and the addition of an equal volume of a buffer containing 10 mm EGTA, 0.1 m KCl, 7 mm MgCl2, and 50 mm MOPS/Tris (pH 7.0) at 0 °C; and the amounts of EPtotal and E2P were determined at the indicated times. The amount of E1P was calculated by subtracting E2P from EPtotal (EPtotalE2P). Solid lines show the least squares fit to a single exponential, and the E1P decay rates thus obtained are shown in the main panel (light gray bar). For the mutants that accumulate E2P more than 30% of EPtotal (cf. Fig. 4), the EP isomerization rate was determined as the apparent rate of E2P formation from E1P to reach steady state as follows (mutant 5Gi-121/122 (left inset) is a typical example). Here, the Ca2+-ATPase was phosphorylated for the indicated periods after ATP addition, and the amounts of EPtotal and E2P were determined; otherwise, conditions were as described above. The formation of EP (EPtotal, representing E1PCa2 formation from E1Ca2) was very fast (reaching a steady state within ∼1 s) and was followed by E2P formation from E1PCa2. Solid lines show the least squares fit to a single exponential, and the apparent rates of E2P formation are shown in the main panel (dark gray bar). Statistical significance compared with the wild type is shown: *, p < 0.05; ‡, p < 0.01. B, the mutation effects of residues in A are visualized with α-carbon coloring: green, transition rate less than 0.15 s−1 (almost no effect or only a slight effect); light blue, 0.15–0.3 s−1 (moderate acceleration); purple, higher than 0.3 s−1 (marked acceleration). Error bars, S.D.
FIGURE 6.
FIGURE 6.
Ca2+ occlusion in EP. A, phosphorylation was performed with ATP in 10 μm 45Ca2+; otherwise conditions were as in Fig. 4. The amount of Ca2+ occluded was determined as described under “Experimental Procedures” and is shown as the value relative to EPtotal (mean ± S.D. (n = 8–18)). Statistical significance compared with the wild type is shown: *, p < 0.05; ‡, p < 0.01. B, the mutation effects of residues in A are visualized with α-carbon coloring; green, Ca2+ occluded/EPtotal above 1.0; red, below 0.15. Error bars, S.D.
FIGURE 7.
FIGURE 7.
E2P hydrolysis and luminal Ca2+-induced inhibition. A, microsomes expressing wild type or mutant were phosphorylated with 32Pi at 25 °C for 10 min in 5 μl of a mixture containing 1–5 μg of microsomal protein, 0.1 mm 32Pi, 1 μm A23187, 0.2 mm EGTA, 7 mm MgCl2, 50 mm MOPS/Tris (pH 7.0), and 35% (v/v) Me2SO. The mixture was then cooled and diluted at 0 °C by the addition of 95 μl of a mixture containing 2.1 mm non-radioactive Pi, 105 mm KCl, 7 mm MgCl2, 50 mm MOPS/Tris (pH 7.0), and 3 mm EGTA (open bar) or 3.2 mm (gray bar) and 21.1 mm (closed bar) CaCl2 in place of EGTA, and E2P hydrolysis was followed (see typical examples with wild type and 5Gi-106/107 in the inset). The amounts of E2P formed with 32Pi at zero time are normalized to 100%. Solid lines show the least squares fit to a single exponential, and the rates thus obtained are shown in the main panel. In the absence of Ca2+, statistical significance of the mutant rate compared with the wild-type rate is shown above an open bar: *, p < 0.05; ‡, p < 0.01. In each of the mutants and the wild type, statistical significance of the rate in 3 and 20 mm Ca2+ compared with that in the absence of Ca2+ is shown above a gray bar and closed bar: V, p < 0.05; ↓, p < 0.01. B, the marked retardation and acceleration in the absence of Ca2+ (open bars in A) are visualized with α-carbon coloring, red and purple, respectively. Error bars, S.D.
FIGURE 8.
FIGURE 8.
EP formation from E2 and E1Ca2 states. A, microsomes expressing wild type or mutant were preincubated for 20 min at 25 °C in 50 μl of a mixture containing 1–5 μg of microsomal protein, 1 μm A23187, 0.1 m KCl, 7 mm MgCl2, 50 mm MOPS/Tris (pH 7.0), and 1 mm EGTA with and without 1.2 mm CaCl2 (to form the Ca2+-bound (open bar) and unbound (closed bar) states, respectively). After cooling, an equal volume of a phosphorylation mixture containing 10 μm [γ-32P]ATP and 1 mm EGTA with 1.2 or 2.4 mm CaCl2 (to give 0.2 mm Ca2+ for both Ca2+-bound and Ca2+-unbound states) (otherwise as above) was added at 0 °C, and the EP formation time course was followed. In the inset, typical examples with the wild type and mutant 5Gi-119/120 are shown. Solid lines show the least squares fit to a single exponential, and the rates thus determined are shown in the main panel. The Ca2+-unbound state was denoted as E2 for simplicity, and the ratio of the two rates is shown in B. In A and B, statistical significance compared with the respective wild-type value is shown: *, p < 0.05; ‡, p < 0.01. C, the observed effects on the rate-limiting process E2 → E1 in B are visualized with α-carbon coloring; green, no effect or acceleration (ratio higher than 35%); yellow, retardation (ratio 30–15%); red, marked retardation (ratio lower than 15%). Error bars, S.D.
FIGURE 9.
FIGURE 9.
Ca2+ affinity determined with EP formation. The microsomes expressing wild type or mutant were preincubated for 20 min at 25 °C in 45 μl of a mixture containing 1–5 μg of microsomal protein, 2 mm EGTA, 1 μm A23187, 0.1 m KCl, 7 mm MgCl2, 50 mm MOPS/Tris (pH 7.0), and various concentrations of CaCl2 to give the desired Ca2+ concentrations. After cooling, the Ca2+-ATPase was phosphorylated with 10 μm [γ-32P]ATP for 15 s at 0 °C, and the amount of EP formed was determined. In the inset, the typical Ca2+ dependence of EP formation was shown for the wild type and the two mutants including 5Gi-110/111, which gave the highest Kd value. The Kd value and Hill coefficient were estimated by least squares fit to the Hill equation (solid line). The Hill coefficient obtained was ∼2 (actually 1.6–2) in the wild type and all of the mutants. Statistical significance compared with the wild type is shown: *, p < 0.05; ‡, p < 0.01. Error bars, S.D.
FIGURE 10.
FIGURE 10.
Detailed inspection of structure and interactions of M2 in crystal structures. The structural changes are modeled as in Fig. 1A. The N domain and M7–M10 helices are not depicted for simplicity. The red (A and B), ice blue (A), yellow (A and B), and pink (B) arrows indicate the approximate motions of M2, M1′, A domain, and P domain, respectively. The broken light blue arrow (A and B) indicates the unwound part of M2. The TGES184 loop is depicted with orange van der Waals spheres. Interactions involving M2 regions are shown in transparent circles in enlarged views. See “Discussion” for the details and the roles of M2 regions.

Similar articles

Cited by

References

    1. Toyoshima C. (2008) Structural aspects of ion pumping by Ca2+-ATPase of sarcoplasmic reticulum. Arch. Biochem. Biophys. 476, 3–11 - PubMed
    1. Toyoshima C. (2009) How Ca2+-ATPase pumps ions across the sarcoplasmic reticulum membrane. Biochim. Biophys. Acta 1793, 941–946 - PubMed
    1. Møller J. V., Olesen C., Winther A.-M. L., Nissen P. (2010) The sarcoplasmic Ca2+-ATPase: design of a perfect chemi-osmotic pump. Q. Rev. Biophys. 43, 501–566 - PubMed
    1. Toyoshima C., Nakasako M., Nomura H., Ogawa H. (2000) Crystal structure of the calcium pump of sarcoplasmic reticulum at 2.6 Å resolution. Nature 405, 647–655 - PubMed
    1. Danko S., Yamasaki K., Daiho T., Suzuki H., Toyoshima C. (2001) Organization of cytoplasmic domains of sarcoplasmic reticulum Ca2+-ATPase in E1P and E1ATP states: a limited proteolysis study. FEBS Lett. 505, 129–135 - PubMed

Publication types

LinkOut - more resources