. 2014 Oct 7;111(40):E4165-74.
doi: 10.1073/pnas.1416745111. Epub 2014 Sep 22.

Modeling putative therapeutic implications of exosome exchange between tumor and immune cells

Affiliations

Modeling putative therapeutic implications of exosome exchange between tumor and immune cells

Mingyang Lu et al. Proc Natl Acad Sci U S A. .

Abstract

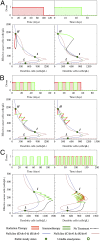
Development of effective strategies to mobilize the immune system as a therapeutic modality in cancer necessitates a better understanding of the contribution of the tumor microenvironment to the complex interplay between cancer cells and the immune response. Recently, effort has been directed at unraveling the functional role of exosomes and their cargo of messengers in this interplay. Exosomes are small vesicles (30-200 nm) that mediate local and long-range communication through the horizontal transfer of information, such as combinations of proteins, mRNAs and microRNAs. Here, we develop a tractable theoretical framework to study the putative role of exosome-mediated cell-cell communication in the cancer-immunity interplay. We reduce the complex interplay into a generic model whose three components are cancer cells, dendritic cells (consisting of precursor, immature, and mature types), and killer cells (consisting of cytotoxic T cells, helper T cells, effector B cells, and natural killer cells). The framework also incorporates the effects of exosome exchange on enhancement/reduction of cell maturation, proliferation, apoptosis, immune recognition, and activation/inhibition. We reveal tristability-possible existence of three cancer states: a low cancer load with intermediate immune level state, an intermediate cancer load with high immune level state, and a high cancer load with low immune-level state, and establish the corresponding effective landscape for the cancer-immunity network. We illustrate how the framework can contribute to the design and assessments of combination therapies.

Keywords: cancer exosomes; cancer landscape; cancer therapy; computational modeling; exosome communication.


Conflict of interest statement

The authors declare no conflict of interest.

Figures

Fig. 1.
Fig. 1.
Illustration of the ECI model for cancer–immune interplays. The coarse-grained network model contains three major components: the effective cancer cells (C), the dendritic cells (D), and the killer cells (K). The links among different cell types represent the effects of cell–cell communication. An arrow denotes activation; a bar denotes inhibition; an arrow plus a bar from C to D represents activation when the C population is small and an inhibition when the C population is large. The green spheres represent cell communications that are partially mediated by exosomes. (A) Full model (case I). (B) Model without exosome-mediated interactions between C and D (case II).
Fig. 2.
Fig. 2.
Phase-plane analysis for the ECI model. In each case, a phase plane is constructed by the concentration of the dendritic cells (D, x axis) and the effective cancer cells (C, y axis). The nullcline dD/dt = 0 and dK/dt = 0 is shown in solid navy line and dC/dt = 0 and dK/dt = 0 is shown in solid brown line. The intersections of these two nullclines are the steady states, represented by solid green circles for stable states and hollow green circles for unstable states. The gray arrows represent the vector field in a stream plot. The background colors illustrate the values of the effective landscape [−log(P)] computed by stochastic simulations of the network with white Gaussian noise. The states are most probable at the blue regions and least probable at the red/white regions. (A and B) Case I (when exosome exchange is included). (C and D) Case II (when exosome exchange is excluded). The immune recognition is at a low level (with value ρ = 0.2) for A and C, and it is at the basal level (with value ρ = 1.0) for B and D. When exosome exchange is included and ρ = 1.0 (B), the network allows three stable steady states—a high cancer load with low immune level state (H), an intermediate cancer load with high immune level state (I), and a low cancer load with intermediate immune level state (L). In contrast, when exosome exchange is excluded and ρ = 1.0 (D), the network allows only two stable steady states—an intermediate cancer load with high immune level, state (1/2, 1) and a low cancer load with intermediate immune level, state (0, 1/2).
Fig. 3.
Fig. 3.
Bifurcation diagrams for the steady states as a function of the level of immune recognition ρ. The diagrams show, for each value of immune recognition (ρ, x axis), the steady-state concentrations for the effective cancer cells (A) and the dendritic cells (B). The states along the solid blue curves are the stable states, and those along the dashed red curves are the unstable states. The whole bifurcation curve is composed of segments of stable/unstable states, from which we define the high cancer state (H), the intermediate cancer state (I), and the low cancer state (L) (SI Appendix, section 5). Depending on the level of immune response, the system is at one of the four phases as represented by different background colors. Red is for the phase {H}, which has only the (H) state; yellow is for the phase {L, H}, which allows existence of both the (L) and (H) states, green is for the phase {L,I,H}, which allows existence of all three states; and blue is for the phase {L}, which has only the (L) state. During tumorigenesis when ρ changes, some transitions among different states could take place (illustrated in dashed black lines and arrows), and are labeled with numbers. Three purple lines show the trajectories of development of tumor (with different rates of immune respond to tumor), and solid purple circles show the final states when full immune recognition is established. (C and D) Same bifurcation diagram in 3D (with axes C, D, and ρ) and in two perspectives.
Fig. 4.
Fig. 4.
Sensitivity of the existence of the intermediate state to the model parameters. In each test, all 36 parameters are randomly perturbed by a maximum of ±d (chosen from 10%, 20% … 60%). Similar to Fig. 3, a bifurcation diagram with respect to the level of immune recognition ρ is generated to check the existence of the intermediate state and the existence of three stable states. (A) Percentage of the existence of the intermediate state (blue columns) and the tristability (red columns) from a total of 10,000 tests. (B) From those cases in which the intermediate state or the tristability exists, shown are the mean and SD of the range of existence in ρ for the intermediate state and for tristability. The dotted line shows the baseline, responding to the lengths of the intermediate state and the tristability for the case with the original (unperturbed) parameters (they overlap, because both lengths have the same values in ρ).
Fig. 5.
Fig. 5.
The effects of time delay in exosome-mediated communication on the cancer–immunity landscape. The dynamics of the ECI model are tested in multiple cases, each of which has different time delays for exosome-mediated communication between C and D (Methods). In the test, the system is suddenly moved from the high cancer state (the initial state) to a new state in the phase plane as a consequence of hypothetical treatment. Once released, the system follows its dynamical trajectory, and eventually reaches to one of the quasi-stable steady states. The basin of attraction for each quasi-stable steady state is defined as the region in the landscape (phase plane), from which the dynamical trajectories converge to the target stable state. The whole phase plane is divided by the three basins for the high cancer state (navy), the intermediate state (blue), and the low cancer state (light blue). (A) Phase planes for the cases of no delay (Upper Left), 15-d delay (Upper Right), 50-d delay (Lower Left), and 150-d delay (Lower Right). (B) Scatter plot shows the dependency of the fraction of the high-cancer basin of attraction (in area) on the value of the time delay.
Fig. 6.
Fig. 6.
Assessment of hypothetical radiation therapy with the ECI model. The hypothetical therapy is composed of 30 one-per-day radiation sessions (modeled as an increase in the apoptosis rate of all cell types; Methods) from day 10 (point 0) to day 40 (point 1; B). (A) Dynamical trajectory in the phase plane. (C) Time evolution of the concentrations of the dendritic cells. (D) Experimental data on the phagocytic activity of monocytes for breast cancer patients after 30-d radiation therapy (data from ref. 59). The solid red lines and areas are the trajectory and doses for the radiation therapy, and the dashed black lines are the trajectory for the system after the treatment. As in Fig. 2, nullclines are shown in navy and brown solid lines, and steady states are shown as solid green circles (stable) and hollow green circles (unstable).
Fig. 7.
Fig. 7.
Assessment of various therapeutic strategies with the ECI model. Similar to Fig. 6, we show in A–C the dose use (Upper) and the dynamical trajectory in the phase plane (Lower). The session of radiation therapy is shown in red and the session of DC immunotherapy (modeled as an increase in the proliferation rate of the dendritic cells; Methods) is shown in green. (A) Hypothetical treatment from the (H) state to the (I) state in the case of the standalone radiation therapy (Lower Left), and the standalone DC immunotherapy (Lower Right). (B) Two cases of alternating combined therapy by both radiation therapy and immunotherapy. (C) Hypothetical treatment from the (I) to (L) state by the standalone immunotherapy (Lower Left), and an alternating combined treatment by both the radiation therapy and the immunotherapy (Lower Right).
Fig. 8.
Fig. 8.
The effects of noise on the treatment by hypothetical immunotherapy. (A) Landscape for the system with white Gaussian noise. The noise level is not high enough to trigger transitions from (H) to (I) states. Without noise, a treatment of 25-d immunotherapy (solid green line, same as Fig. 7A, Right) causes the system to transit from (H) to (I). With noise, the same treatment could either succeed (solid yellow line) or fail (solid black line) in making such a transition. We further select five different states (white dots in Inset) as the initial states for the treatment, where state 3 is the original stable steady state. (B) Percentage of successful transitions by the same treatment. In the absence of noise, the system always makes (H)-to-(I) transitions for states 3, 4, and 5 (blue columns). In the presence of noise, the system has higher successful transitions from (H) to (I) when the initial state is closer to the saddle point (e.g., state 5, orange columns). In some rare occasions (<5%), the system can also directly transit to the (L) state from the (H) state (red columns).

References

    1. Schlom J. Therapeutic cancer vaccines: Current status and moving forward. J Natl Cancer Inst. 2012;104(8):599–613. - PMC - PubMed
    1. Leach DR, Krummel MF, Allison JP. Enhancement of antitumor immunity by CTLA-4 blockade. Science. 1996;271(5256):1734–1736. - PubMed
    1. Mougiakakos D, Choudhury A, Lladser A, Kiessling R, Johansson CC. In: Advances in Cancer Research. Vande Woude GF, Klein G, editors. Academic; New York: 2010. pp. 57–117. - PubMed
    1. Sica A, Schioppa T, Mantovani A, Allavena P. Tumour-associated macrophages are a distinct M2 polarised population promoting tumour progression: Potential targets of anti-cancer therapy. Eur J Cancer. 2006;42(6):717–727. - PubMed
    1. Bhatia A, Kumar Y. Cancer-immune equilibrium: Questions unanswered. Cancer Microenviron. 2011;4(2):209–217. - PMC - PubMed

Publication types

MeSH terms