

Application of desorption electrospray ionization mass spectrometry imaging in breast cancer margin analysis
- PMID: 25246570
- PMCID: PMC4210338
- DOI: 10.1073/pnas.1408129111
Application of desorption electrospray ionization mass spectrometry imaging in breast cancer margin analysis
Abstract
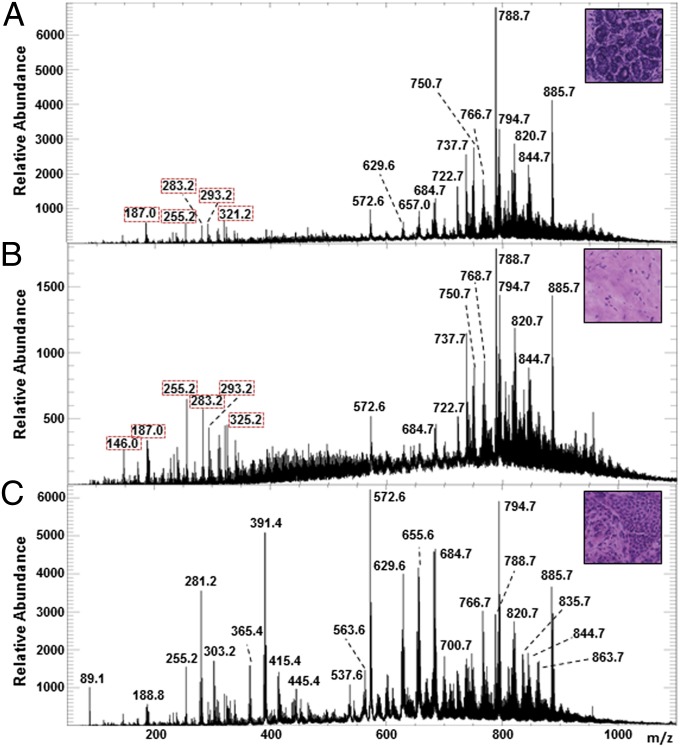
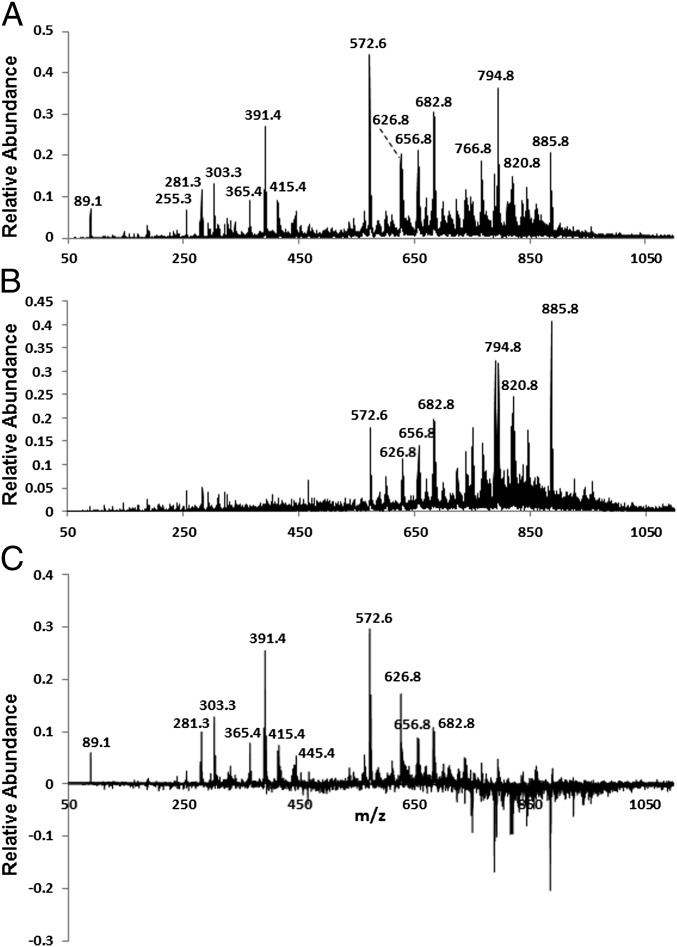
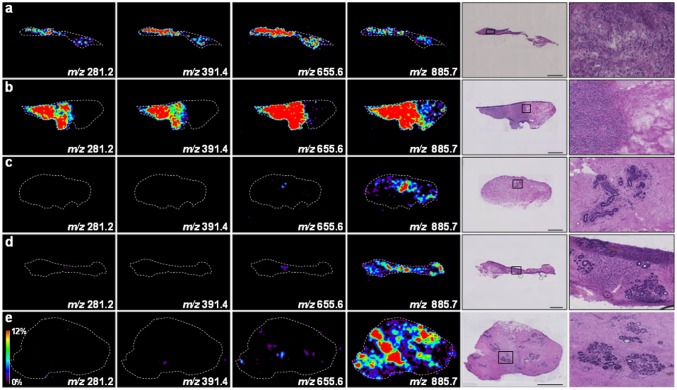
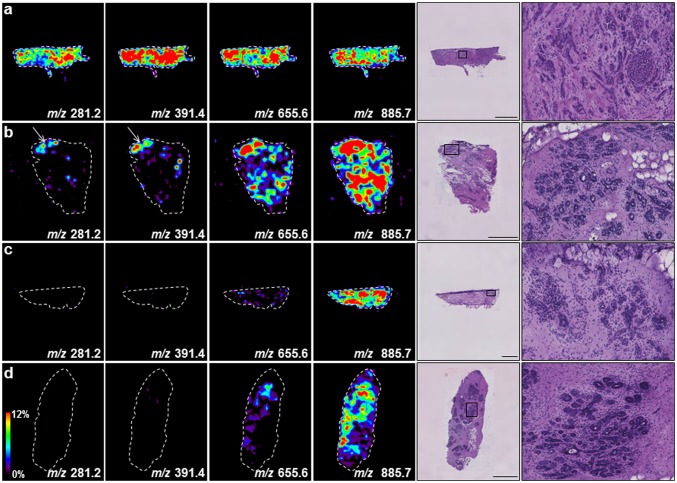
Distinguishing tumor from normal glandular breast tissue is an important step in breast-conserving surgery. Because this distinction can be challenging in the operative setting, up to 40% of patients require an additional operation when traditional approaches are used. Here, we present a proof-of-concept study to determine the feasibility of using desorption electrospray ionization mass spectrometry imaging (DESI-MSI) for identifying and differentiating tumor from normal breast tissue. We show that tumor margins can be identified using the spatial distributions and varying intensities of different lipids. Several fatty acids, including oleic acid, were more abundant in the cancerous tissue than in normal tissues. The cancer margins delineated by the molecular images from DESI-MSI were consistent with those margins obtained from histological staining. Our findings prove the feasibility of classifying cancerous and normal breast tissues using ambient ionization MSI. The results suggest that an MS-based method could be developed for the rapid intraoperative detection of residual cancer tissue during breast-conserving surgery.
Keywords: FT-ICR MS; intrasurgical diagnosis; metabolites; molecular pathology.
Conflict of interest statement
Conflict of interest statement: In compliance with Harvard Medical School and Partners Healthcare guidelines on potential conflict of interest, we disclose that S.S. and N.Y.R.A. are scientific advisors to BayesianDx.
Figures
References
-
- Morrow M, et al. Factors predicting the use of breast-conserving therapy in stage I and II breast carcinoma. J Clin Oncol. 2001;19(8):2254–2262. - PubMed
-
- Fisher B, et al. Twenty-year follow-up of a randomized trial comparing total mastectomy, lumpectomy, and lumpectomy plus irradiation for the treatment of invasive breast cancer. N Engl J Med. 2002;347(16):1233–1241. - PubMed
-
- Veronesi U, et al. Twenty-year follow-up of a randomized study comparing breast-conserving surgery with radical mastectomy for early breast cancer. N Engl J Med. 2002;347(16):1227–1232. - PubMed
-
- Berg WA, et al. Diagnostic accuracy of mammography, clinical examination, US, and MR imaging in preoperative assessment of breast cancer. Radiology. 2004;233(3):830–849. - PubMed
-
- Wasif N, et al. MRI versus ultrasonography and mammography for preoperative assessment of breast cancer. Am Surg. 2009;75(10):970–975. - PubMed
Publication types
MeSH terms
Substances
Grants and funding
LinkOut - more resources
Full Text Sources
Other Literature Sources
Medical
