. 2014 Dec 1;34(23):4232-43.
doi: 10.1128/MCB.00895-14. Epub 2014 Sep 22.

ERBB2 deficiency alters an E2F-1-dependent adaptive stress response and leads to cardiac dysfunction

Affiliations

ERBB2 deficiency alters an E2F-1-dependent adaptive stress response and leads to cardiac dysfunction

Marie-Claude Perry et al. Mol Cell Biol. .

Abstract

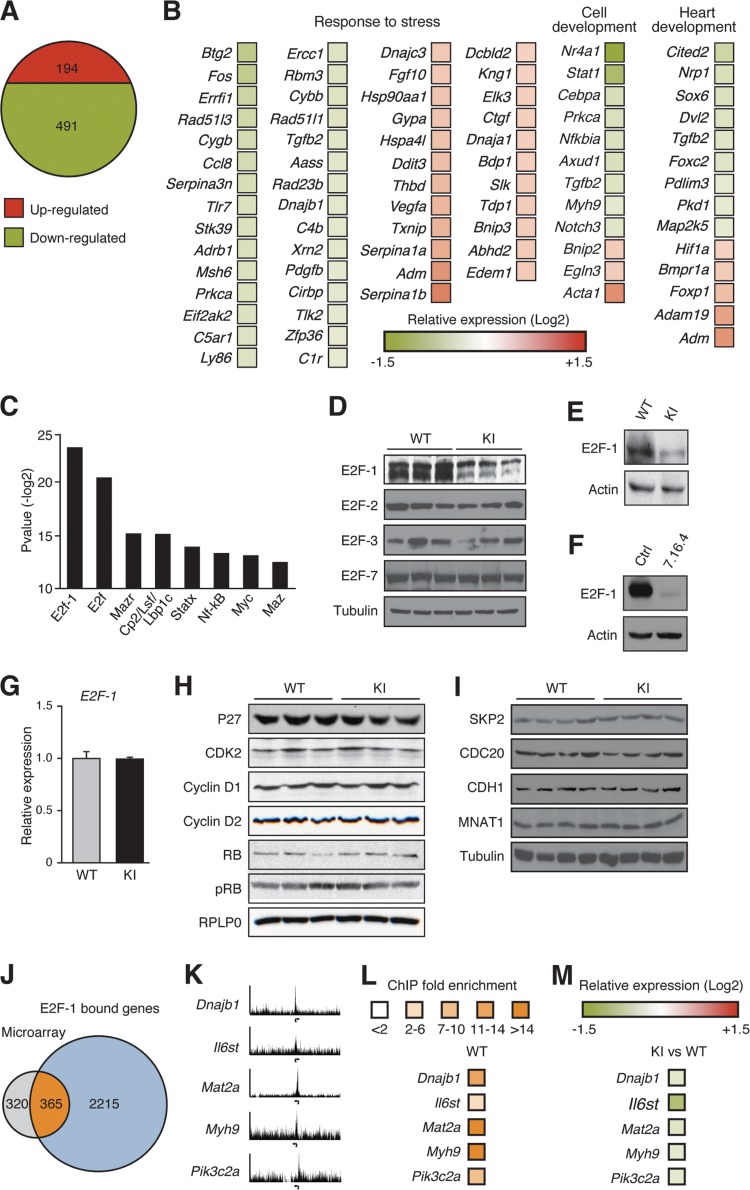
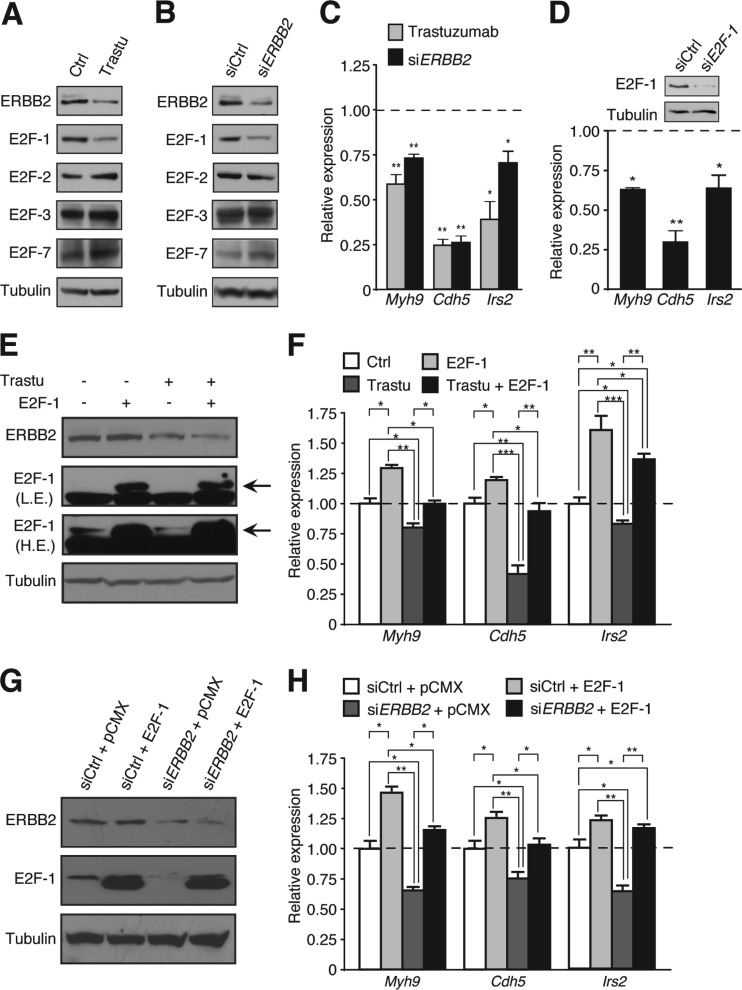
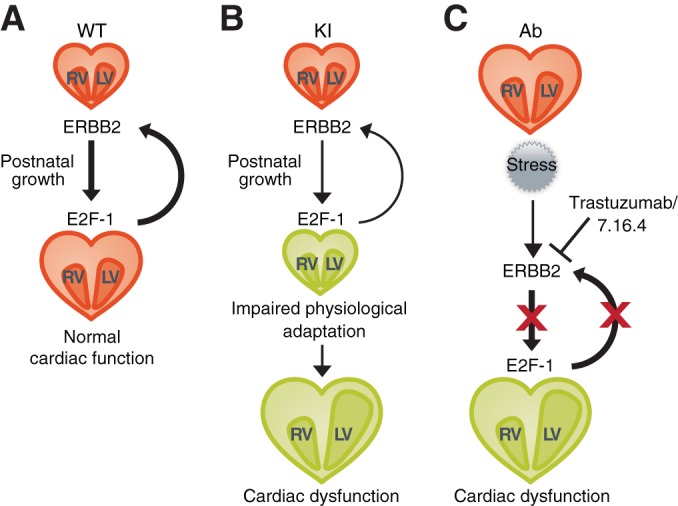
The tyrosine kinase receptor ERBB2 is required for normal development of the heart and is a potent oncogene in breast epithelium. Trastuzumab, a monoclonal antibody targeting ERBB2, improves the survival of breast cancer patients, but cardiac dysfunction is a major side effect of the drug. The molecular mechanisms underlying how ERBB2 regulates cardiac function and why trastuzumab is cardiotoxic remain poorly understood. We show here that ERBB2 hypomorphic mice develop cardiac dysfunction that mimics the side effects observed in patients treated with trastuzumab. We demonstrate that this phenotype is related to the critical role played by ERBB2 in cardiac homeostasis and physiological hypertrophy. Importantly, genetic and therapeutic reduction of ERBB2 activity in mice, as well as ablation of ERBB2 signaling by trastuzumab or siRNAs in human cardiomyocytes, led to the identification of an impaired E2F-1-dependent genetic program critical for the cardiac adaptive stress response. These findings demonstrate the existence of a previously unknown mechanistic link between ERBB2 and E2F-1 transcriptional activity in heart physiology and trastuzumab-induced cardiac dysfunction.


Figures

FIG 1
FIG 1
Loss of ERBB2 signaling results in impaired cardiac growth during postnatal development. (A) Representative midventricular heart cross sections of WT and ERBB2 KI mice at day 1, 2, 4, and 6 months of age. Scale bar, 1 mm. (B) Indexed heart mass to body weight ratios at birth (day 1) and at 2, 4, and 6 months of age in WT and KI mice. Bars represent means ± the SEM. *, P < 0.05; **, P < 0.01. (C) Representative hematoxylin and eosin staining of left ventricular myocardium sections from WT and KI mice. Scale bar, 50 μm. (D) Quantification of cardiomyocyte size in WT and KI mice at 1 day and 2, 4, and 6 months of age. Bars represent means ± the SEM. n = 5 mice per group. *, P < 0.05.
FIG 2
FIG 2
Cardiac dysfunction in ERBB2 hypomorphic hearts. (A) Representative M-mode echocardiographic images from WT and ERBB2 KI mice at 2, 4, or 6 months of age. (B) Percentages of LVEF in WT and KI hearts at the indicated time points. Values represent means ± the SEM. n = 8 mice per group. **, P < 0.01. (C) Percentages of LVFS in WT and KI hearts at the indicated time points. Values represent means ± the SEM. n = 8 mice per group. **, P < 0.01. (D) Increased LV mass index to body weight (LV/BW) in 6-month-old KI mice compared to WT mice. Bars represent means ± the SEM. n = 8 mice per group. *, P < 0.05. (E) Echo-derived LV internal systolic chamber diameter in 6-month-old KI mice compared to WT. Bars represent means ± the SEM. n = 8 mice per group. *, P < 0.05. (F) Illustration of the number of upregulated and downregulated genes from microarray expression analysis of 6-month-old KI hearts versus WT hearts. n = 3 mice per group. (G) Enrichment analysis of GO terms and KEGG pathways using FatiGO of the 2,141 differently regulated genes in the 6-month-old KI hearts compared to WT mice. (H) Representative Masson's trichrome staining shows increased fibrosis (in blue) in 6-month-old KI mice relative to WT mice. Scale bars: 50 and 30 μm. (I) Hearts of 6-month-old KI mice have increased (∼20%) fibrosis compared to WT littermates. Bars represent means ± the SEM. n = 5 mice per group. *, P < 0.05. (J) Representative agarose gel showing heart DNA laddering from 6-month-old WT and KI mice. MW, molecular weight marker. (K) Transmission electron microscopy performed on heart sections from WT and KI mice at 6 months are shown. Pleomorphic mitochondria (M) and a larger number of vacuoles (arrows) in KI (right) hearts are found compared to control mice (left). Scale bar: 2 μm.
FIG 3
FIG 3
Effect of doxorubicin treatment on cardiac function of WT and ERBB2 hypomorphic mice. (A) Representative M-mode echocardiographic images from 2-month-old WT and ERBB2 KI mice treated with doxorubicin (10 mg/kg) or saline solution as control (vehicle). (B) Percentages of LVEF in treated WT and KI animals. Bars represent means ± the SEM. n = 8 mice per group. *, P < 0.05; **, P < 0.01; ***, P < 0.001. (C) Percentages of LVFS in treated WT and KI animals. Bars represent means ± the SEM. n = 8 mice per group. *, P < 0.05; **, P < 0.01; ***, P < 0.001. (D) Echo-derived LV internal systolic chamber diameter in treated WT and KI animals. Bars represent means ± the SEM. n = 8 mice per group. **, P < 0.01; ***, P < 0.001.
FIG 4
FIG 4
Loss of ERBB2 signaling inhibits the cardiac adaptive stress response at a molecular level. (A) Illustration of the number of upregulated and downregulated genes from microarray expression analysis of 2-month-old ERBB2 KI hearts versus WT. n = 3 mice per group. (B) Heat map representation of a subset of key genes involved in cardiovascular development and response to stress in KI hearts relative to WT mice. Expression data are shown as the relative fold change. (C) Top eight enriched transcription factor binding motifs from TransFAT analysis of the 685 differently regulated genes in KI hearts compared to WT mice. (D) Western blot analysis of E2F family member expression in cardiac extracts from 2-month-old WT and KI mice. (E) Western blot analysis of E2F-1 in cardiac extracts from 6-month-old WT and KI mice. (F) Western blot analysis of ERBB2 and E2F-1 in 7.16.4-treated mouse HL-1 cardiomyocytes. (G) Cardiac qRT-PCR analysis of E2F-1 in 2-month-old KI and WT animals. (H) Western blot analysis of factors involved in the regulation of E2F-1 activity. No differences in total heart protein levels of p27, CDK2, cyclin D1, cyclin D2, RB, and phospho-RB (pRB) were found between 2-month-old WT and KI mice. (I) Western blot analysis of E3-ubiquitin ligase proteins for which E2F-1 has been shown to be a substrate in cardiac extracts from 2-month-old animals. (J) Venn diagram illustrating the overlap between E2F-1 ChIP-sequencing target genes and differentially regulated genes in KI hearts relative to WT. (K) ChIP-sequencing enrichment ratio profiles for E2F-1 at transcriptional start sites of genes encoding diverse proteins implicated in cardiac function. Arrows indicate the transcriptional start sites for each gene. (L) Standard ChIP validation in WT mice. (M) Relative fold expression levels between ERBB2 KI and WT hearts of the same subset of genes shown in panel L.
FIG 5
FIG 5
ERBB2 hypomorphic hearts have altered expression of E2F-1 ChIP-sequencing target genes involved in pathways associated with the regulation of cardiac homeostasis and the adaptive stress response. Subset of canonical pathways obtained by IPA software analysis of the 364 E2F-1 bound genes found differentially expressed in 2-month-old KI hearts compared to WT mice.
FIG 6
FIG 6
Effect of doxorubicin and 7.16.4 cotreatment on cardiac function in mice. (A) Representative M-mode echocardiographic images of 2-month-old WT-treated mice. (B) Percentages of left ventricular ejection fraction (LVEF) in 2-month-old treated WT animals. Bars represent means ± the SEM. n = 8 mice per group. *, P < 0.05; **, P < 0.01; ***, P < 0.001. (C) Percentages of left ventricular fractional shortening (LVFS) in 2-month-old treated WT animals. Bars represent means ± the SEM. n = 8 mice per group. *, P < 0.05; **, P < 0.01; ***, P < 0.001. (D) Echo-derived LV internal systolic chamber diameter in 2-month-old treated WT animals. Bars represent means ± the SEM. n = 8 mice per group. *, P < 0.05; **, P < 0.01; ***, P < 0.001.
FIG 7
FIG 7
ERBB2 inhibition by antibody 7.16.4 diminishes E2F-1 transcriptional activity in mice. (A) Representative M-mode echocardiographic images from 2-month-old control or 7.16.4-treated mice. (B) Decreased LVEF and LVFS in the 7.16.4-treated animals compared to control mice. Bars represent means ± the SEM. n = 7 mice per group. *, P < 0.05. (C) Cardiac ERBB2 and E2F-1 protein levels in 2-month-old 7.16.4-treated mice compared to the control group. (D) Heart qRT-PCR analysis of E2F-1 target genes in 2-month-old 7.16.4-treated animals compared to control mice. Transcript levels of the genes in ERBB2 KI hearts relative to WT are also shown. Expression levels were normalized to Rplp0 levels. Bars represent means ± the SEM. *, P < 0.05.
FIG 8
FIG 8
Cardiac dysfunction in ERBB2 hypomorphic (KI) hearts treated with the 7.16.4 antibody. (A) Representative M-mode echocardiographic images from 2-month-old KI control or 7.16.4-treated KI mice. (B) Decreased LVEF in the 7.16.4-treated KI animals compared to control hypomorphic mice. Bars represent means ± the SEM. n = 7 mice per group. *, P < 0.05. (C) Decreased left ventricular fractional shortening (LVFS) in the 7.16.4-treated KI animals compared to control hypomorphic mice. Bars represent means ± the SEM. n = 7 mice per group. *, P < 0.05.
FIG 9
FIG 9
Trastuzumab inhibition of ERBB2 signaling in human cardiomyocytes impairs E2F-1 activity. (A) ERBB2 and E2F-1 protein levels in human cardiomyocytes treated with trastuzumab (Trastu). (B) ERBB2 and E2F-1 protein levels in human cardiomyocytes treated with siERBB2. (C) qRT-PCR analysis of E2F-1 target genes in trastuzumab- or siERBB2-treated cells. Expression levels were normalized to 18S levels. Bars represent means ± the SEM. *, P < 0.05; **, P < 0.01. (D) qRT-PCR analysis of E2F-1 target genes in siE2F-1-treated human cardiomyocytes. Expression levels were normalized to RPLP0 levels. Bars represent means ± the SEM. *, P < 0.05; **, P < 0.01. Western blot analysis showing E2F-1 knockdown in cells. (E) Western blot analysis showing the rescue effects of E2F-1 overexpression in trastuzumab-treated human cardiomyocytes. Low exposure (L.E.) and high exposure (H.E.) detections are shown. (F) qRT-PCR analysis of E2F-1 target genes in cells cotreated with trastuzumab and an E2F-1 expression vector. Expression levels were normalized to RPLP0 levels. Bars represent means ± the SEM. *, P < 0.05; **, P < 0.01; ***, P < 0.001. (G) Western blot analysis showing the rescue effects of E2F-1 overexpression on E2F-1 in human cardiomyocytes cotransfected with siERBB2. (H) qRT-PCR analysis of E2F-1 target genes in human cardiomyocytes cotransfected with siERBB2 and E2F-1 expression vector. Expression levels were normalized to RPLP0 levels. Bars represent means ± the SEM. *, P < 0.05; **, P < 0.01.
FIG 10
FIG 10
Inhibition of the ERBB2/E2F-1 molecular axis results in the development of cardiac dysfunction via impairment of the cardiac adaptive stress response. (A) ERBB2 is a critical player in maintaining cardiac homeostasis via an E2F-1-dependent transcriptional program important in the adaptive stress response of the heart to enhanced hemodynamic loads during postnatal developmental growth. (B) Genetic (KI) reduction in ERBB2 signaling results in decreased expression of E2F-1 and its downstream target genes leading to cardiac dysfunction. (C) Therapeutic (Ab) reduction in ERBB2 signaling results in decreased expression of E2F-1 and its downstream target genes leading to cardiac dysfunction.

References

    1. Yarden Y, Pines G. 2012. The ERBB network: at last, cancer therapy meets systems biology. Nat. Rev. Cancer 12:553–563. 10.1038/nrc3309. - DOI - PubMed
    1. Slamon DJ, Leyland-Jones B, Shak S, Fuchs H, Paton V, Bajamonde A, Fleming T, Eiermann W, Wolter J, Pegram M, Baselga J, Norton L. 2001. Use of chemotherapy plus a monoclonal antibody against HER2 for metastatic breast cancer that overexpresses HER2. N. Engl. J. Med. 344:783–792. 10.1056/NEJM200103153441101. - DOI - PubMed
    1. Lee KF, Simon H, Chen H, Bates B, Hung MC, Hauser C. 1995. Requirement for neuregulin receptor erbB2 in neural and cardiac development. Nature 378:394–398. 10.1038/378394a0. - DOI - PubMed
    1. Seidman A, Hudis C, Pierri MK, Shak S, Paton V, Ashby M, Murphy M, Stewart SJ, Keefe D. 2002. Cardiac dysfunction in the trastuzumab clinical trials experience. J. Clin. Oncol. 20:1215–1221. 10.1200/JCO.20.5.1215. - DOI - PubMed
    1. Ewer MS, Vooletich MT, Durand JB, Woods ML, Davis JR, Valero V, Lenihan DJ. 2005. Reversibility of trastuzumab-related cardiotoxicity: new insights based on clinical course and response to medical treatment. J. Clin. Oncol. 23:7820–7826. 10.1200/JCO.2005.13.300. - DOI - PubMed

Publication types

MeSH terms