. 2014 Nov;20(11):1732-46.
doi: 10.1261/rna.044362.114. Epub 2014 Sep 22.

A kinetic and thermodynamic framework for the Azoarcus group I ribozyme reaction

Affiliations

A kinetic and thermodynamic framework for the Azoarcus group I ribozyme reaction

Kristin R Gleitsman et al. RNA. 2014 Nov.

Abstract

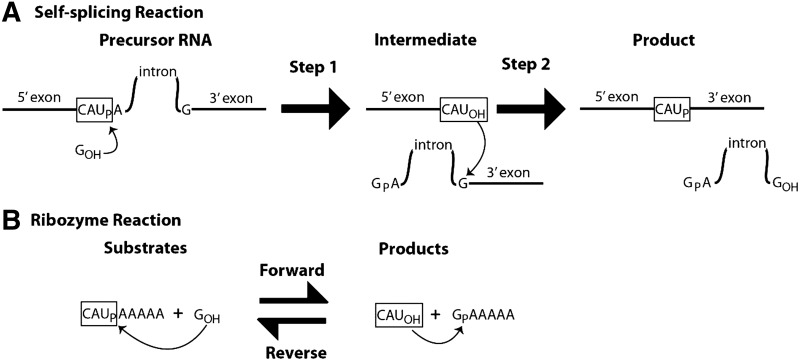
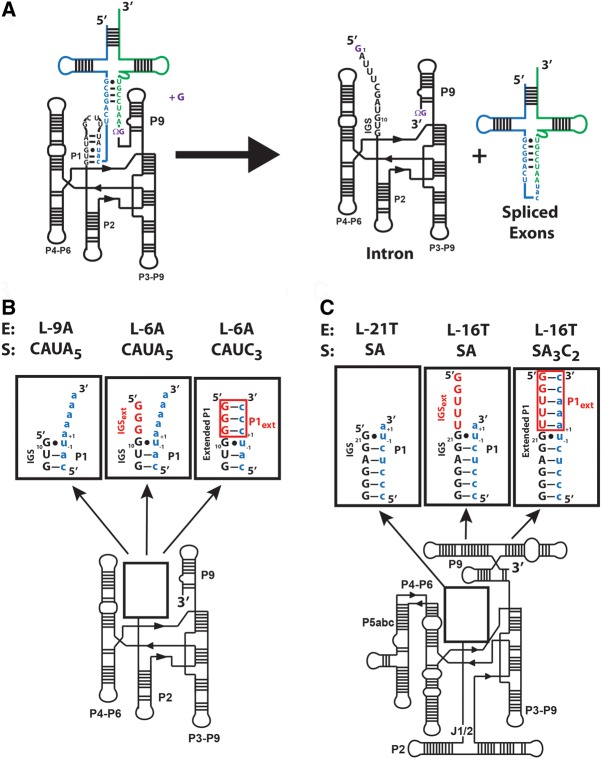
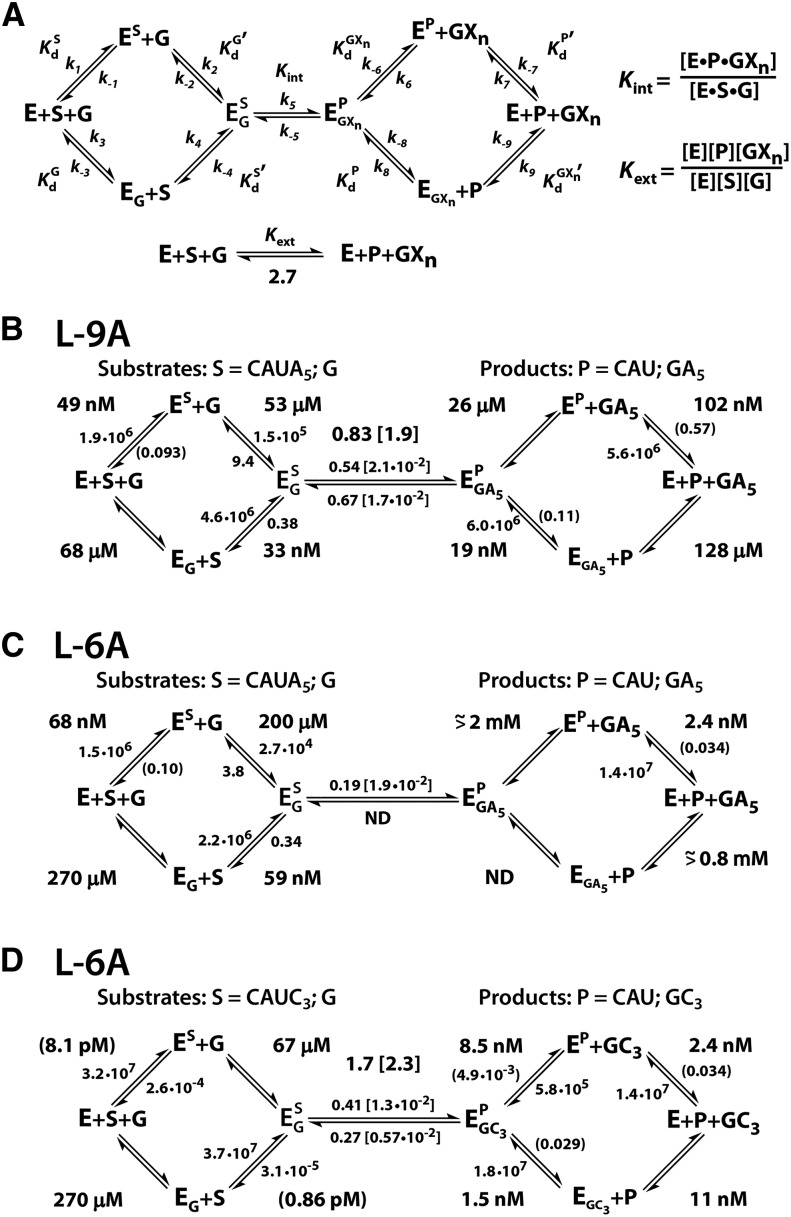
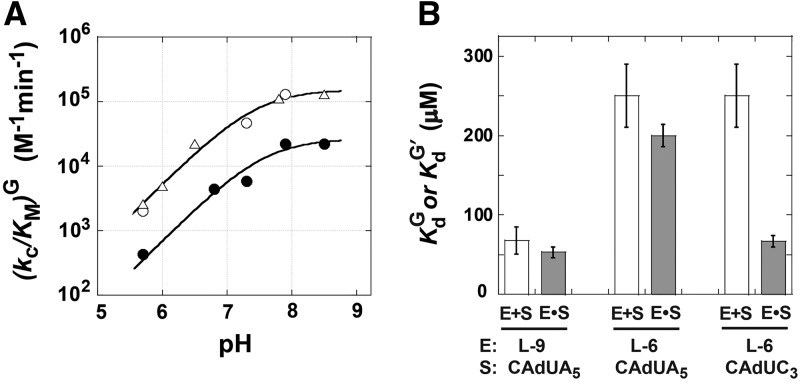
Determination of quantitative thermodynamic and kinetic frameworks for ribozymes derived from the Azoarcus group I intron and comparisons to their well-studied analogs from the Tetrahymena group I intron reveal similarities and differences between these RNAs. The guanosine (G) substrate binds to the Azoarcus and Tetrahymena ribozymes with similar equilibrium binding constants and similar very slow association rate constants. These and additional literature observations support a model in which the free ribozyme is not conformationally competent to bind G and in which the probability of assuming the binding-competent state is determined by tertiary interactions of peripheral elements. As proposed previously, the slow binding of guanosine may play a role in the specificity of group I intron self-splicing, and slow binding may be used analogously in other biological processes. The internal equilibrium between ribozyme-bound substrates and products is similar for these ribozymes, but the Azoarcus ribozyme does not display the coupling in the binding of substrates that is observed with the Tetrahymena ribozyme, suggesting that local preorganization of the active site and rearrangements within the active site upon substrate binding are different for these ribozymes. Our results also confirm the much greater tertiary binding energy of the 5'-splice site analog with the Azoarcus ribozyme, binding energy that presumably compensates for the fewer base-pairing interactions to allow the 5'-exon intermediate in self splicing to remain bound subsequent to 5'-exon cleavage and prior to exon ligation. Most generally, these frameworks provide a foundation for design and interpretation of experiments investigating fundamental properties of these and other structured RNAs.

Keywords: Group I intron; catalytic framework; noncoding RNA; ribozyme.


Figures

SCHEME 1.
SCHEME 1.
Reactions catalyzed by a (A) self-splicing group I intron and (B) group I ribozyme.
FIGURE 1.
FIGURE 1.
Comparison of the ribozymes used in this work. (A) The secondary structure of the Azoarcus group I intron and its self-splicing reaction. The exogenous guanosine nucleophile, ΩG (which specifies the 3′-splice junction), and the guanosine binding site are all shown in purple. The 5′ exon is shown in blue, the 3′ exon is shown in green, and the intron is shown in black. (B) The secondary structure for the ribozymes used in this study. The numbers −1 and +1 define the nucleotides immediately 5′ and 3′ of the cleavage site, respectively. (Left) The L-9A ribozyme. Formation of base pairs with the IGS results in the formation of the P1 duplex. (Center and right) The L-6A ribozyme, containing a three nucleotide 5′ extension (5′GGG3′). The additional sequence present in the L-6A ribozyme extends the IGS and is termed the IGS extension (IGSext) and is shown in red. The IGS and the IGS extension together are referred to as the extended IGS. (Right) Formation of base pairs with the IGS extension results in formation of the P1 extension (P1ext), highlighted in red. Together the P1 and P1 extension (red) are called the extended P1 duplex. (C) The secondary structure for the Tetrahymena L-21T ribozyme (left), L-16T ribozyme (center), and the L-16T ribozyme with an oligonucleotide substrate (S) that forms the base pairs in the P1 extension (right). Definitions as given in B for the Azoarcus ribozymes.
FIGURE 2.
FIGURE 2.
Kinetic and thermodynamic frameworks of the Azoarcus ribozyme at 30°C in 15 mM MgCl2 and pH 6.2. The ribozymes and substrates are defined in Figure 1B,C. Numbers in square brackets describe the rate of the chemical step for oligonucleotide substrates/products with a 2′-H substitution at the −1U position at pH 7.9. Numbers in parentheses are calculated from Kd = koff/kon, and two measured values. (A) Definition of the rate and equilibrium constants used in the text. Association rate constants (k1, k2, k4, k7, and k8) are reported in M−1 min−1; all other rate constants are reported in units of min−1. The internal (Kint) and external (Kext) equilibrium constants are unitless. (B) L-9A ribozyme with CAUA5. (C) L-6A Azoarcus ribozyme with CAUA5. (D) L-6A Azoarcus ribozyme with CAUC3.
FIGURE 3.
FIGURE 3.
Kinetic and thermodynamic frameworks for the Tetrahymena ribozyme at 30°C in 10 mM MgCl2  and pH 6.2 (Karbstein et al. 2002, 2007). Numbers in square brackets describe the rate of the chemical step for oligonucleotide substrates/products with a 2′-H substitution at the −1U position at pH 7.9. (A) Definition of the rate and equilibrium constants used in the text. Association rate constants (k1, k2, k4, k7, and k8) are reported in M−1 min−1; all other rate constants are reported in units of min−1. The internal (Kint) and external (Kext) equilibrium constants are unitless. (B) L-21T Tetrahymena ribozyme with CCCUCTA. (C) L-16T Tetrahymena ribozyme with CCCUCTA. (D) L-16T Tetrahymena ribozyme with CCCUCTA3C2. UCG, a G analog that can form the P9.0 duplex with the ribozyme, was used in place of G; aside from tighter binding of UCG relative to G, no quantitative differences on other steps of the framework are observed.
FIGURE 4.
FIGURE 4.
Guanosine binding to the L-9A and L-6A ribozymes. (A) pH dependence of (kc/KM)G for the L-10A ribozyme (open symbols) and the L-6A ribozyme (closed symbols). (kc/KM)G describes the reaction of E•CAUA5 + G → products. Data were fit to Equation 4 to obtain the maximal values for (kc/KM)G of 1.5 ± 0.1 × 10⁵ M−1 min−1 and 0.27 ± 0.04 × 10⁵ M−1 min−1 and apparent pKa values of 7.5 ± 0.1 and 7.6 ± 0.2 for the L-9A and L-6A ribozymes, respectively. The reaction requires the loss of a proton from the 3′-OH group, so the chemical step has a log-linear pH dependence until the pH exceeds the pKa of this group. The observation that the reaction with a substrate with a slower chemical step increases log-linearly throughout this pH range (Fig. 7, below) suggests that the pKa observed here reflects a change in rate-limiting step (Herschlag and Khosla 1994; Karbstein and Herschlag 2003). Conditions: [E] = 500 nM, [G] = 0–15 μM, trace *S (CAUA5). (B) Equilibrium dissociation constants for G binding to the three ribozyme variants used in this study with (gray bars) and without (white bars) bound S.
FIGURE 5.
FIGURE 5.
pH dependences to establish conditions with rate-limiting binding of S and P. (A) pH dependence of (kc/KM)S for the L-9A ribozyme (circles) and the L-6A ribozyme (S = CAUA5, diamonds; S = CAUC3, squares). Data were fit to Equation 4 to obtain the maximal values for (kc/KM)S of 0.46 ± 0.05 × 10⁷ M−1 min−1, 0.22 ± 0.02 × 10⁷ M−1 min−1, and 3.7 ± 0.3 × 10⁷ M−1 min−1 and apparent pKa values of 6.3 ± 0.4, 6.7 ± 0.2 and 6.3 ± 0.2 for the L-9A with CAUA5, L-6A with CAUA5 and L-6A with CAUC3, respectively. The reaction requires the loss of a proton from the 3′-OH group, so the chemical step has a log-linear pH dependence until the pH exceeds the pKa of this group. The observation that the reaction with a substrate with a slower chemical step increases log-linearly throughout this pH range (Fig. 7, below) suggests that the pKa observed here reflects a change in rate-limiting step (Herschlag and Khosla 1994; Karbstein and Herschlag 2003). Conditions: [E] = 0–50 nM, [G] = 2.1 mM, trace *S (CAUA5 or CAUC3). (B) pH dependence of (kc/KM)P for the L-9A ribozyme (circles) and the L-6A ribozyme (squares). Data were fit to Equation 4 to obtain the maximal values for (kc/KM)P of 0.6 ± 0.06 × 10⁷ M−1 min−1 and 1.8 ± 0.3 × 10⁷ M−1 min−1 and apparent pKa values of 6.3 ± 0.2 and 5.7 ± 0.5 for the L-9A and L-6A ribozymes, respectively. Conditions: [E] = 500 nM, [GA5] = 1 mM, or [GC3] = 1 μM, trace *P (CAU).
FIGURE 6.
FIGURE 6.
Coupling in substrate and product binding in the (A) Tetrahymena and (B) Azoarcus ribozymes. Coupling is defined as formula image
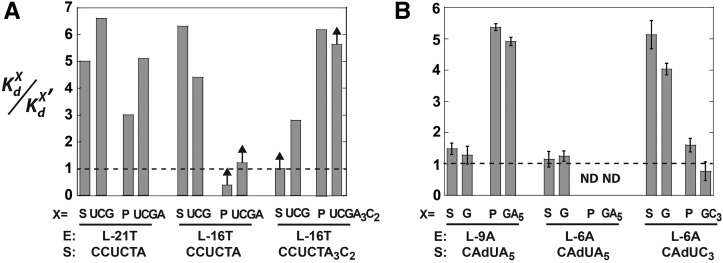
, where KdX describes binding to the free ribozyme, while formula image refers to the binding in the presence of saturating concentrations of the other substrate/product. The black dashed line represents no coupling. The arrows signify values that are lower limits.
FIGURE 7.
FIGURE 7.
(A) The pH dependence of the rate of the forward (open symbols) and reverse (closed symbols) reactions from the ternary complex, E•S•G and E•P•GA5, respectively, for the L-9A ribozyme (circles). Conditions: [E] = 1 μM, trace S = *CAdUA5 or trace P = *CAdU, [G] = 2.1 mM or [GA5] = 1 mM. (B) The pH dependence of the internal equilibrium constant (Kint) for the L-9A ribozyme (Kint = 1.9 ± 0.8). A dashed line is drawn at the value of the external equilibrium constant (Kext = 2.8 ± 1). (C) The pH dependence of the rate of the forward (open symbols) and reverse (closed symbols) reactions from the ternary complex, E•S•G and E•P•GC3, respectively, for the L-6A ribozyme with extended P1 (squares). Conditions: [E] = 100 nM, trace S = *CAdUC3 or trace P = *CAdU, [G] = 2.1 mM or [GC3] = 0.5 μM. (D) The pH dependence of the internal equilibrium constant (Kint) for the L-6A ribozyme (Kint = 2.3 ± 0.5). A dashed line is drawn at the value of the external equilibrium constant (Kext = 2.8 ± 1).
FIGURE 8.
FIGURE 8.
The ratio of the forward chemical step for the L-21T (Tetrahymena) and the L-9A (Azoarcus) ribozyme reactions with oligonucleotide substrates containing a 2′-H substitution at position −1U at pH 7.3 (circles), 7.9 (squares), and 8.5 (diamonds). The dashed line shows the average ratio for all of the data of 5.8 ± 1.7. Rate constants for the L-21T chemical step agree within twofold with previously published data from McConnell and Cech (1995) (10 mM MgCl2 and pH 7.0).

Similar articles

Cited by

References

    1. Adams PL, Stahley MR, Gill ML, Kosek AB, Wang J, Strobel SA. 2004a. Crystal structure of a group I intron splicing intermediate. RNA 10: 1867–1887 - PMC - PubMed
    1. Adams PL, Stahley MR, Kosek AB, Wang J, Strobel SA. 2004b. Crystal structure of a self-splicing group I intron with both exons. Nature 430: 45–50 - PubMed
    1. Bartley LE, Zhuang X, Das R, Chu S, Herschlag D. 2003. Exploration of the transition state for tertiary structure formation between an RNA helix and a large structured RNA. J Mol Biol 328: 1011–1026 - PubMed
    1. Behrouzi R, Roh JH, Kilburn D, Briber RM, Woodson SA. 2012. Cooperative tertiary interaction network guides RNA folding. Cell 149: 348–357 - PMC - PubMed
    1. Benz-Moy TL, Herschlag D. 2011. Structure-function analysis from the outside in: Long-range tertiary contacts in RNA exhibit distinct catalytic roles. Biochemistry 50: 8733–8755 - PMC - PubMed

Publication types

LinkOut - more resources