Self-organization of mesoscopic silver wires by electrochemical deposition
- PMID: 25247112
- PMCID: PMC4168863
- DOI: 10.3762/bjnano.5.142
Self-organization of mesoscopic silver wires by electrochemical deposition
Abstract
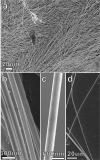
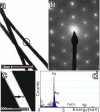
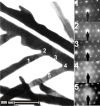
Long, straight mesoscale silver wires have been fabricated from AgNO3 electrolyte via electrodeposition without the help of templates, additives, and surfactants. Although the wire growth speed is very fast due to growth under non-equilibrium conditions, the wire morphology is regular and uniform in diameter. Structural studies reveal that the wires are single-crystalline, with the [112] direction as the growth direction. A possible growth mechanism is suggested. Auger depth profile measurements show that the wires are stable against oxidation under ambient conditions. This unique system provides a convenient way for the study of self-organization in electrochemical environments as well as for the fabrication of highly-ordered, single-crystalline metal nanowires.
Keywords: crystal growth; electrochemistry; electrodeposition; mesowires; nanoelectrochemistry; nanowires; self-organization; silver nanowires; silver nitrate; stability.
Figures


Similar articles
-
Controlled crystallinity and crystallographic orientation of Cu nanowires fabricated in ion-track templates.Nanotechnology. 2010 Sep 10;21(36):365605. doi: 10.1088/0957-4484/21/36/365605. Epub 2010 Aug 13. Nanotechnology. 2010. PMID: 20705973
-
Growth of single-crystalline Ni and Co nanowires via electrochemical deposition and their magnetic properties.J Phys Chem B. 2005 Mar 3;109(8):3094-8. doi: 10.1021/jp0451997. J Phys Chem B. 2005. PMID: 16851327
-
Edge plane sites on highly ordered pyrolytic graphite as templates for making palladium nanowires via electrochemical decoration.J Phys Chem B. 2006 Nov 16;110(45):22306-9. doi: 10.1021/jp065776m. J Phys Chem B. 2006. PMID: 17091967
-
Nanoelectrochemistry in electrochemical phase transition reactions.Chem Sci. 2023 Jun 22;14(28):7611-7619. doi: 10.1039/d3sc01857a. eCollection 2023 Jul 19. Chem Sci. 2023. PMID: 37476712 Free PMC article. Review.
-
The New Era of High-Throughput Nanoelectrochemistry.Anal Chem. 2023 Jan 10;95(1):319-356. doi: 10.1021/acs.analchem.2c05105. Anal Chem. 2023. PMID: 36625121 Free PMC article. Review. No abstract available.
Cited by
-
Silver-Nanowire-Based Elastic Conductors: Preparation Processes and Substrate Adhesion.Polymers (Basel). 2023 Mar 21;15(6):1545. doi: 10.3390/polym15061545. Polymers (Basel). 2023. PMID: 36987325 Free PMC article. Review.
References
-
- Kuchibhatla S V N T, Karakoti A S, Bera D, Seal S. Prog Mater Sci. 2007;52:699–913. doi: 10.1016/j.pmatsci.2006.08.001. - DOI
LinkOut - more resources
Full Text Sources
Other Literature Sources
