

Accuracy of FDG-PET to diagnose lung cancer in areas with infectious lung disease: a meta-analysis
- PMID: 25247519
- PMCID: PMC4315183
- DOI: 10.1001/jama.2014.11488
Accuracy of FDG-PET to diagnose lung cancer in areas with infectious lung disease: a meta-analysis
Abstract
Importance: Positron emission tomography (PET) combined with fludeoxyglucose F 18 (FDG) is recommended for the noninvasive diagnosis of pulmonary nodules suspicious for lung cancer. In populations with endemic infectious lung disease, FDG-PET may not accurately identify malignant lesions.
Objectives: To estimate the diagnostic accuracy of FDG-PET for pulmonary nodules suspicious for lung cancer in regions where infectious lung disease is endemic and compare the test accuracy in regions where infectious lung disease is rare.
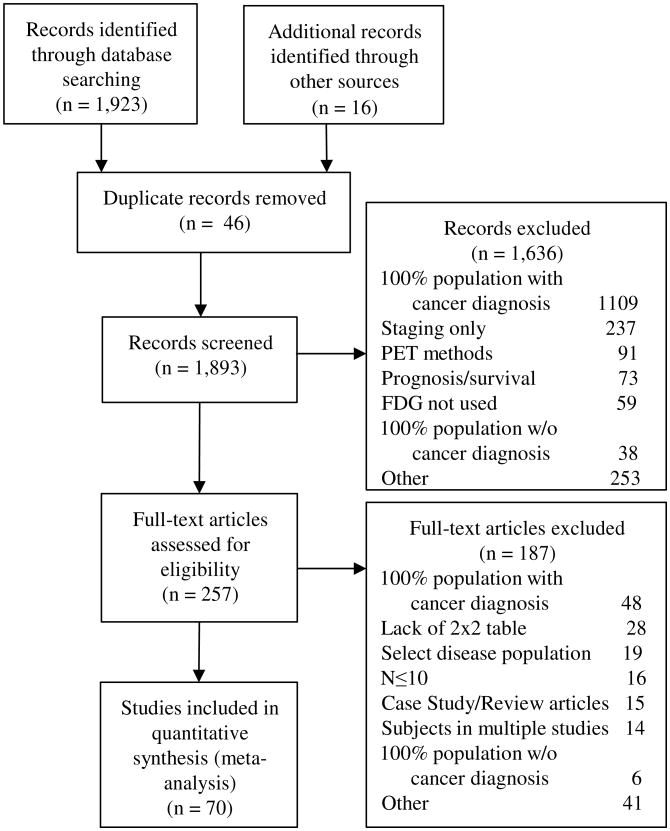
Data sources and study selection: Databases of MEDLINE, EMBASE, and the Web of Science were searched from October 1, 2000, through April 28, 2014. Articles reporting information sufficient to calculate sensitivity and specificity of FDG-PET to diagnose lung cancer were included. Only studies that enrolled more than 10 participants with benign and malignant lesions were included. Database searches yielded 1923 articles, of which 257 were assessed for eligibility. Seventy studies were included in the analysis. Studies reported on a total of 8511 nodules; 5105 (60%) were malignant.
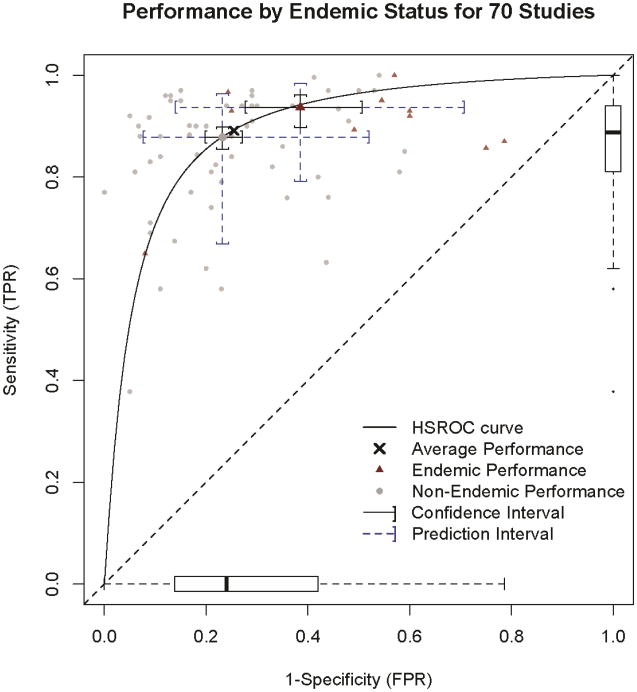
Data extraction and synthesis: Abstracts meeting eligibility criteria were collected by a research librarian and reviewed by 2 independent reviewers. Hierarchical summary receiver operating characteristic curves were constructed. A random-effects logistic regression model was used to summarize and assess the effect of endemic infectious lung disease on test performance.
Main outcome and measures: The sensitivity and specificity for FDG-PET test performance.
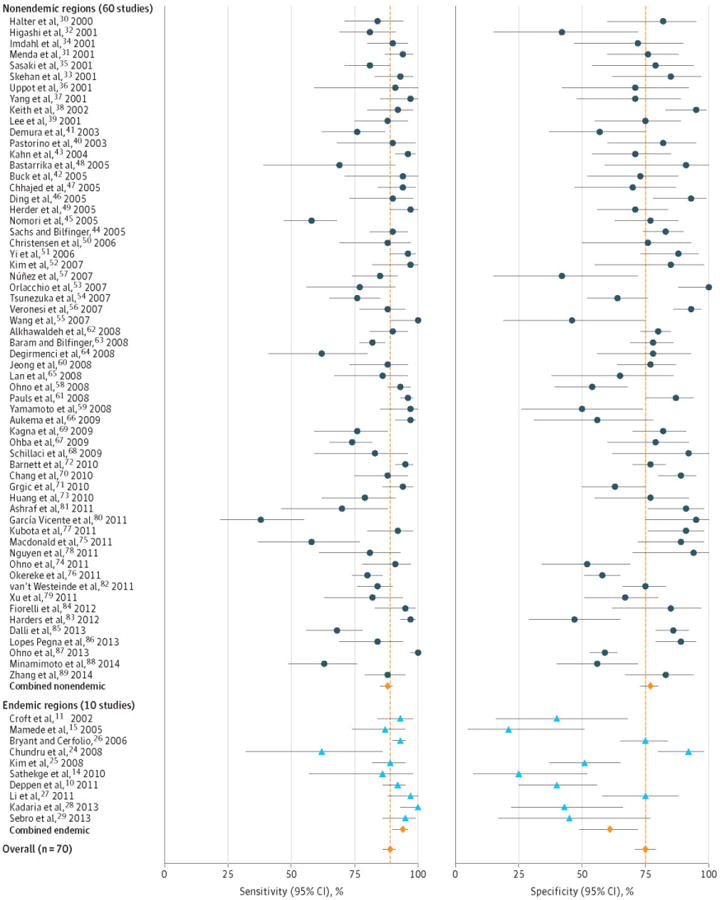
Results: Heterogeneity for sensitivity (I2 = 87%) and specificity (I2 = 82%) was observed across studies. The pooled (unadjusted) sensitivity was 89% (95% CI, 86%-91%) and specificity was 75% (95% CI, 71%-79%). There was a 16% lower average adjusted specificity in regions with endemic infectious lung disease (61% [95% CI, 49%-72%]) compared with nonendemic regions (77% [95% CI, 73%-80%]). Lower specificity was observed when the analysis was limited to rigorously conducted and well-controlled studies. In general, sensitivity did not change appreciably by endemic infection status, even after adjusting for relevant factors.
Conclusions and relevance: The accuracy of FDG-PET for diagnosing lung nodules was extremely heterogeneous. Use of FDG-PET combined with computed tomography was less specific in diagnosing malignancy in populations with endemic infectious lung disease compared with nonendemic regions. These data do not support the use of FDG-PET to diagnose lung cancer in endemic regions unless an institution achieves test performance accuracy similar to that found in nonendemic regions.
Figures
Comment in
-
Heterogeneity in meta-analysis of FDG-PET studies to diagnose lung cancer.JAMA. 2015 Jan 27;313(4):419. doi: 10.1001/jama.2014.16482. JAMA. 2015. PMID: 25626041 No abstract available.
-
Heterogeneity in meta-analysis of FDG-PET studies to diagnose lung cancer--reply.JAMA. 2015 Jan 27;313(4):419-20. doi: 10.1001/jama.2014.16485. JAMA. 2015. PMID: 25626042 No abstract available.
References
-
- Humphrey LL, Deffebach M, Pappas M, et al. Screening for Lung Cancer With Low-Dose Computed Tomography: A Systematic Review to Update the U.S. Preventive Services Task Force Recommendation. Annals of Internal Medicine. 2013;159(6):411–420. - PubMed
-
- Gould MK, Donington J, Lynch WR, et al. Evaluation of individuals with pulmonary nodules: When is it lung cancer?: diagnosis and management of lung cancer, 3rd ed: american college of chest physicians evidence-based clinical practice guidelines. CHEST Journal. 2013;143(5_suppl):e93S–e120S. - PMC - PubMed
-
- National Comprehensive Cancer Network. Lung Cancer Screening v2.2014. [Accessed 05-20-2014];NCCN Clinical Practice Guidelines in Oncology (NCCN Guidelines) 2014 http://www.nccn.org/professionals/physician_gls/recently_updated.asp.
-
- MacMahon H, Austin J, Gamsu G, et al. Guidelines for management of small pulmonary nodules detected on CT scans: a statement from the Fleischner Society. Radiology. 2005;237:395–400. - PubMed
-
- Cronin P, Dwamena B, Kelly A, Carlos R. Solitary pulmonary nodules: meta-analytic comparison of cross-sectional imaging modalities for diagnosis of malignancy. Radiology. 2008;246:772–782. - PubMed
Publication types
MeSH terms
Substances
Grants and funding
LinkOut - more resources
Full Text Sources
Other Literature Sources
Medical
Miscellaneous
