

Review
doi: 10.1148/radiol.14132362.
CT and MR imaging diagnosis and staging of hepatocellular carcinoma: part II. Extracellular agents, hepatobiliary agents, and ancillary imaging features
Affiliations
- PMID: 25247563
- PMCID: PMC4263770
- DOI: 10.1148/radiol.14132362
Item in Clipboard
Review
CT and MR imaging diagnosis and staging of hepatocellular carcinoma: part II. Extracellular agents, hepatobiliary agents, and ancillary imaging features
Radiology.
2014 Oct.
Abstract
Computed tomography (CT) and magnetic resonance (MR) imaging play critical roles in the diagnosis and staging of hepatocellular carcinoma (HCC). The second article of this two-part review discusses basic concepts of diagnosis and staging, reviews the diagnostic performance of CT and MR imaging with extracellular contrast agents and of MR imaging with hepatobiliary contrast agents, and examines in depth the major and ancillary imaging features used in the diagnosis and characterization of HCC.
© RSNA, 2014.
Figures
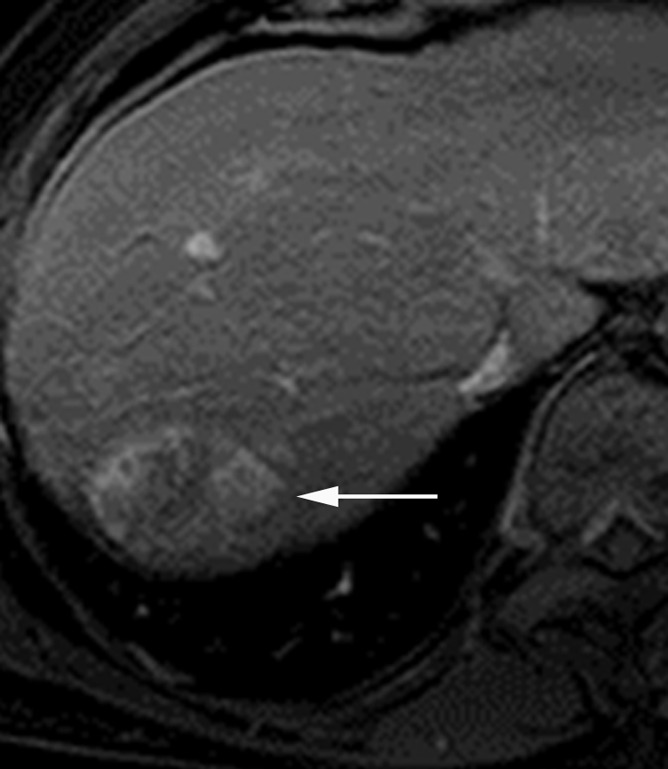
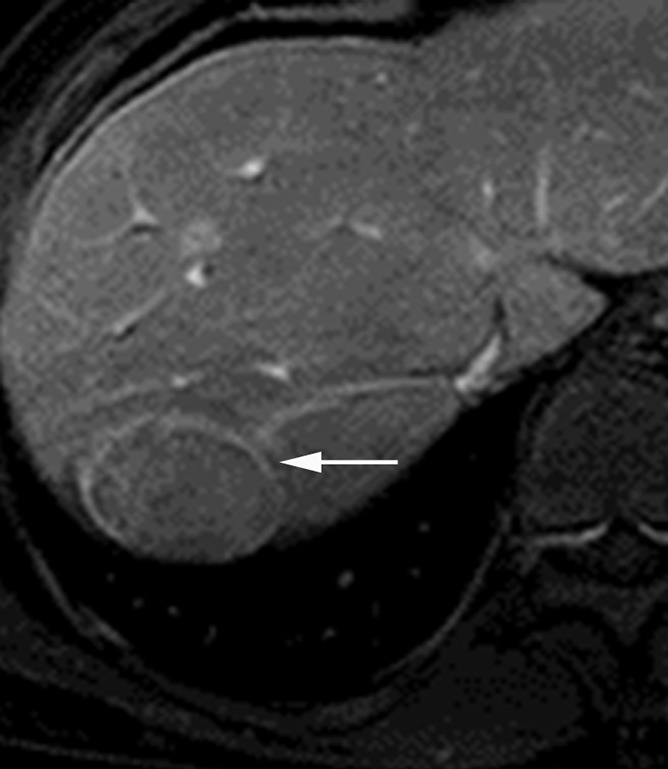
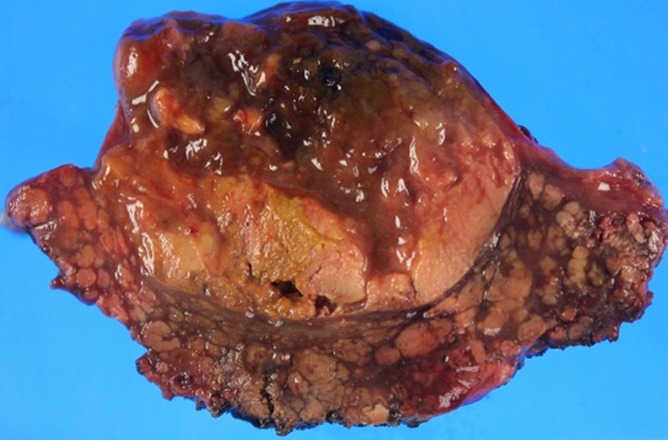
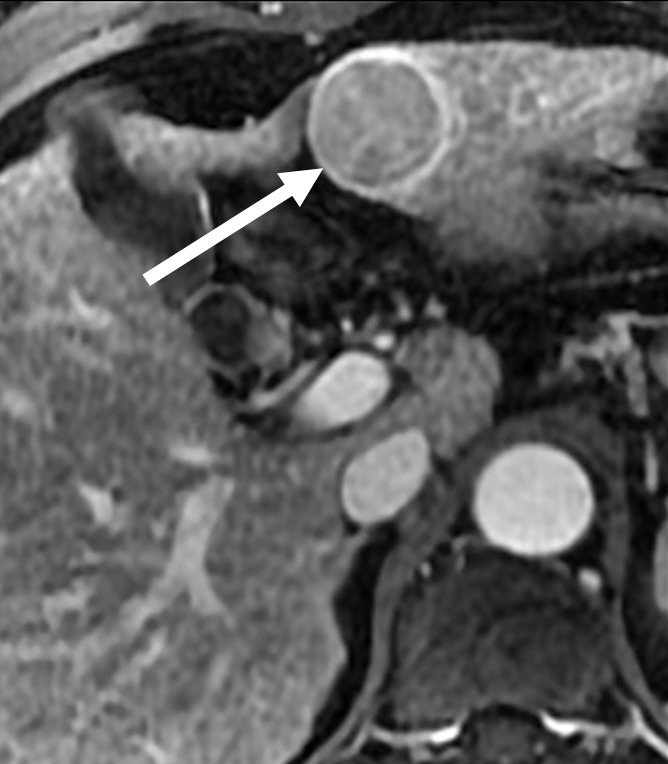
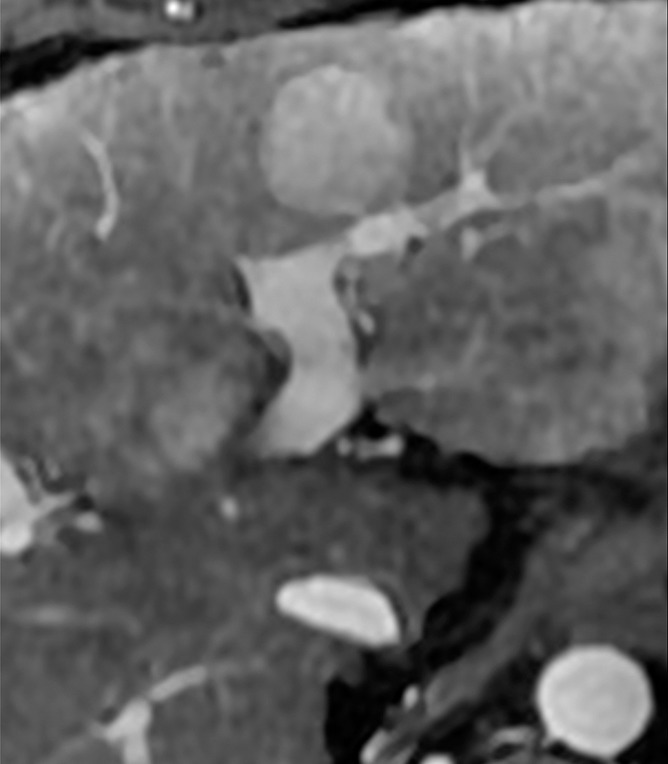
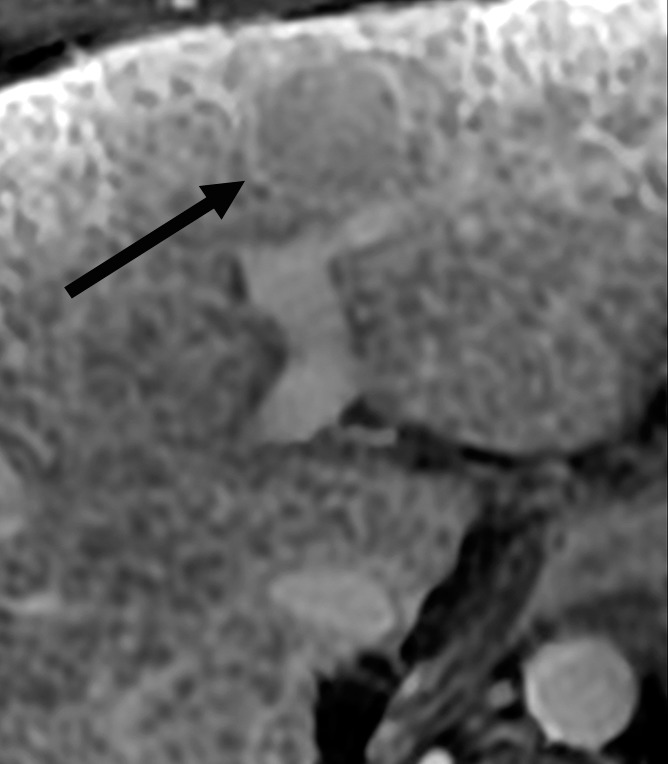
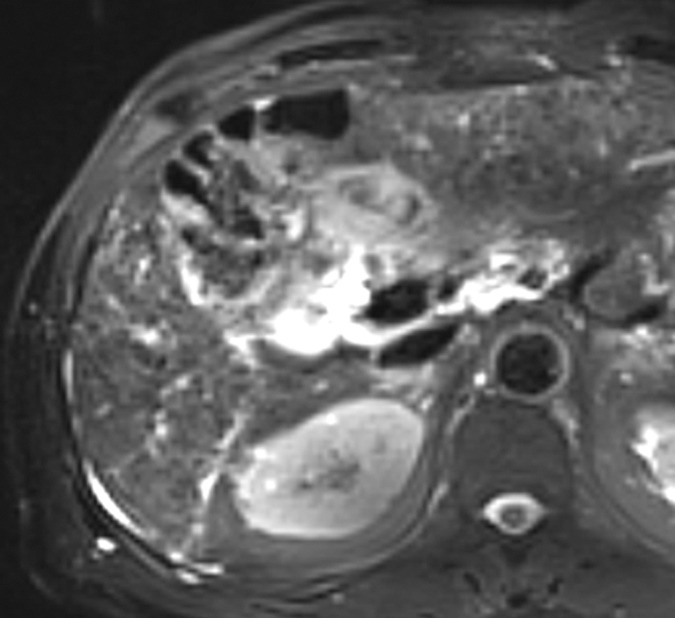
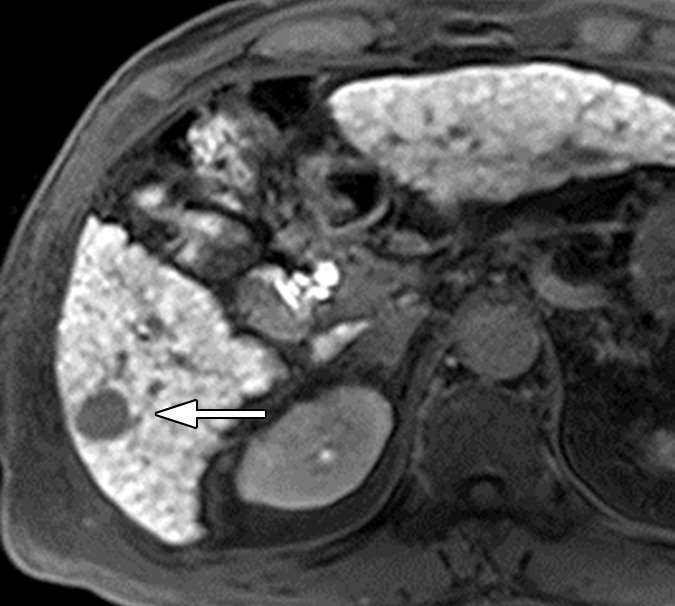
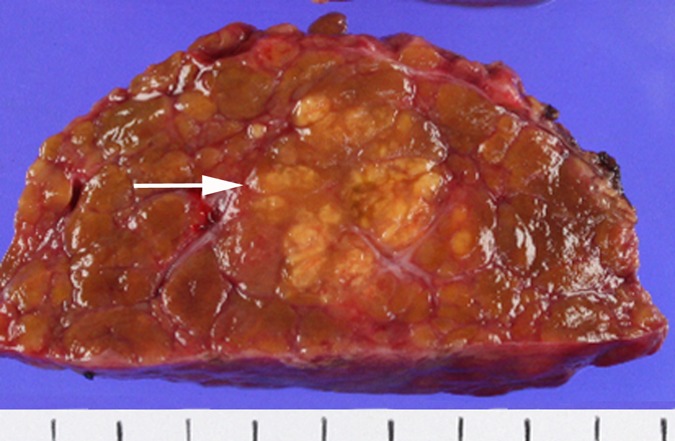
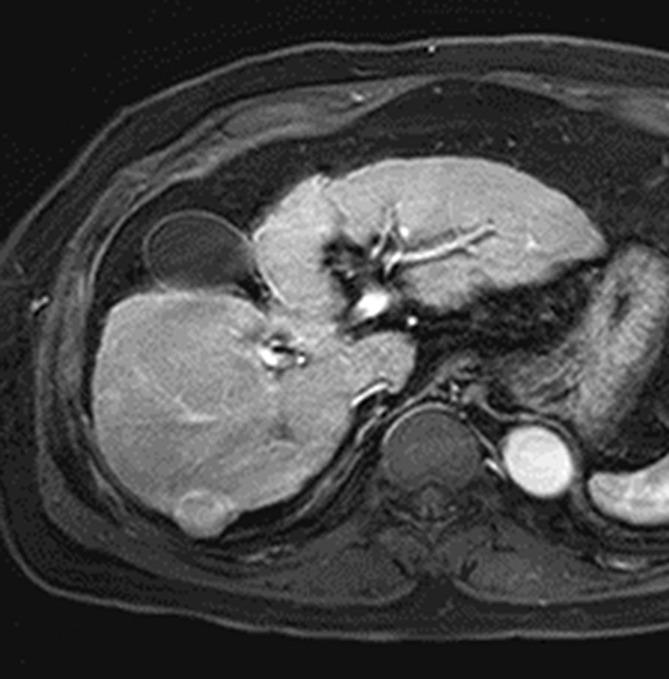
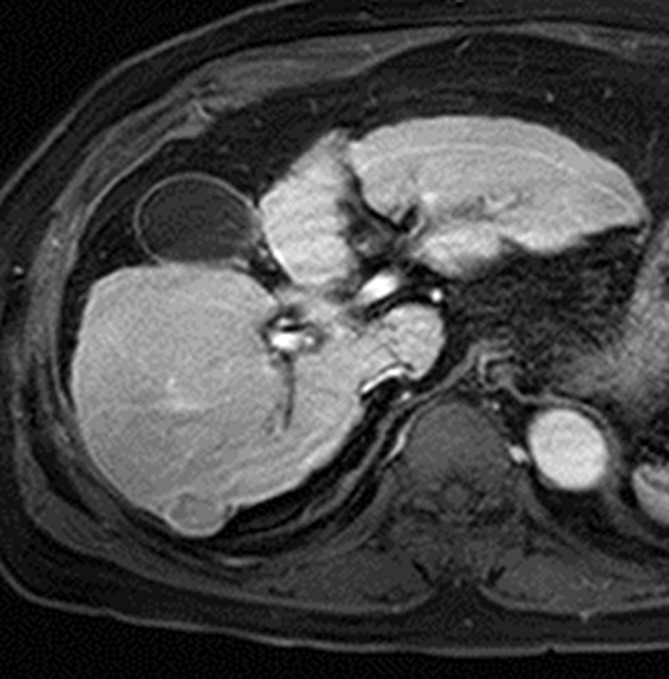
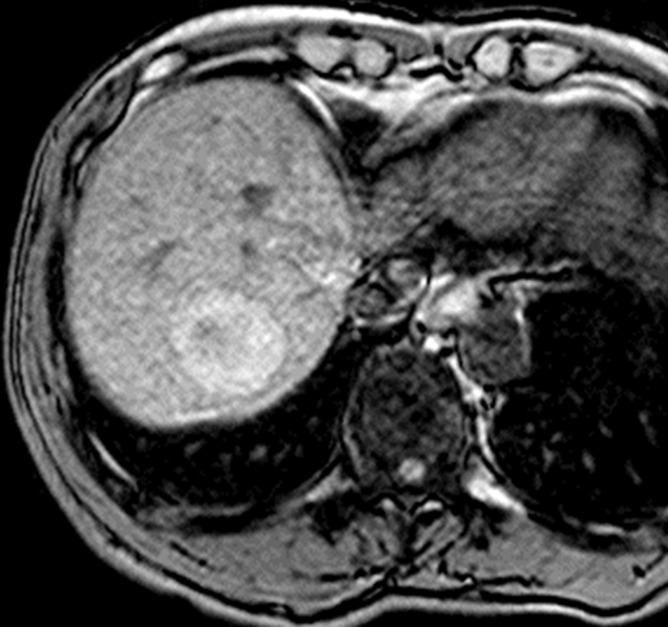
Images in a 69-year-old man with encapsulated progressed HCC. (a) T1-weighted three-dimensional (3D) gradient-echo (GRE) MR image with fat suppression (repetition time msec/echo time msec, 3.0/1.4; 10° flip angle) obtained in late hepatic arterial phase after administration of gadolinium-based contrast agent shows hyperenhancing mass (arrow) with mosaic architecture in segment VII. (b) Mass is isointense on portal venous phase image with a capsule appearance (arrow). Mosaic architecture and capsule appearance permit confident diagnosis of HCC, even though mass does not appear to wash out to hypointensity relative to liver in portal venous phase. (c) Photograph of gross pathologic specimen confirms progressed HCC with fibrous capsule.
Images in a 69-year-old man with encapsulated progressed HCC. (a) T1-weighted three-dimensional (3D) gradient-echo (GRE) MR image with fat suppression (repetition time msec/echo time msec, 3.0/1.4; 10° flip angle) obtained in late hepatic arterial phase after administration of gadolinium-based contrast agent shows hyperenhancing mass (arrow) with mosaic architecture in segment VII. (b) Mass is isointense on portal venous phase image with a capsule appearance (arrow). Mosaic architecture and capsule appearance permit confident diagnosis of HCC, even though mass does not appear to wash out to hypointensity relative to liver in portal venous phase. (c) Photograph of gross pathologic specimen confirms progressed HCC with fibrous capsule.
Images in a 69-year-old man with encapsulated progressed HCC. (a) T1-weighted three-dimensional (3D) gradient-echo (GRE) MR image with fat suppression (repetition time msec/echo time msec, 3.0/1.4; 10° flip angle) obtained in late hepatic arterial phase after administration of gadolinium-based contrast agent shows hyperenhancing mass (arrow) with mosaic architecture in segment VII. (b) Mass is isointense on portal venous phase image with a capsule appearance (arrow). Mosaic architecture and capsule appearance permit confident diagnosis of HCC, even though mass does not appear to wash out to hypointensity relative to liver in portal venous phase. (c) Photograph of gross pathologic specimen confirms progressed HCC with fibrous capsule.
HCCs with and without definite capsule appearance. (a, b) HCC with definite capsule appearance in a 54-year-old man with hepatitis C–related cirrhosis. T1-weighted 3D GRE MR images with fat suppression (3.0/1.4; 15° flip angle) obtained in (a) late hepatic arterial phase and (b) 3-minute delayed phase after administration of gadolinium-based contrast agent show 3.2-cm HCC in left lobe. Peripheral enhancing rim (arrow) in delayed phase is unequivocally thicker and more conspicuous than enhancing fibrosis surrounding background nodules, consistent with capsule appearance. (c, d) HCC without definite capsule appearance in 35-year-old man with hepatitis C–related cirrhosis. T1-weighted 3D GRE MR images with fat suppression (3.0/1.4; 15° flip angle) obtained in (c) late hepatic arterial phase and (d) 3-minute delayed phase after administration of gadolinium-based contrast agent show 2.5-cm HCC in left lobe. Peripheral enhancing rim (arrow) in delayed phase is of similar thickness and conspicuity as enhancing fibrosis surrounding background nodules.
HCCs with and without definite capsule appearance. (a, b) HCC with definite capsule appearance in a 54-year-old man with hepatitis C–related cirrhosis. T1-weighted 3D GRE MR images with fat suppression (3.0/1.4; 15° flip angle) obtained in (a) late hepatic arterial phase and (b) 3-minute delayed phase after administration of gadolinium-based contrast agent show 3.2-cm HCC in left lobe. Peripheral enhancing rim (arrow) in delayed phase is unequivocally thicker and more conspicuous than enhancing fibrosis surrounding background nodules, consistent with capsule appearance. (c, d) HCC without definite capsule appearance in 35-year-old man with hepatitis C–related cirrhosis. T1-weighted 3D GRE MR images with fat suppression (3.0/1.4; 15° flip angle) obtained in (c) late hepatic arterial phase and (d) 3-minute delayed phase after administration of gadolinium-based contrast agent show 2.5-cm HCC in left lobe. Peripheral enhancing rim (arrow) in delayed phase is of similar thickness and conspicuity as enhancing fibrosis surrounding background nodules.
HCCs with and without definite capsule appearance. (a, b) HCC with definite capsule appearance in a 54-year-old man with hepatitis C–related cirrhosis. T1-weighted 3D GRE MR images with fat suppression (3.0/1.4; 15° flip angle) obtained in (a) late hepatic arterial phase and (b) 3-minute delayed phase after administration of gadolinium-based contrast agent show 3.2-cm HCC in left lobe. Peripheral enhancing rim (arrow) in delayed phase is unequivocally thicker and more conspicuous than enhancing fibrosis surrounding background nodules, consistent with capsule appearance. (c, d) HCC without definite capsule appearance in 35-year-old man with hepatitis C–related cirrhosis. T1-weighted 3D GRE MR images with fat suppression (3.0/1.4; 15° flip angle) obtained in (c) late hepatic arterial phase and (d) 3-minute delayed phase after administration of gadolinium-based contrast agent show 2.5-cm HCC in left lobe. Peripheral enhancing rim (arrow) in delayed phase is of similar thickness and conspicuity as enhancing fibrosis surrounding background nodules.
HCCs with and without definite capsule appearance. (a, b) HCC with definite capsule appearance in a 54-year-old man with hepatitis C–related cirrhosis. T1-weighted 3D GRE MR images with fat suppression (3.0/1.4; 15° flip angle) obtained in (a) late hepatic arterial phase and (b) 3-minute delayed phase after administration of gadolinium-based contrast agent show 3.2-cm HCC in left lobe. Peripheral enhancing rim (arrow) in delayed phase is unequivocally thicker and more conspicuous than enhancing fibrosis surrounding background nodules, consistent with capsule appearance. (c, d) HCC without definite capsule appearance in 35-year-old man with hepatitis C–related cirrhosis. T1-weighted 3D GRE MR images with fat suppression (3.0/1.4; 15° flip angle) obtained in (c) late hepatic arterial phase and (d) 3-minute delayed phase after administration of gadolinium-based contrast agent show 2.5-cm HCC in left lobe. Peripheral enhancing rim (arrow) in delayed phase is of similar thickness and conspicuity as enhancing fibrosis surrounding background nodules.
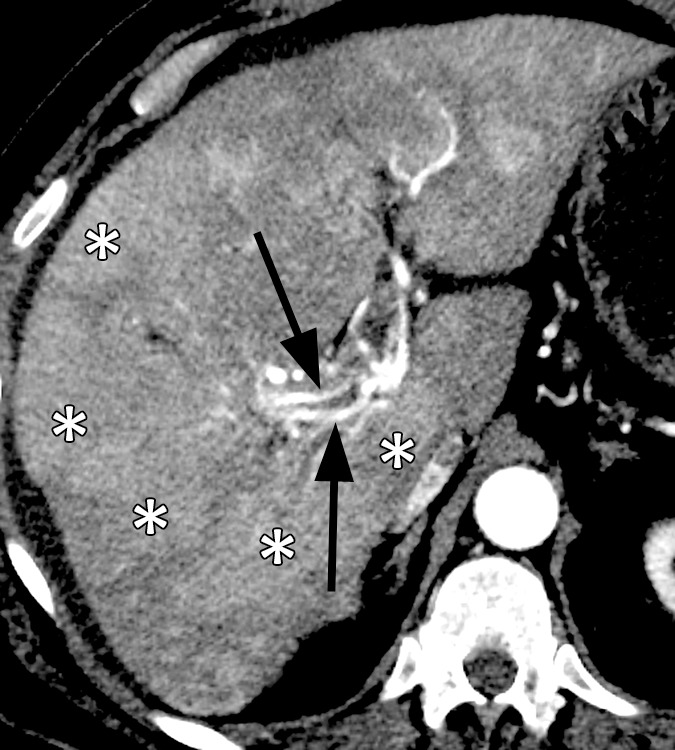
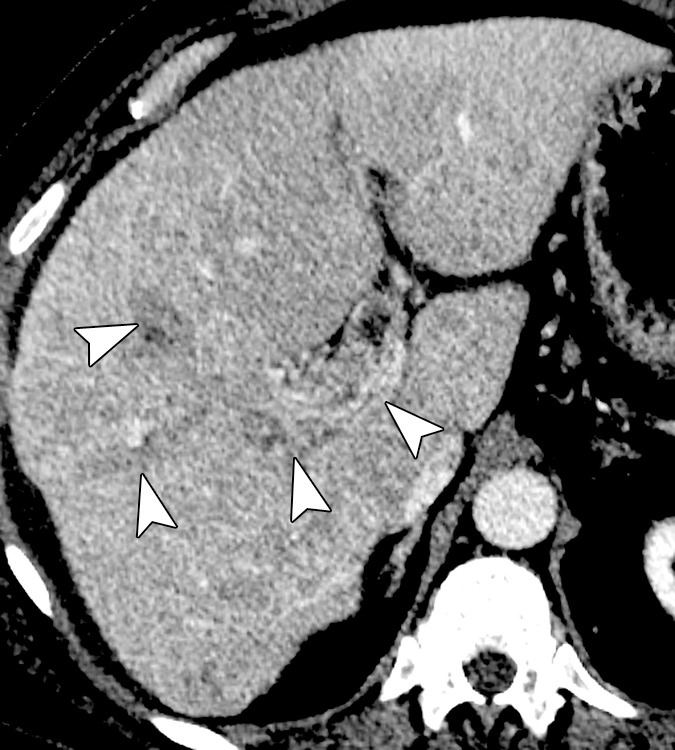
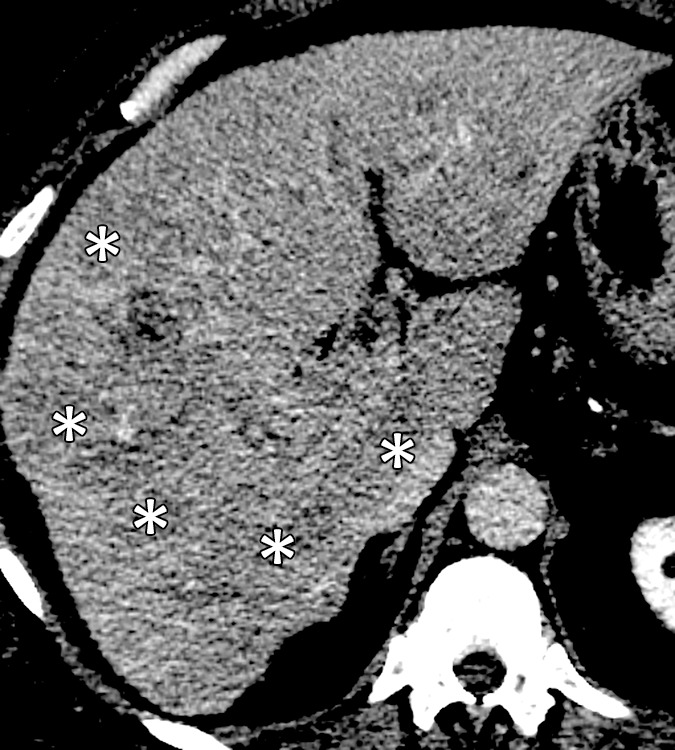
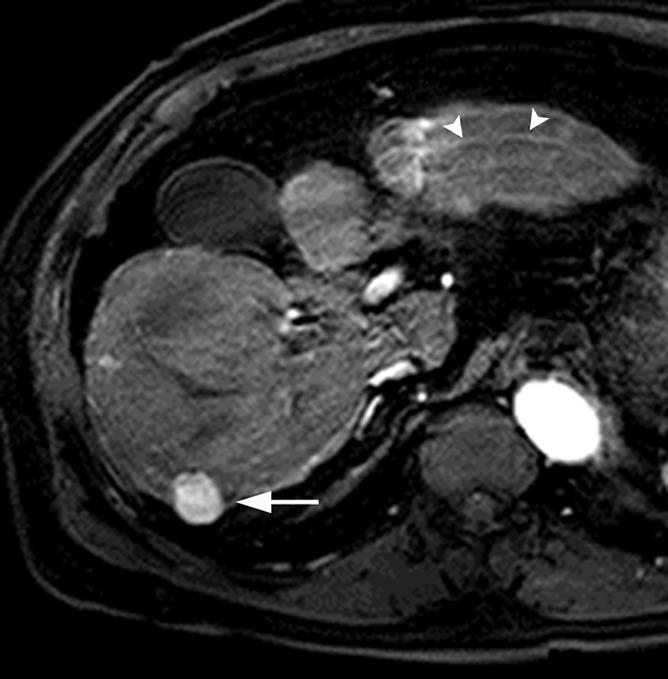
Images in a 64-year-old man with infiltrative HCC and macrovascular invasion. Axial CT images obtained in the (a) late arterial, (b) portal venous, and (c) 3-minute delayed phases after administration of an iodinated contrast agent reveal heterogeneously enhancing soft tissue expanding the lumen of the right portal vein and its branches consistent (arrowheads) with macrovascular invasion by HCC. Note arterial phase hyperenhancing tumoral arteries (arrows), sometimes described as “threads and streaks,” within the intraluminal tissue. Note patchy areas (*) of arterial phase hyperenhancement and delayed phase partial washout appearance in the liver parenchyma, consistent with infiltrative HCC.
Images in a 64-year-old man with infiltrative HCC and macrovascular invasion. Axial CT images obtained in the (a) late arterial, (b) portal venous, and (c) 3-minute delayed phases after administration of an iodinated contrast agent reveal heterogeneously enhancing soft tissue expanding the lumen of the right portal vein and its branches consistent (arrowheads) with macrovascular invasion by HCC. Note arterial phase hyperenhancing tumoral arteries (arrows), sometimes described as “threads and streaks,” within the intraluminal tissue. Note patchy areas (*) of arterial phase hyperenhancement and delayed phase partial washout appearance in the liver parenchyma, consistent with infiltrative HCC.
Images in a 64-year-old man with infiltrative HCC and macrovascular invasion. Axial CT images obtained in the (a) late arterial, (b) portal venous, and (c) 3-minute delayed phases after administration of an iodinated contrast agent reveal heterogeneously enhancing soft tissue expanding the lumen of the right portal vein and its branches consistent (arrowheads) with macrovascular invasion by HCC. Note arterial phase hyperenhancing tumoral arteries (arrows), sometimes described as “threads and streaks,” within the intraluminal tissue. Note patchy areas (*) of arterial phase hyperenhancement and delayed phase partial washout appearance in the liver parenchyma, consistent with infiltrative HCC.
Images in a 59-year-old man with early HCC and hepatitis B–related cirrhosis. (a) Gadoxetate disodium–enhanced T1-weighted 3D GRE MR image (2.5/0.9; 11° flip angle) obtained in late hepatic arterial phase shows no definite early enhancement. (b) Transitional phase image obtained at 3 minutes depicts hypointense nodule (arrow). (c) Nodule is not clearly delineated on T2-weighted fat-saturated turbo spin-echo image (3413/88). (d) Nodule (arrow) is hypointense on hepatobiliary phase image acquired 20 minutes after injection. (e) Gross pathologic evaluation of resected specimen reveals small, vaguely nodular HCC (arrow). Histologic examination confirmed well-differentiated early HCC. Early HCCs frequently are isoenhancing relative to liver in arterial phase (incomplete neoarterialization) but seen clearly as hypointense nodules in the hepatobiliary phase (underexpression of OATP transporters). Note motion artifact in the arterial phase.
Images in a 59-year-old man with early HCC and hepatitis B–related cirrhosis. (a) Gadoxetate disodium–enhanced T1-weighted 3D GRE MR image (2.5/0.9; 11° flip angle) obtained in late hepatic arterial phase shows no definite early enhancement. (b) Transitional phase image obtained at 3 minutes depicts hypointense nodule (arrow). (c) Nodule is not clearly delineated on T2-weighted fat-saturated turbo spin-echo image (3413/88). (d) Nodule (arrow) is hypointense on hepatobiliary phase image acquired 20 minutes after injection. (e) Gross pathologic evaluation of resected specimen reveals small, vaguely nodular HCC (arrow). Histologic examination confirmed well-differentiated early HCC. Early HCCs frequently are isoenhancing relative to liver in arterial phase (incomplete neoarterialization) but seen clearly as hypointense nodules in the hepatobiliary phase (underexpression of OATP transporters). Note motion artifact in the arterial phase.
Images in a 59-year-old man with early HCC and hepatitis B–related cirrhosis. (a) Gadoxetate disodium–enhanced T1-weighted 3D GRE MR image (2.5/0.9; 11° flip angle) obtained in late hepatic arterial phase shows no definite early enhancement. (b) Transitional phase image obtained at 3 minutes depicts hypointense nodule (arrow). (c) Nodule is not clearly delineated on T2-weighted fat-saturated turbo spin-echo image (3413/88). (d) Nodule (arrow) is hypointense on hepatobiliary phase image acquired 20 minutes after injection. (e) Gross pathologic evaluation of resected specimen reveals small, vaguely nodular HCC (arrow). Histologic examination confirmed well-differentiated early HCC. Early HCCs frequently are isoenhancing relative to liver in arterial phase (incomplete neoarterialization) but seen clearly as hypointense nodules in the hepatobiliary phase (underexpression of OATP transporters). Note motion artifact in the arterial phase.
Images in a 59-year-old man with early HCC and hepatitis B–related cirrhosis. (a) Gadoxetate disodium–enhanced T1-weighted 3D GRE MR image (2.5/0.9; 11° flip angle) obtained in late hepatic arterial phase shows no definite early enhancement. (b) Transitional phase image obtained at 3 minutes depicts hypointense nodule (arrow). (c) Nodule is not clearly delineated on T2-weighted fat-saturated turbo spin-echo image (3413/88). (d) Nodule (arrow) is hypointense on hepatobiliary phase image acquired 20 minutes after injection. (e) Gross pathologic evaluation of resected specimen reveals small, vaguely nodular HCC (arrow). Histologic examination confirmed well-differentiated early HCC. Early HCCs frequently are isoenhancing relative to liver in arterial phase (incomplete neoarterialization) but seen clearly as hypointense nodules in the hepatobiliary phase (underexpression of OATP transporters). Note motion artifact in the arterial phase.
Images in a 59-year-old man with early HCC and hepatitis B–related cirrhosis. (a) Gadoxetate disodium–enhanced T1-weighted 3D GRE MR image (2.5/0.9; 11° flip angle) obtained in late hepatic arterial phase shows no definite early enhancement. (b) Transitional phase image obtained at 3 minutes depicts hypointense nodule (arrow). (c) Nodule is not clearly delineated on T2-weighted fat-saturated turbo spin-echo image (3413/88). (d) Nodule (arrow) is hypointense on hepatobiliary phase image acquired 20 minutes after injection. (e) Gross pathologic evaluation of resected specimen reveals small, vaguely nodular HCC (arrow). Histologic examination confirmed well-differentiated early HCC. Early HCCs frequently are isoenhancing relative to liver in arterial phase (incomplete neoarterialization) but seen clearly as hypointense nodules in the hepatobiliary phase (underexpression of OATP transporters). Note motion artifact in the arterial phase.
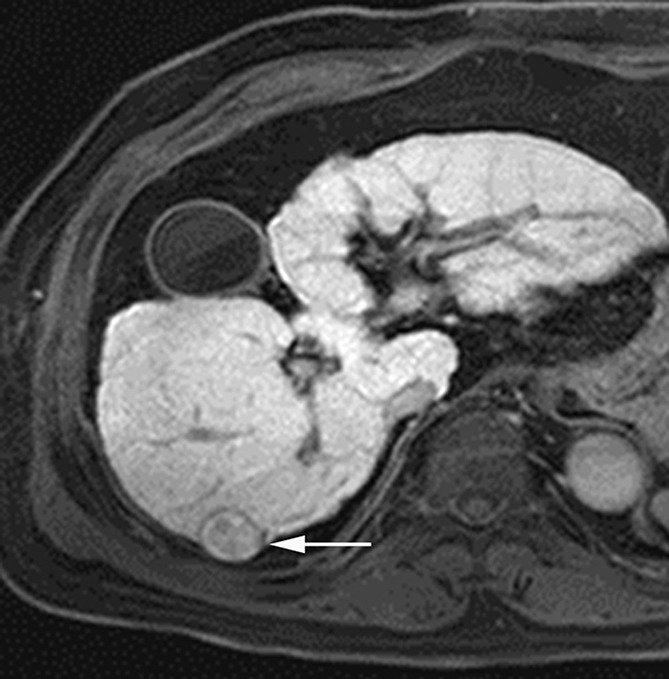
MR images in a 70-year-old man with HCC show hyperintensity in the hepatobiliary phase. (a) Gadoxetate disodium–enhanced T1-weighted 3D GRE image (2.5/0.9; 11° flip angle) in late hepatic arterial phase shows hyperenhancing mass (arrow) in right posterior liver. (b, c) Relative to liver, mass is slightly hyperintense in (b) portal venous phase and mildly hypointense in (c) transitional phase. (d) In the hepatobiliary phase, mass is hyperintense with hypointense rim, likely representing tumor capsule (arrow). Presence of hypointense rim permits confident diagnosis of HCC despite hyperintensity of lesion. Note motion artifact on arterial phase image (arrowheads).
MR images in a 70-year-old man with HCC show hyperintensity in the hepatobiliary phase. (a) Gadoxetate disodium–enhanced T1-weighted 3D GRE image (2.5/0.9; 11° flip angle) in late hepatic arterial phase shows hyperenhancing mass (arrow) in right posterior liver. (b, c) Relative to liver, mass is slightly hyperintense in (b) portal venous phase and mildly hypointense in (c) transitional phase. (d) In the hepatobiliary phase, mass is hyperintense with hypointense rim, likely representing tumor capsule (arrow). Presence of hypointense rim permits confident diagnosis of HCC despite hyperintensity of lesion. Note motion artifact on arterial phase image (arrowheads).
MR images in a 70-year-old man with HCC show hyperintensity in the hepatobiliary phase. (a) Gadoxetate disodium–enhanced T1-weighted 3D GRE image (2.5/0.9; 11° flip angle) in late hepatic arterial phase shows hyperenhancing mass (arrow) in right posterior liver. (b, c) Relative to liver, mass is slightly hyperintense in (b) portal venous phase and mildly hypointense in (c) transitional phase. (d) In the hepatobiliary phase, mass is hyperintense with hypointense rim, likely representing tumor capsule (arrow). Presence of hypointense rim permits confident diagnosis of HCC despite hyperintensity of lesion. Note motion artifact on arterial phase image (arrowheads).
MR images in a 70-year-old man with HCC show hyperintensity in the hepatobiliary phase. (a) Gadoxetate disodium–enhanced T1-weighted 3D GRE image (2.5/0.9; 11° flip angle) in late hepatic arterial phase shows hyperenhancing mass (arrow) in right posterior liver. (b, c) Relative to liver, mass is slightly hyperintense in (b) portal venous phase and mildly hypointense in (c) transitional phase. (d) In the hepatobiliary phase, mass is hyperintense with hypointense rim, likely representing tumor capsule (arrow). Presence of hypointense rim permits confident diagnosis of HCC despite hyperintensity of lesion. Note motion artifact on arterial phase image (arrowheads).
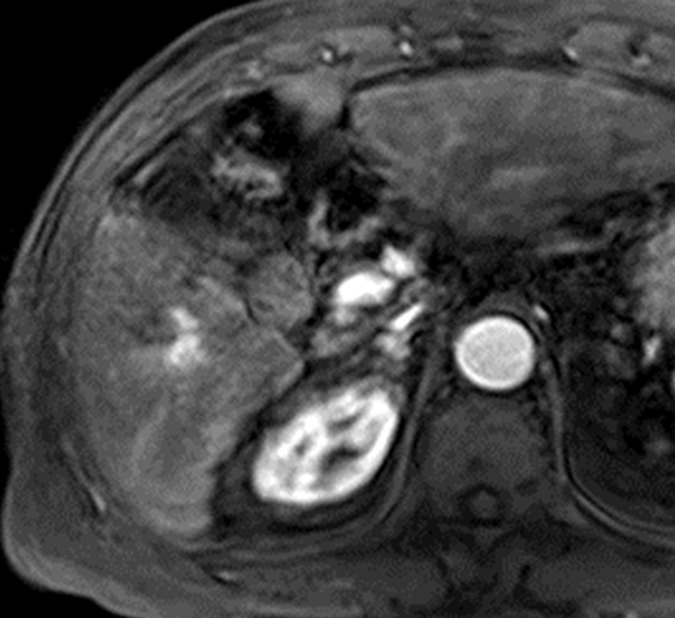
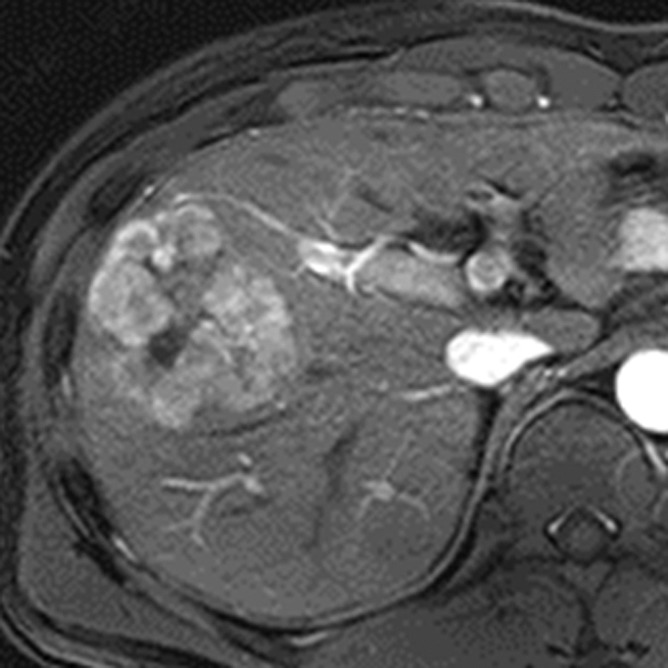
MR images in a 66-year-old woman with fat-containing HCC and hepatitis B–related cirrhosis. (a, b) Axial dual-echo GRE images show mass in segment VI of liver. Signal loss of mass on (b) out-of-phase compared with (a) in-phase image indicates intralesional fat. Note also nodule-in-nodule architecture on in-phase image with hyperintense inner nodule (*). (c) Mass shows heterogeneous predominantly peripheral enhancement in late hepatic arterial phase of gadoxetate disodium–enhanced T1-weighted 3D GRE image (3.0/1.4; 10° flip angle). (d) Mass is hypointense relative to liver in the portal venous phase. Surgical specimen confirmed moderately differentiated (Edmondson grade II) HCC with 80% fatty change. Although peripheral rim enhancement is somewhat unusual for HCC and can be observed in ICC and metastasis from extrahepatic primary, presence of intralesional fat permits confident radiologic diagnosis of HCC.
MR images in a 66-year-old woman with fat-containing HCC and hepatitis B–related cirrhosis. (a, b) Axial dual-echo GRE images show mass in segment VI of liver. Signal loss of mass on (b) out-of-phase compared with (a) in-phase image indicates intralesional fat. Note also nodule-in-nodule architecture on in-phase image with hyperintense inner nodule (*). (c) Mass shows heterogeneous predominantly peripheral enhancement in late hepatic arterial phase of gadoxetate disodium–enhanced T1-weighted 3D GRE image (3.0/1.4; 10° flip angle). (d) Mass is hypointense relative to liver in the portal venous phase. Surgical specimen confirmed moderately differentiated (Edmondson grade II) HCC with 80% fatty change. Although peripheral rim enhancement is somewhat unusual for HCC and can be observed in ICC and metastasis from extrahepatic primary, presence of intralesional fat permits confident radiologic diagnosis of HCC.
MR images in a 66-year-old woman with fat-containing HCC and hepatitis B–related cirrhosis. (a, b) Axial dual-echo GRE images show mass in segment VI of liver. Signal loss of mass on (b) out-of-phase compared with (a) in-phase image indicates intralesional fat. Note also nodule-in-nodule architecture on in-phase image with hyperintense inner nodule (*). (c) Mass shows heterogeneous predominantly peripheral enhancement in late hepatic arterial phase of gadoxetate disodium–enhanced T1-weighted 3D GRE image (3.0/1.4; 10° flip angle). (d) Mass is hypointense relative to liver in the portal venous phase. Surgical specimen confirmed moderately differentiated (Edmondson grade II) HCC with 80% fatty change. Although peripheral rim enhancement is somewhat unusual for HCC and can be observed in ICC and metastasis from extrahepatic primary, presence of intralesional fat permits confident radiologic diagnosis of HCC.
MR images in a 66-year-old woman with fat-containing HCC and hepatitis B–related cirrhosis. (a, b) Axial dual-echo GRE images show mass in segment VI of liver. Signal loss of mass on (b) out-of-phase compared with (a) in-phase image indicates intralesional fat. Note also nodule-in-nodule architecture on in-phase image with hyperintense inner nodule (*). (c) Mass shows heterogeneous predominantly peripheral enhancement in late hepatic arterial phase of gadoxetate disodium–enhanced T1-weighted 3D GRE image (3.0/1.4; 10° flip angle). (d) Mass is hypointense relative to liver in the portal venous phase. Surgical specimen confirmed moderately differentiated (Edmondson grade II) HCC with 80% fatty change. Although peripheral rim enhancement is somewhat unusual for HCC and can be observed in ICC and metastasis from extrahepatic primary, presence of intralesional fat permits confident radiologic diagnosis of HCC.
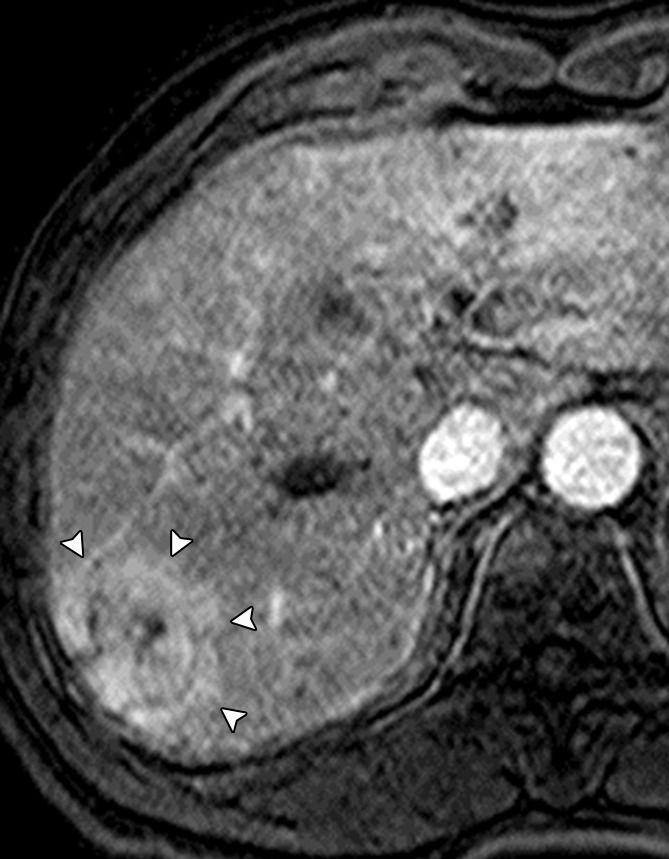
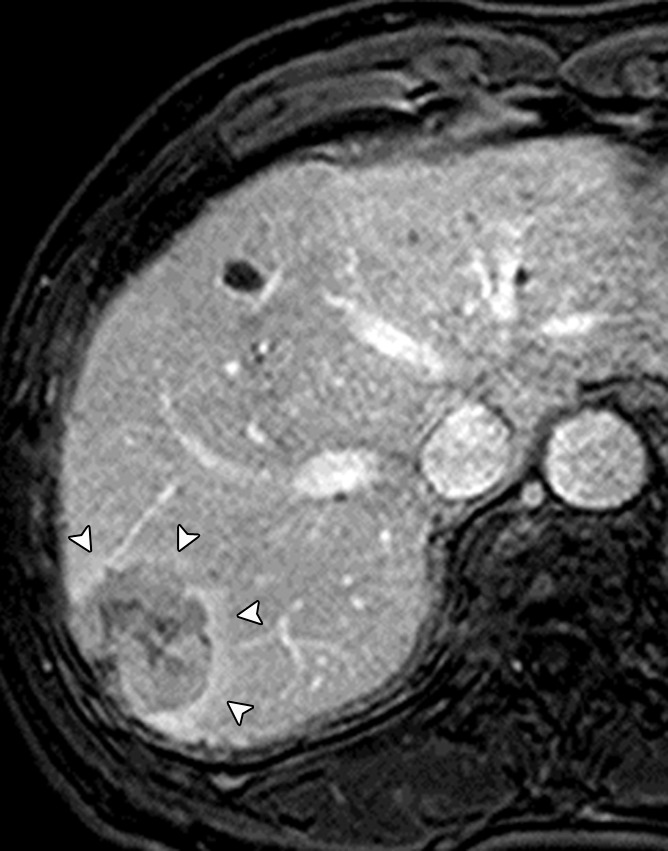
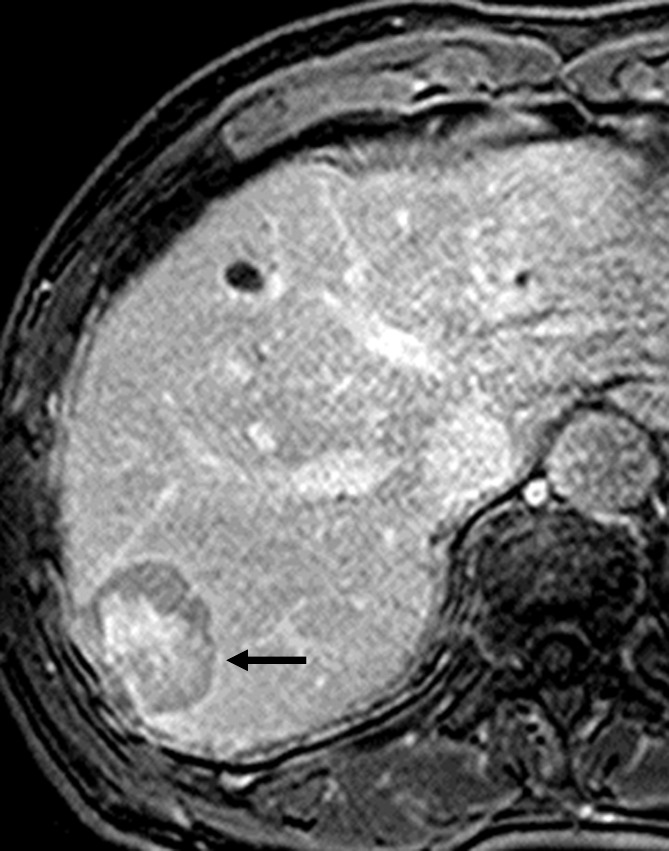
MR images in a 66-year-old man with HCC show corona enhancement and capsule appearance. T1-weighted 3D GRE images with fat suppression (3.2/1.6; 10° flip angle) obtained in (a) early and (b) late hepatic arterial phase after administration of gadolinium-based contrast agent show hyperenhancing mass in segment VII. Note partially circumferential enhancement (arrowheads) of variable thickness in the liver parenchyma around the mass in the late hepatic arterial phase. The enhancement of the perilesional parenchyma (arrowheads) fades in (c) the portal venous phase and is resolved by (d) the 3-minute delayed phase. The transient enhancement of the perilesional parenchyma is known as corona enhancement; this is thought to represent the area of liver parenchyma receiving venous drainage from progressed HCC and to be a frequent site of satellite metastases. Note the mass also has capsule appearance (arrow, d); as opposed to corona enhancement, which fades in the venous phases, capsule appearance manifests as progressively enhancing rim.
MR images in a 66-year-old man with HCC show corona enhancement and capsule appearance. T1-weighted 3D GRE images with fat suppression (3.2/1.6; 10° flip angle) obtained in (a) early and (b) late hepatic arterial phase after administration of gadolinium-based contrast agent show hyperenhancing mass in segment VII. Note partially circumferential enhancement (arrowheads) of variable thickness in the liver parenchyma around the mass in the late hepatic arterial phase. The enhancement of the perilesional parenchyma (arrowheads) fades in (c) the portal venous phase and is resolved by (d) the 3-minute delayed phase. The transient enhancement of the perilesional parenchyma is known as corona enhancement; this is thought to represent the area of liver parenchyma receiving venous drainage from progressed HCC and to be a frequent site of satellite metastases. Note the mass also has capsule appearance (arrow, d); as opposed to corona enhancement, which fades in the venous phases, capsule appearance manifests as progressively enhancing rim.
MR images in a 66-year-old man with HCC show corona enhancement and capsule appearance. T1-weighted 3D GRE images with fat suppression (3.2/1.6; 10° flip angle) obtained in (a) early and (b) late hepatic arterial phase after administration of gadolinium-based contrast agent show hyperenhancing mass in segment VII. Note partially circumferential enhancement (arrowheads) of variable thickness in the liver parenchyma around the mass in the late hepatic arterial phase. The enhancement of the perilesional parenchyma (arrowheads) fades in (c) the portal venous phase and is resolved by (d) the 3-minute delayed phase. The transient enhancement of the perilesional parenchyma is known as corona enhancement; this is thought to represent the area of liver parenchyma receiving venous drainage from progressed HCC and to be a frequent site of satellite metastases. Note the mass also has capsule appearance (arrow, d); as opposed to corona enhancement, which fades in the venous phases, capsule appearance manifests as progressively enhancing rim.
MR images in a 66-year-old man with HCC show corona enhancement and capsule appearance. T1-weighted 3D GRE images with fat suppression (3.2/1.6; 10° flip angle) obtained in (a) early and (b) late hepatic arterial phase after administration of gadolinium-based contrast agent show hyperenhancing mass in segment VII. Note partially circumferential enhancement (arrowheads) of variable thickness in the liver parenchyma around the mass in the late hepatic arterial phase. The enhancement of the perilesional parenchyma (arrowheads) fades in (c) the portal venous phase and is resolved by (d) the 3-minute delayed phase. The transient enhancement of the perilesional parenchyma is known as corona enhancement; this is thought to represent the area of liver parenchyma receiving venous drainage from progressed HCC and to be a frequent site of satellite metastases. Note the mass also has capsule appearance (arrow, d); as opposed to corona enhancement, which fades in the venous phases, capsule appearance manifests as progressively enhancing rim.
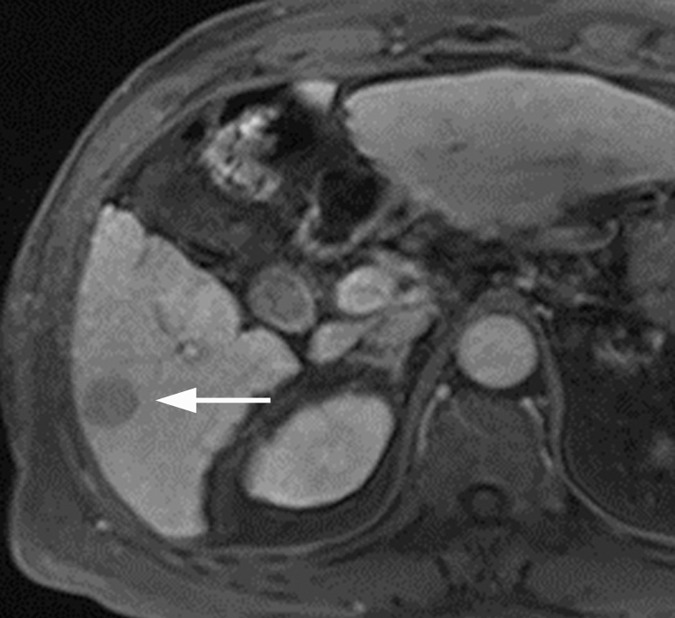
MR images in a 68-year-old man with HCC show nodule-in-nodule architecture. (a) Axial opposed-phase T1-weighted fast field echo image (181.3/2.3; 80° flip angle) and (b) precontrast T1-weighted 3D GRE image show hypointense inner nodule (1.5 cm) within hyperintense outer nodule (3.7 cm), consistent with nodule-in-nodule architecture. (c) Gadolinium-enhanced 3D GRE image in late hepatic arterial phase shows arterial hyperenhancement of inner nodule (arrow); outer nodule is isointense to liver. (d) Inner nodule shows washout appearance on 3-minute delayed phase image and, except for a small central area, is hypointense relative to outer nodule and surrounding liver; outer nodule remains isointense and is imperceptible on this image. Arterial phase hyperenhancement and venous phase washout appearance of inner nodule suggest progressed HCC arising within more well-differentiated parent nodule.
MR images in a 68-year-old man with HCC show nodule-in-nodule architecture. (a) Axial opposed-phase T1-weighted fast field echo image (181.3/2.3; 80° flip angle) and (b) precontrast T1-weighted 3D GRE image show hypointense inner nodule (1.5 cm) within hyperintense outer nodule (3.7 cm), consistent with nodule-in-nodule architecture. (c) Gadolinium-enhanced 3D GRE image in late hepatic arterial phase shows arterial hyperenhancement of inner nodule (arrow); outer nodule is isointense to liver. (d) Inner nodule shows washout appearance on 3-minute delayed phase image and, except for a small central area, is hypointense relative to outer nodule and surrounding liver; outer nodule remains isointense and is imperceptible on this image. Arterial phase hyperenhancement and venous phase washout appearance of inner nodule suggest progressed HCC arising within more well-differentiated parent nodule.
MR images in a 68-year-old man with HCC show nodule-in-nodule architecture. (a) Axial opposed-phase T1-weighted fast field echo image (181.3/2.3; 80° flip angle) and (b) precontrast T1-weighted 3D GRE image show hypointense inner nodule (1.5 cm) within hyperintense outer nodule (3.7 cm), consistent with nodule-in-nodule architecture. (c) Gadolinium-enhanced 3D GRE image in late hepatic arterial phase shows arterial hyperenhancement of inner nodule (arrow); outer nodule is isointense to liver. (d) Inner nodule shows washout appearance on 3-minute delayed phase image and, except for a small central area, is hypointense relative to outer nodule and surrounding liver; outer nodule remains isointense and is imperceptible on this image. Arterial phase hyperenhancement and venous phase washout appearance of inner nodule suggest progressed HCC arising within more well-differentiated parent nodule.
MR images in a 68-year-old man with HCC show nodule-in-nodule architecture. (a) Axial opposed-phase T1-weighted fast field echo image (181.3/2.3; 80° flip angle) and (b) precontrast T1-weighted 3D GRE image show hypointense inner nodule (1.5 cm) within hyperintense outer nodule (3.7 cm), consistent with nodule-in-nodule architecture. (c) Gadolinium-enhanced 3D GRE image in late hepatic arterial phase shows arterial hyperenhancement of inner nodule (arrow); outer nodule is isointense to liver. (d) Inner nodule shows washout appearance on 3-minute delayed phase image and, except for a small central area, is hypointense relative to outer nodule and surrounding liver; outer nodule remains isointense and is imperceptible on this image. Arterial phase hyperenhancement and venous phase washout appearance of inner nodule suggest progressed HCC arising within more well-differentiated parent nodule.
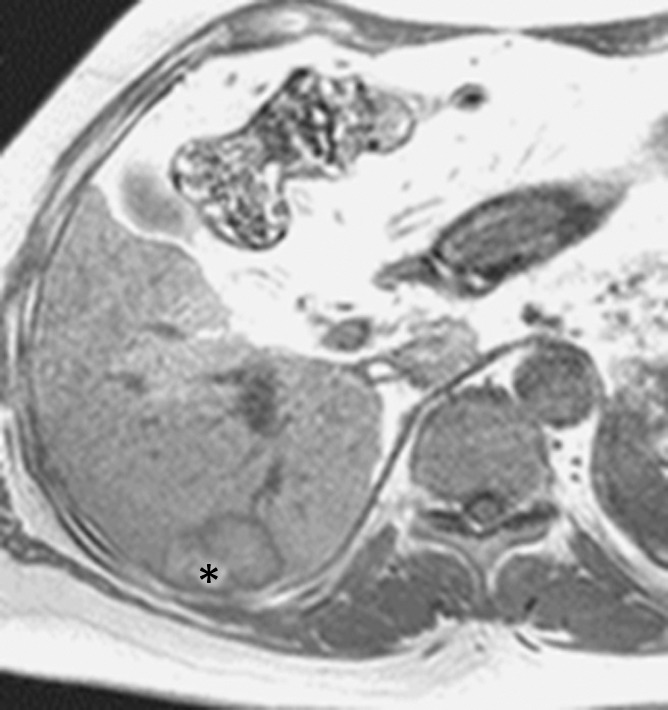
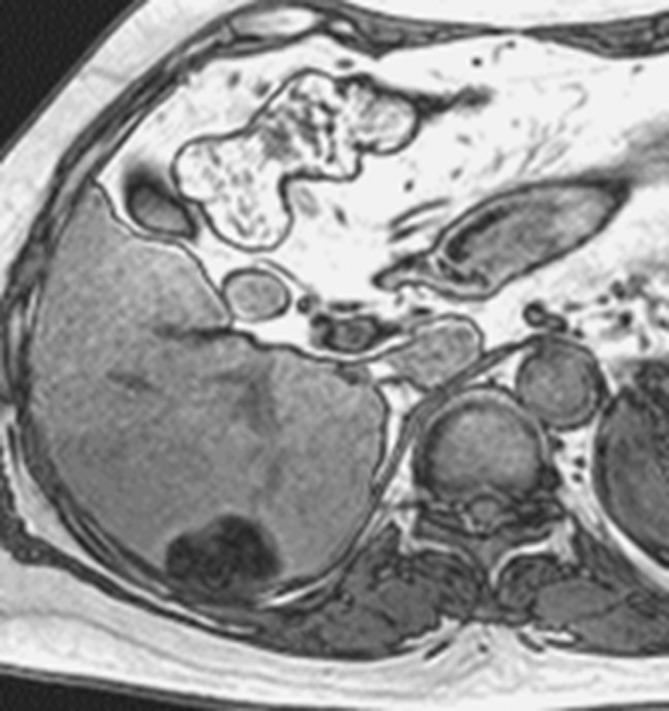
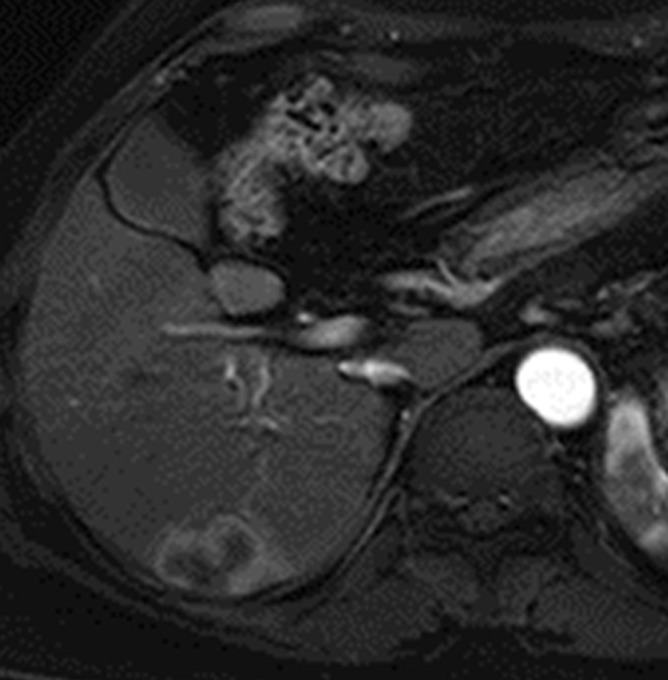
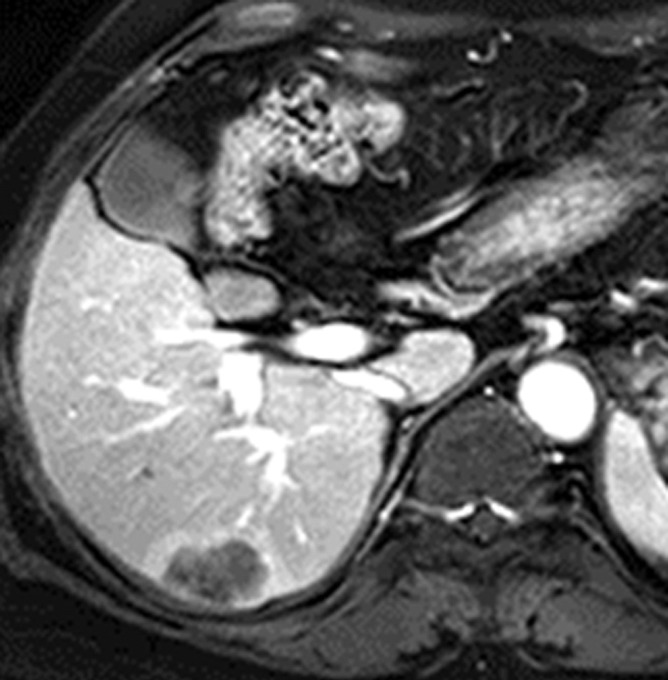
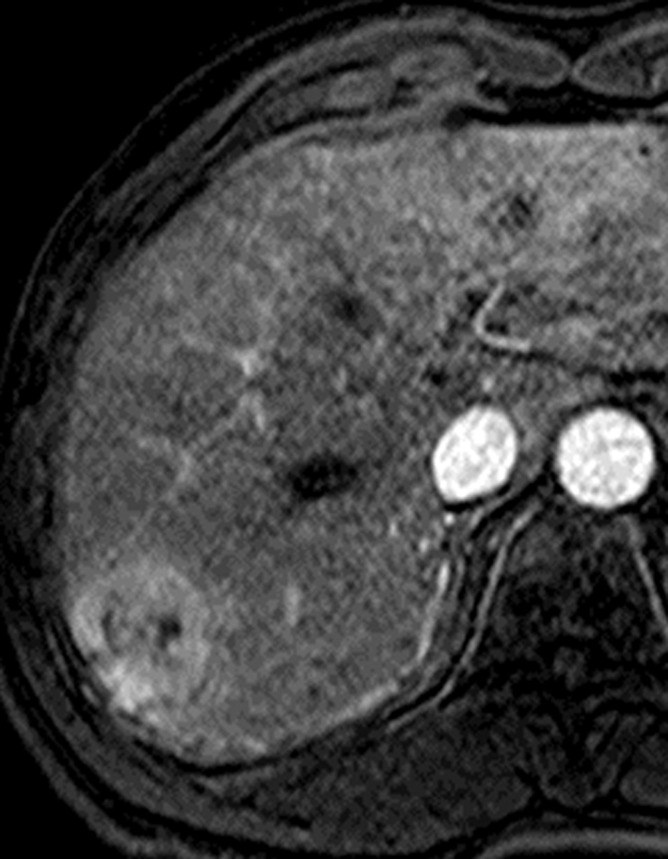
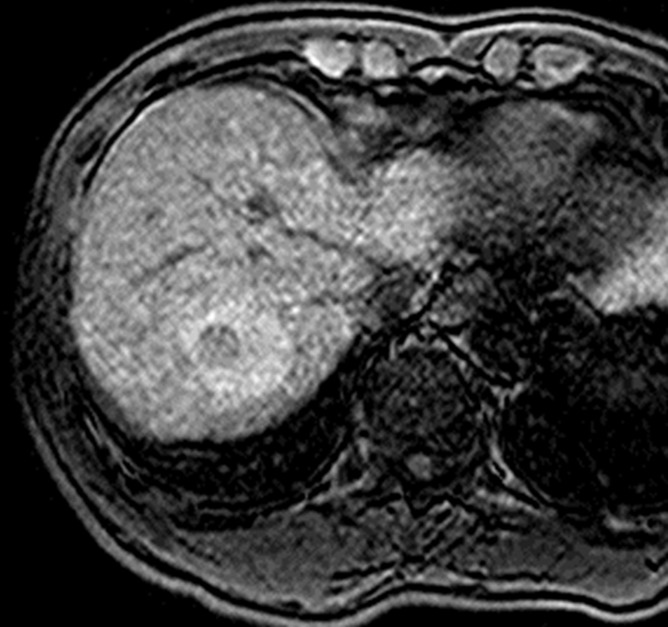
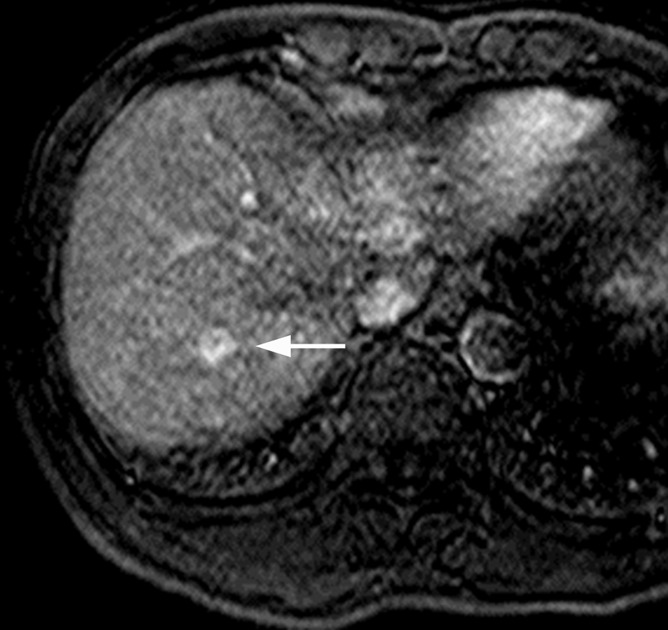
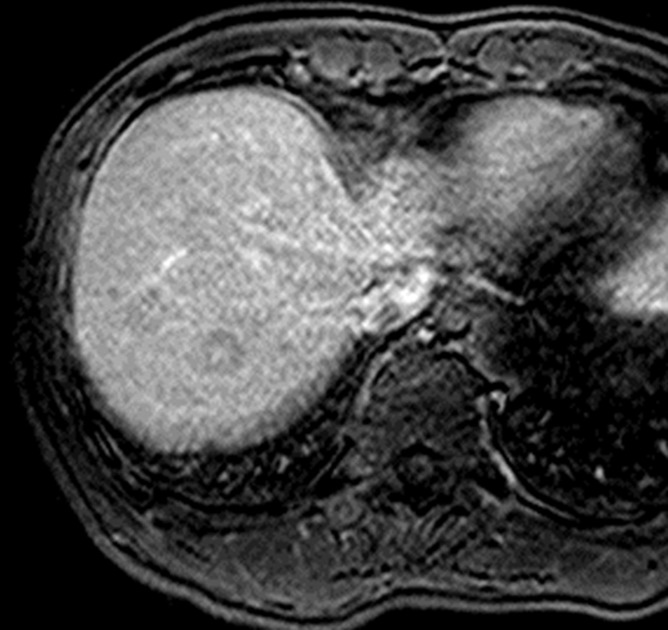
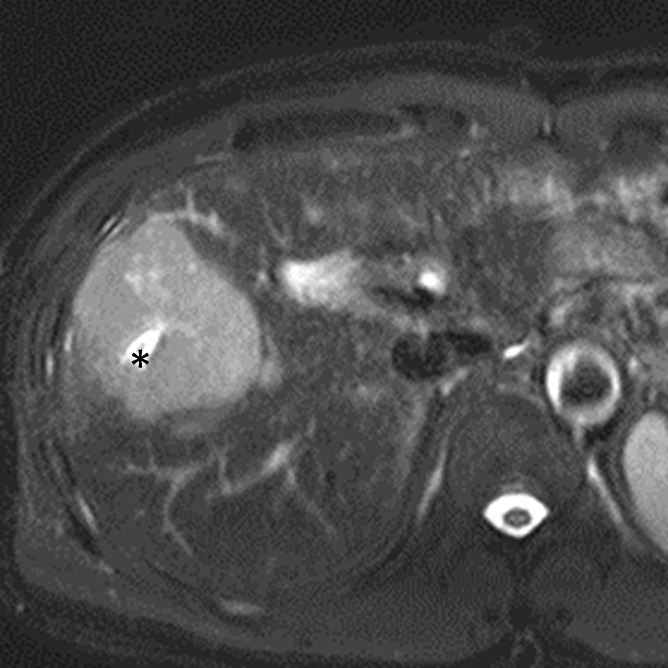
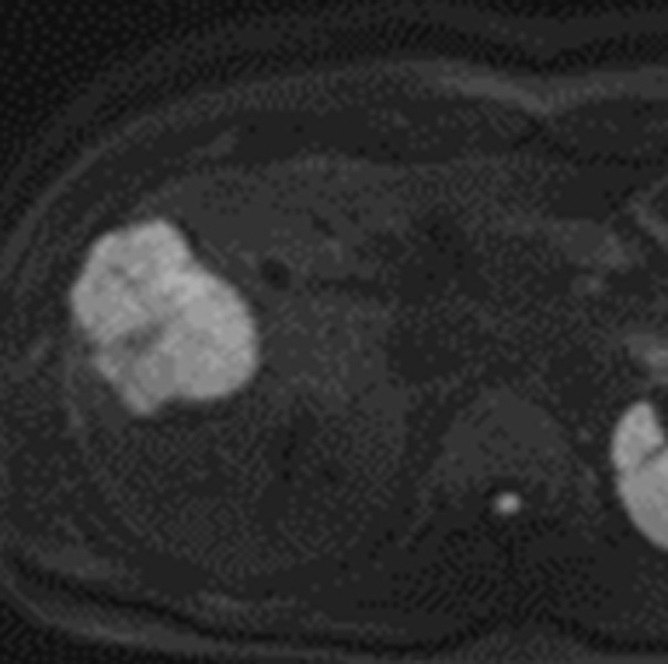
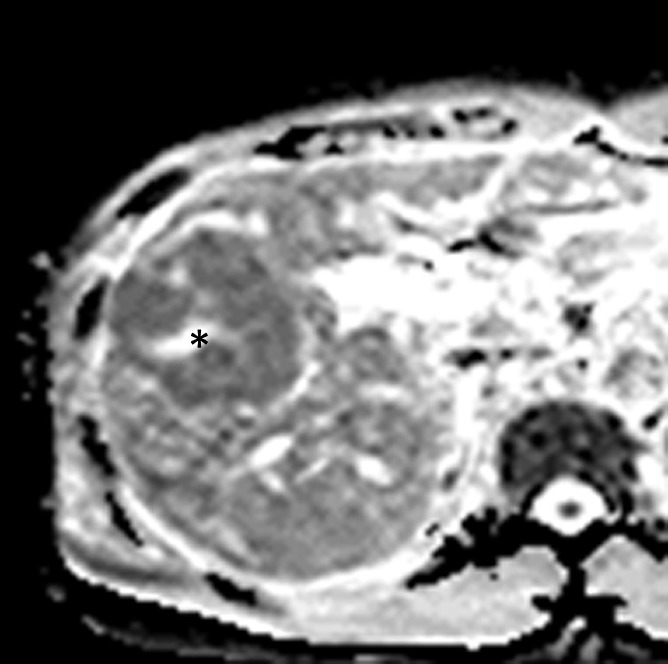
MR images in a 46-year-old man with hepatitis B–related cirrhosis and HCC show restricted diffusion. (a) Gadoxetate disodium–enhanced T1-weighted 3D GRE image (3.0/1.4; 10° flip angle) acquired in late hepatic arterial phase shows large heterogeneous mass with mosaic architecture measuring 6 cm in right lobe of liver. (b) Mass is moderately hyperintense on T2-weighted turbo spin-echo image (951/80). (c) Diffusion-weighted image (b = 800 sec/mm2) shows hyperintensity, suggesting restricted diffusion, confirmed on (d) ADC map. Estimated ADC is 1010 mm2/sec. Restricted diffusion is highly suggestive of malignancy but not specific for HCC. Mosaic architecture in arterial phase and washout appearance in venous phases (not shown) permit specific diagnosis of HCC. Note central necrotic component within tumor (*). Necrotic component is markedly hyperintense on T2-weighted image (b), and has relatively unrestricted diffusion (d).
MR images in a 46-year-old man with hepatitis B–related cirrhosis and HCC show restricted diffusion. (a) Gadoxetate disodium–enhanced T1-weighted 3D GRE image (3.0/1.4; 10° flip angle) acquired in late hepatic arterial phase shows large heterogeneous mass with mosaic architecture measuring 6 cm in right lobe of liver. (b) Mass is moderately hyperintense on T2-weighted turbo spin-echo image (951/80). (c) Diffusion-weighted image (b = 800 sec/mm2) shows hyperintensity, suggesting restricted diffusion, confirmed on (d) ADC map. Estimated ADC is 1010 mm2/sec. Restricted diffusion is highly suggestive of malignancy but not specific for HCC. Mosaic architecture in arterial phase and washout appearance in venous phases (not shown) permit specific diagnosis of HCC. Note central necrotic component within tumor (*). Necrotic component is markedly hyperintense on T2-weighted image (b), and has relatively unrestricted diffusion (d).
MR images in a 46-year-old man with hepatitis B–related cirrhosis and HCC show restricted diffusion. (a) Gadoxetate disodium–enhanced T1-weighted 3D GRE image (3.0/1.4; 10° flip angle) acquired in late hepatic arterial phase shows large heterogeneous mass with mosaic architecture measuring 6 cm in right lobe of liver. (b) Mass is moderately hyperintense on T2-weighted turbo spin-echo image (951/80). (c) Diffusion-weighted image (b = 800 sec/mm2) shows hyperintensity, suggesting restricted diffusion, confirmed on (d) ADC map. Estimated ADC is 1010 mm2/sec. Restricted diffusion is highly suggestive of malignancy but not specific for HCC. Mosaic architecture in arterial phase and washout appearance in venous phases (not shown) permit specific diagnosis of HCC. Note central necrotic component within tumor (*). Necrotic component is markedly hyperintense on T2-weighted image (b), and has relatively unrestricted diffusion (d).
MR images in a 46-year-old man with hepatitis B–related cirrhosis and HCC show restricted diffusion. (a) Gadoxetate disodium–enhanced T1-weighted 3D GRE image (3.0/1.4; 10° flip angle) acquired in late hepatic arterial phase shows large heterogeneous mass with mosaic architecture measuring 6 cm in right lobe of liver. (b) Mass is moderately hyperintense on T2-weighted turbo spin-echo image (951/80). (c) Diffusion-weighted image (b = 800 sec/mm2) shows hyperintensity, suggesting restricted diffusion, confirmed on (d) ADC map. Estimated ADC is 1010 mm2/sec. Restricted diffusion is highly suggestive of malignancy but not specific for HCC. Mosaic architecture in arterial phase and washout appearance in venous phases (not shown) permit specific diagnosis of HCC. Note central necrotic component within tumor (*). Necrotic component is markedly hyperintense on T2-weighted image (b), and has relatively unrestricted diffusion (d).
References
-
- Lencioni R, Piscaglia F, Bolondi L. Contrast-enhanced ultrasound in the diagnosis of hepatocellular carcinoma. J Hepatol 2008;48(5):848–857. - PubMed
-
- Kim SR, Ando K, Mita K, et al. . Superiority of CT arterioportal angiography to contrast-enhanced CT and MRI in the diagnosis of hepatocellular carcinoma in nodules smaller than 2 cm. Oncology 2007;72(Suppl 1):58–66. - PubMed
-
- Yoo HJ, Lee JM, Lee JY, et al. . Additional value of SPIO-enhanced MR imaging for the noninvasive imaging diagnosis of hepatocellular carcinoma in cirrhotic liver. Invest Radiol 2009;44(12):800–807. - PubMed
-
- Kim BK, Kang WJ, Kim JK, et al. . 18F-fluorodeoxyglucose uptake on positron emission tomography as a prognostic predictor in locally advanced hepatocellular carcinoma. Cancer 2011;117(20):4779–4787. - PubMed
-
- Bruix J, Sherman M; Practice Guidelines Committee, American Association for the Study of Liver Diseases. Management of hepatocellular carcinoma. Hepatology 2005;42(5):1208–1236. - PubMed
Publication types
MeSH terms
Substances
Grants and funding
LinkOut - more resources
Full Text Sources
Other Literature Sources
Medical
