. 2015;7(2):136-52.
doi: 10.1159/000366103. Epub 2014 Sep 19.

Macrophage-expressed perforins mpeg1 and mpeg1.2 have an anti-bacterial function in zebrafish

Affiliations

Macrophage-expressed perforins mpeg1 and mpeg1.2 have an anti-bacterial function in zebrafish

Erica L Benard et al. J Innate Immun. 2015.

Abstract

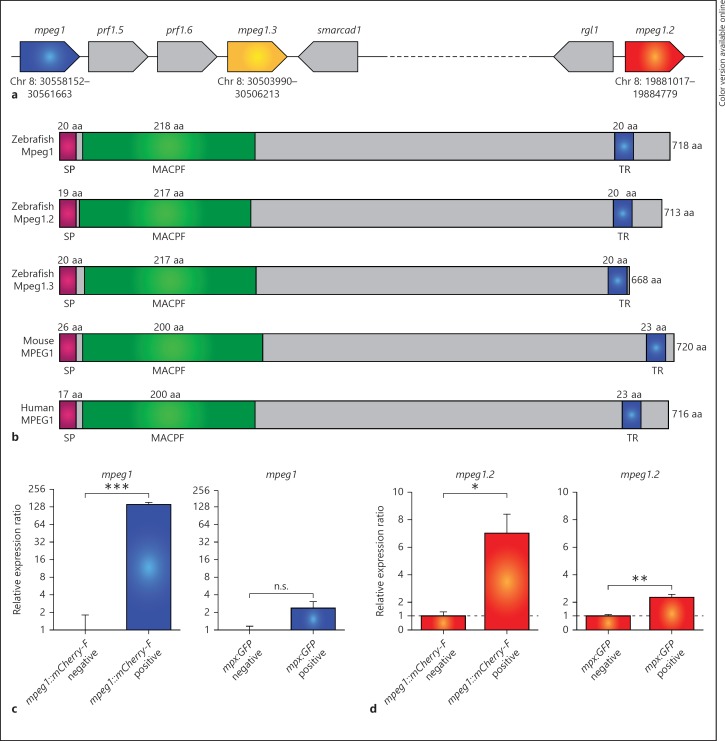
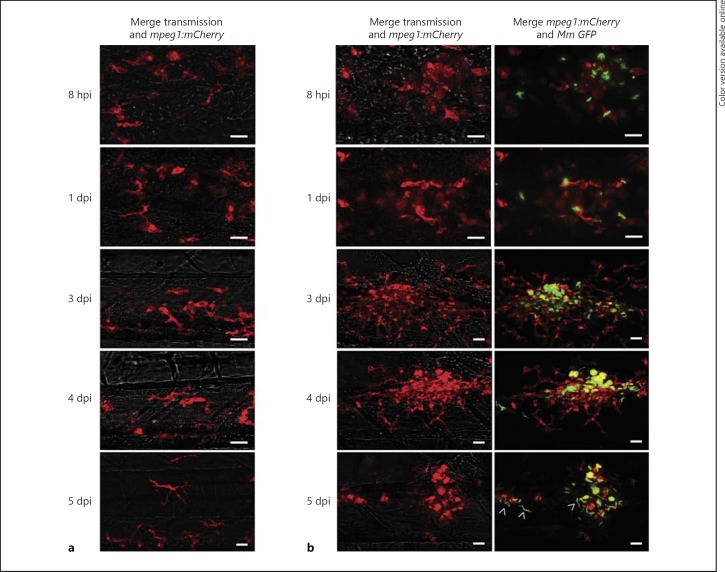
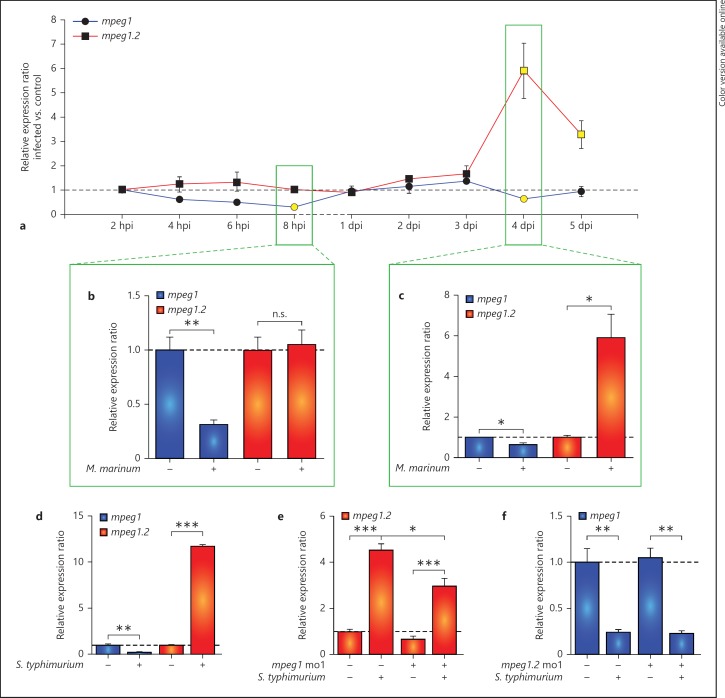
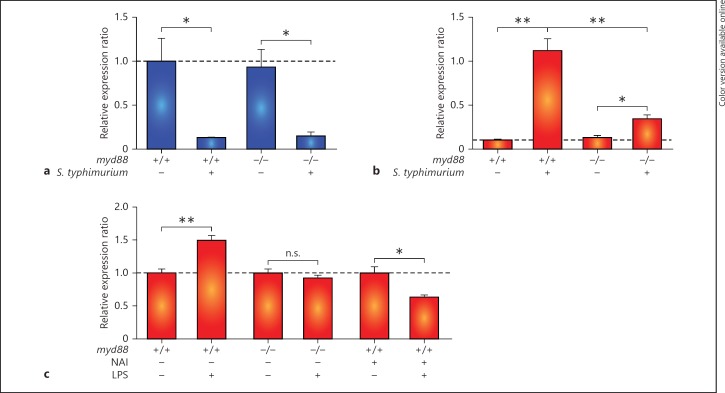
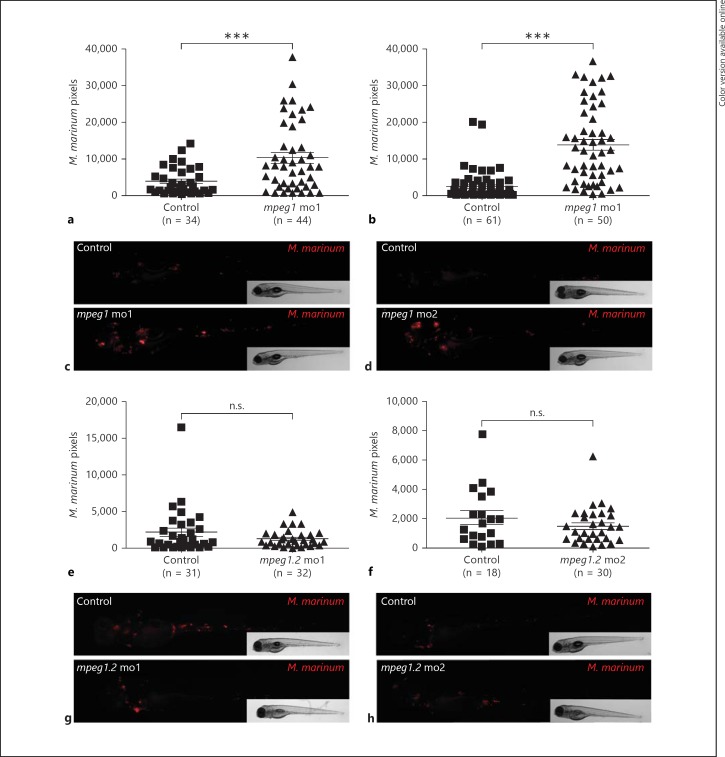
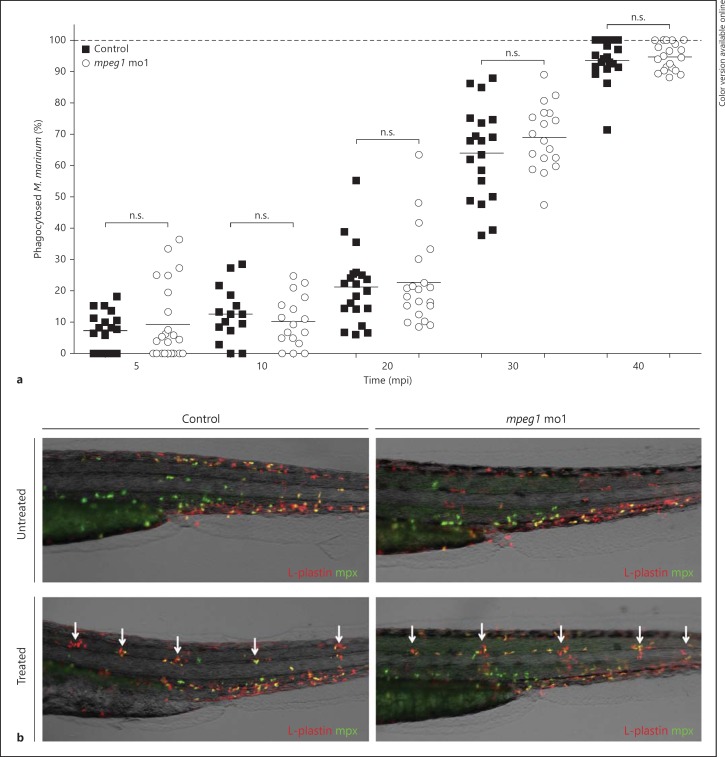
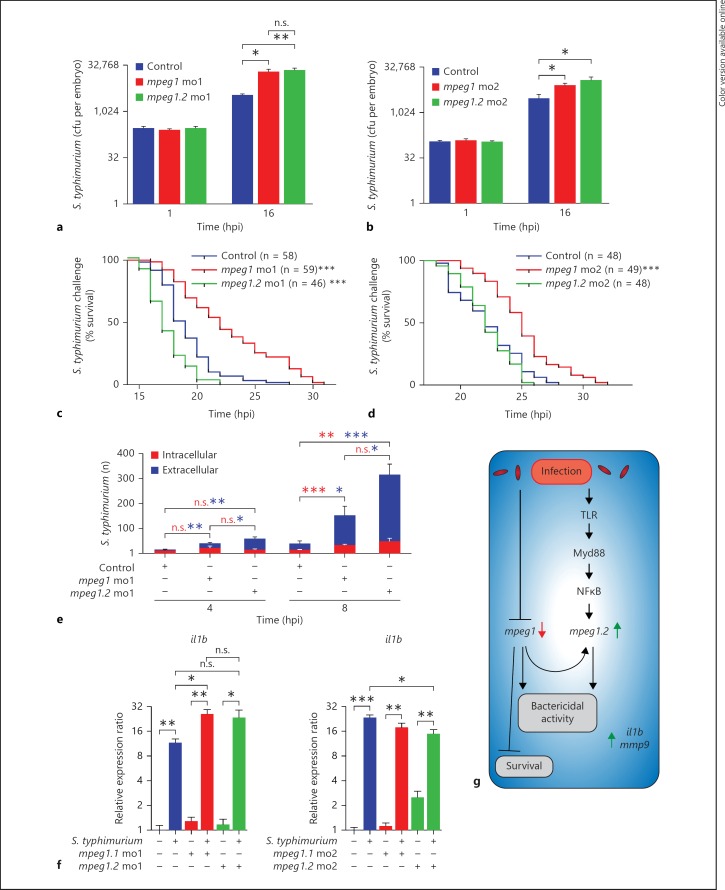
Macrophage-expressed gene 1 (MPEG1) encodes an evolutionarily conserved protein with a predicted membrane attack complex/perforin domain associated with host defence against invading pathogens. In vertebrates, MPEG1/perforin-2 is an integral membrane protein of macrophages, suspected to be involved in the killing of intracellular bacteria by pore-forming activity. Zebrafish have 3 copies of MPEG1; 2 are expressed in macrophages, whereas the third could be a pseudogene. The mpeg1 and mpeg1.2 genes show differential regulation during infection of zebrafish embryos with the bacterial pathogens Mycobacterium marinum and Salmonella typhimurium. While mpeg1 is downregulated during infection with both pathogens, mpeg1.2 is infection inducible. Upregulation of mpeg1.2 is partially dependent on the presence of functional Mpeg1 and requires the Toll-like receptor adaptor molecule MyD88 and the transcription factor NFκB. Knockdown of mpeg1 alters the immune response to M. marinum infection and results in an increased bacterial burden. In Salmonella typhimurium infection, both mpeg1 and mpeg1.2 knockdown increase the bacterial burdens, but mpeg1 morphants show increased survival times. The combined results of these two in vivo infection models support the anti-bacterial function of the MPEG1/perforin-2 family and indicate that the intricate cross-regulation of the two mpeg1 copies aids the zebrafish host in combatting infection of various pathogens.


Figures

Fig. 1
Fig. 1
Zebrafish mpeg1 genes encode proteins with conserved transmembrane and MACPF domains and are expressed in macrophages. a Schematic representation of the region containing the genes mpeg1, mpeg1.2 and mpeg1.3 on zebrafish chromosome 8 (Chr 8). The coding direction of the genes is indicated by the pointed end and the exact location is indicated in digits below the gene. b Comparison of the predicted Mpeg1, Mpeg1.2 and Mpeg1.3 protein structures with murine and human MPEG1. The signal peptide (SP), MACPF and transmembrane region (TR) are conserved domains detected by SMART analysis. c, d Expression of zebrafish mpeg1 and mpeg1.2 in macrophages (c) and neutrophils (d). qPCR analysis was performed on RNA from fluorescence-positive cell fractions obtained by cell sorting of 6-dpf larvae of transgenic reporter lines for macrophages [mpeg1: Tg(mpeg1::mCherry-F)] and neutrophils [mpx: Tg(mpx:EGFP)]. Expression was compared against the fluorescence-negative cell fraction of each transgenic line. Graphs show combined data of 3 biological replicates [log2 scale (c)]. n.s. = Not significant.
Fig. 2
Fig. 2
Tg(mpeg1)-positive macrophages are involved in the formation of M. marinum granuloma-like aggregates. GFP-expressing M. marinum M-strain (150 cfu) bacterial infection in Tg(mpeg1::mCherry-F) zebrafish embryos. Confocal z-stack projections showing identical locations in the posterior region of the caudal haematopoietic tissue in an uninfected embryo (a) and an infected embryo (b) developing a granuloma-like aggregate (same infection site followed over time). Images were taken at 8 hpi and at 1 dpi, 2 dpi (not shown), 3 dpi, 4 dpi and 5 dpi. Arrowheads indicate cording of M. marinum. Scale bar = 20 μm.
Fig. 3
Fig. 3
mpeg1 is downregulated and mpeg1.2 is upregulated upon bacterial infection. a-cmpeg1 and mpeg1.2 expression during M. marinum infection. AB/TL embryos were injected with M. marinum Mma20 bacteria (200 cfu) or 2% PVP as a mock control. The expression of mpeg1 and mpeg1.2 was analysed by qPCR at 2, 4, 6 and 8 hpi and at 1, 2, 3, 4 and 5 dpi. The light colouring of the data points in a indicates that the expression in the infected embryos was significantly different from that in the uninfected controls, and in b and c the full data sets are shown for the time point indicated in boxes in a. dmpeg1 and mpeg1.2 expression in response to S. typhimurium SL1027 infection. AB/TL embryos were injected with 200 cfu of bacteria or mock injected with PBS, and qPCR was performed at 8 hpi. e, f Effect of mpeg1 and mpeg1.2 morpholino knockdown on each other's gene expression. AB/TL embryos were injected with mpeg1 (e) or mpeg1.2 (f) morpholino and subsequently infected with S. typhimurium SL1027 as in d. Note that mpeg1 knockdown had a reducing effect on the upregulation of mpeg1.2 expression by S. typhimurium infection, while mpeg1.2 knockdown did not affect the infection-dependent downregulation of mpeg1. Verification of the knockdown effects is shown in online supplementary figure 4A, B, C, D. qPCR results are presented as relative ratios of 3 biological replicates of the infected groups compared to the relevant mock injected control groups (n = 18 per group). n.s. = Not significant.
Fig. 4
Fig. 4
mpeg1.2 upregulation but not mpeg1 downregulation is Myd88 and NFκB dependent. a, b Effect of myd88 mutation on the response of mpeg1 and mpeg1.2 to S. typhimurium infection. Expression levels of mpeg1 (a) and mpeg1.2 (b) were determined by qPCR for myd88+/+ and myd88−/− embryos at 8 hpi after infection with S. typhimurium SL1027 bacteria (150 cfu) and mock PBS injected controls. c Effect of myd88 mutation and NFκB inhibition on the response of mpeg1.2 to LPS treatment. mpeg1.2 expression in myd88+/+, myd88−/− and NFκB activation inhibitor-treated embryos in response to injection with purified LPS (100 μg/ml) or PBS as a control was determined at 2 hpi. All graphs show data combined from 3 biological replicates (n = 20 per group, pooled per replicate). n.s. = Not significant.
Fig. 5
Fig. 5
mpeg1 knockdown impairs control of M. marinum infection. AB/TL embryos were injected with 2 different splice-blocking morpholinos against mpeg1 (a-d) or mpeg1.2 (e-h) or with a control morpholino, and subsequently injected with mCherry-expressing M. marinum Mma20 strain; infected embryos were imaged at 4 dpi. a, b, e, f The bacterial burden was quantified by determining the number of fluorescent bacterial pixels using dedicated software, and representative stereo fluorescent images are shown below the graph of each experiment (c, d, g, h). Graphs show 1 representative result of 5 (a) or 3 (b, e, f) repeated independent experiments. Each data point represents an individual embryo. n.s. = Not significant; mo1 = morpholino 1; mo2 = morpholino 2.
Fig. 6
Fig. 6
mpeg1 does not play a role in phagocytosis of M. marinum or in leukocyte migration towards local inflammation. a Quantification of M. marinum phagocytosis. mpeg1 morphants and their controls were injected with an mCherry-expressing M. marinum Mma20 strain (180 cfu), fixed at 5, 10, 20, 30 and 40 min post-infection, and stained with L-plastin Ab to label leukocytes. Intra- and extra-cellular bacteria were counted over the yolk sac and results are presented as percentages of phagocytosed Mma20. b Representative images of untreated and copper sulphate-treated control and mpeg1 morphant 3 dpf embryos. Embryos were immunolabelled with Ab against the general leukocyte marker L-plastin (red signal) in combination with a neutrophil-specific Mpx TSA staining (green signal). White arrows indicate accumulation of leukocytes at the local inflammation sites at the neuromasts. n.s. = Not significant; mo1 = morpholino 1.
Fig. 7
Fig. 7
Effect of mpeg1 knockdown on the innate immune response during M. marinum infection in comparison with known effects of ptpn6 and myd88 deficiencies. Graphs show the effects of mpeg1 mo1 knockdown (a), ptpn6 morpholino knockdown (b) andmyd88 mutation (c) on a set of genes that showed reproducible induction by M. marinum infection in control embryos. The expression level of these genes under conditions of mpeg1, ptpn6 or myd88 deficiency is expressed as the percentage of the expression level in the corresponding control. Results are based on RNAseq analysis of pools of 30 infected and 30 uninfected embryos for each group. Embryos were injected with M. marinum Mma20 (300 cfu) or mock injected with 2% PVP, and RNAseq analysis was performed at 4 dpi.
Fig. 8
Fig. 8
mpeg1 and mpeg1.2 knockdown increase the bacterial burden and pro-inflammatory gene expression but have opposite effects on host survival during S. typhimurium infection. a, b Quantification of the bacterial burden. mpeg1 and mpeg1.2 morphants [morpholino 1 (a) and morpholino 2 (b)] and control embryos were injected with Ds-Red-expressing S. typhimurium SL1027 bacteria (200 cfu) and PBS as a mock control. Embryos were homogenized and plated at 1 and 16 hpi to determine S. typhimurium cfu counts (n = 5 per group, 2 biological replicates, log2 scale). c, d Survival rates. The percentage of survival of infected mpeg1 morphants, mpeg1.2 morphants [morpholino 1 (c) and morpholinos 2 (d)] and control embryos was determined over a time course of 32 hpi. DsRed-expressing S. typhimurium SL1027 bacteria were injected into the blood circulation (150 cfu). Survival curves of mpeg1 morphants, mpeg1.2 morphants and control embryos are shown (1 representative experiment of 3 individual experiments). e Quantification of intracellular and extracellular S. typhimurium over the duct of Cuvier in control embryos, mpeg1 morphants and mpeg1.2 morphants at 4 and 8 hpi (representative confocal images are shown in online suppl. fig. 4). Statistical significance is indicated for intracellular S. typhimurium (red asterisks) and extracellular S. typhimurium (blue asterisks) (calculated from confocal images of n = 6–8 embryos per group). f Pro-inflammatory gene expression of il1b under the same experimental conditions as in a and b was analysed by qPCR at 16 hpi (n = 15 per group, pooled per replicate, 3 biological replicates, log2 scale). g Schematic representation of mpeg1 and mpeg1.2 regulation and their function. n.s. = Not significant; mo1 = morpholino 1; mo2 = morpholino 2.

References

    1. Kondos SC, Hatfaludi T, Voskoboinik I, Trapani JA, Law RHP, Whisstock JC, Dunstone MA. The structure and function of mammalian membrane-attack complex/perforin-like proteins. Tissue Antigens. 2010;76:341–351. - PubMed
    1. Rosado CJ, Kondos S, Bull TE, Kuiper MJ, Law RH, Buckle AM, Voskoboinik I, Bird PI, Trapani JA, Whisstock JC, Dunstone MA. The MACPF/CDC family of pore-forming toxins. Cell Microbiol. 2008;10:1765–1774. - PMC - PubMed
    1. McCormack R, de Armas L, Shiratsuchi M, Podack ER. Killing machines: three pore-forming proteins of the immune system. Immunol Res. 2013;57:268–278. - PMC - PubMed
    1. Voskoboinik I, Dunstone MA, Baran K, Whisstock JC, Trapani JA. Perforin: structure, function, and role in human immunopathology. Immunol Rev. 2010;235:35–54. - PubMed
    1. Spilsbury K, O'Mara MA, Wu WM, Rowe PB, Symonds G, Takayama Y. Isolation of a novel macrophage-specific gene by differential cDNA analysis. Blood. 1995;85:1620–1629. - PubMed

Publication types

MeSH terms