. 2014 Nov;166(3):1659-74.
doi: 10.1104/pp.114.245787. Epub 2014 Sep 23.

Assessing the metabolic impact of nitrogen availability using a compartmentalized maize leaf genome-scale model

Affiliations

Assessing the metabolic impact of nitrogen availability using a compartmentalized maize leaf genome-scale model

Margaret Simons et al. Plant Physiol. 2014 Nov.

Abstract

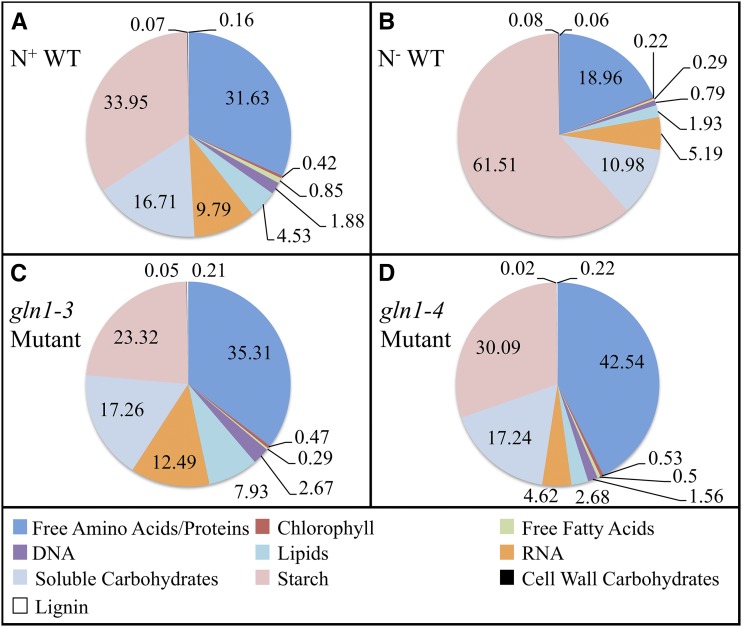
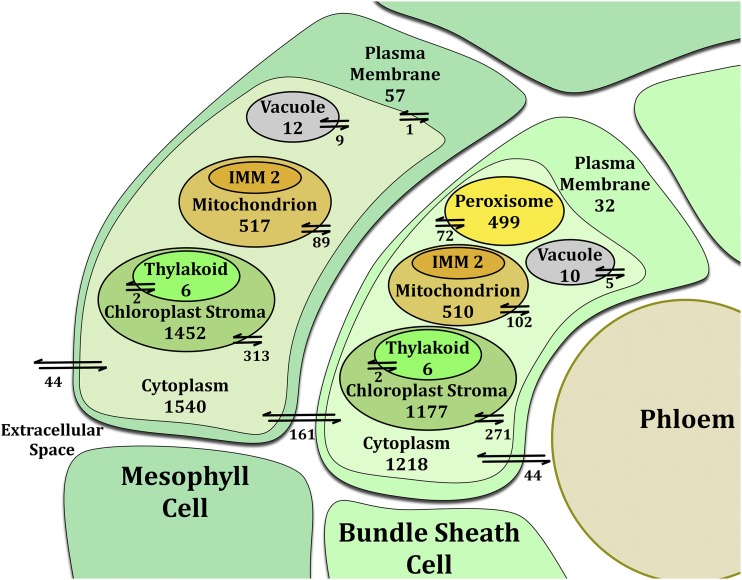
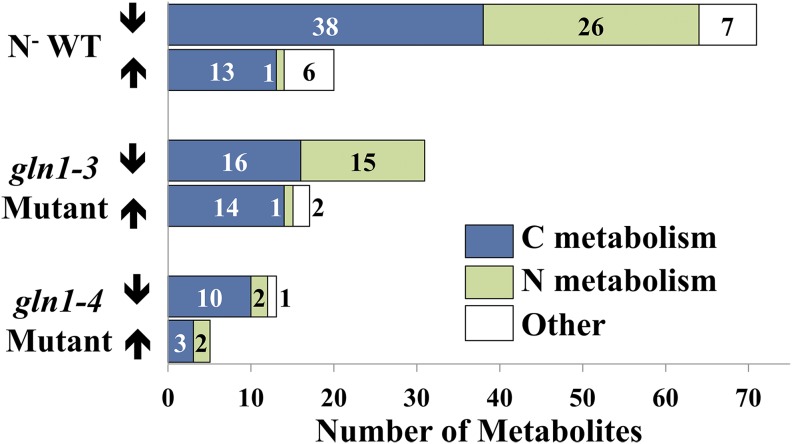
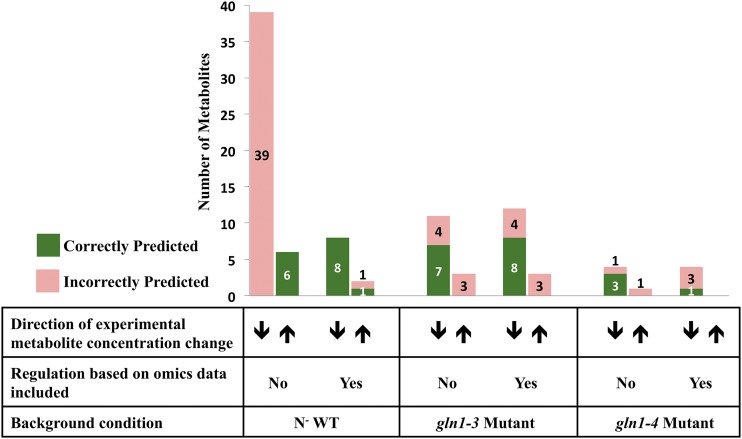
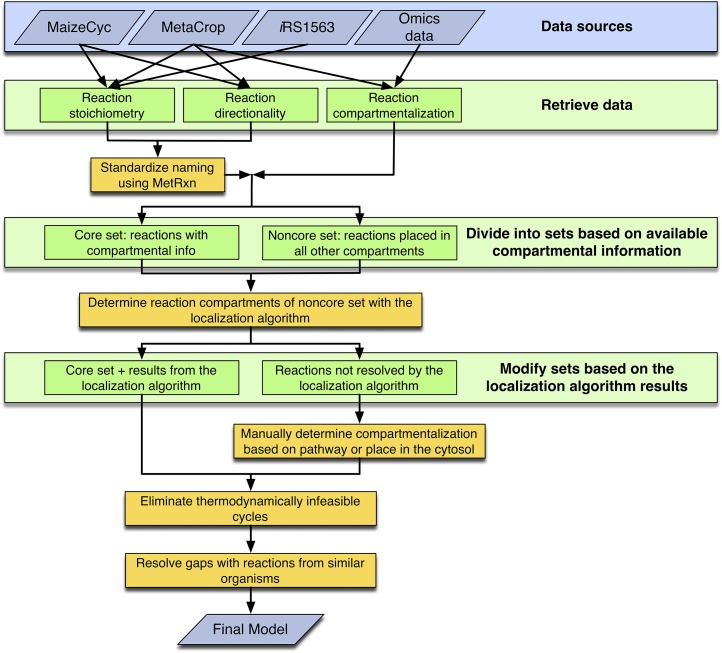
Maize (Zea mays) is an important C4 plant due to its widespread use as a cereal and energy crop. A second-generation genome-scale metabolic model for the maize leaf was created to capture C4 carbon fixation and investigate nitrogen (N) assimilation by modeling the interactions between the bundle sheath and mesophyll cells. The model contains gene-protein-reaction relationships, elemental and charge-balanced reactions, and incorporates experimental evidence pertaining to the biomass composition, compartmentalization, and flux constraints. Condition-specific biomass descriptions were introduced that account for amino acids, fatty acids, soluble sugars, proteins, chlorophyll, lignocellulose, and nucleic acids as experimentally measured biomass constituents. Compartmentalization of the model is based on proteomic/transcriptomic data and literature evidence. With the incorporation of information from the MetaCrop and MaizeCyc databases, this updated model spans 5,824 genes, 8,525 reactions, and 9,153 metabolites, an increase of approximately 4 times the size of the earlier iRS1563 model. Transcriptomic and proteomic data have also been used to introduce regulatory constraints in the model to simulate an N-limited condition and mutants deficient in glutamine synthetase, gln1-3 and gln1-4. Model-predicted results achieved 90% accuracy when comparing the wild type grown under an N-complete condition with the wild type grown under an N-deficient condition.


Figures

Figure 1.
Figure 1.
Weight percentage of biomass components. The weight percentage for each class of metabolites experimentally measured contributing to biomass synthesis is displayed. The composition is displayed for the N+ WT (A), N WT (B), gln1-3 mutant (C), and gln1-4 mutant (D) conditions. The measurements for specific components within each class of metabolites are shown in Supplemental Table S1. [See online article for color version of this figure.]
Figure 2.
Figure 2.
Number of metabolic and transport reactions distributed between compartments in the bundle sheath and mesophyll cell types. The numbers of metabolic and transport reactions are shown for each compartment. Integral membrane proteins are counted for the compartment in which the main biotransformation occurs. For example, the ATP synthase associated with the mitochondrial electron transport chain is counted as a metabolic reaction in the mitochondrion, not the inner mitochondrial membrane (IMM). [See online article for color version of this figure.]
Figure 3.
Figure 3.
Number of metabolites in each condition that statistically varied from the N+ WT condition at the vegetative stage. The numbers of metabolites that experimentally significantly increased (up arrows) or decreased (down arrows) in comparison with the N+ WT condition are displayed for each of the N conditions tested (i.e. N WT, gln1-3 mutant, and gln1-4 mutant conditions). The metabolites are shaded based on whether they are involved in carbon (C), N, or other metabolism. [See online article for color version of this figure.]
Figure 4.
Figure 4.
Effect of omics-based regulation on the flux-sum prediction compared with the experimental trend in metabolite concentration. The accuracy in predicting the increasing (up arrows) or decreasing (down arrows) trend in metabolite change between the N background condition and the N+ WT condition is displayed. By restricting the reaction flux based on the transcriptomic and proteomic data, the accuracy of the qualitative trend in metabolite pool size between the N WT and N+ WT conditions increases. Before adding omics-based constraints, the model was able to correctly predict the direction of change in 13% of the metabolites measured in the N WT condition compared with the N+ WT condition. The accuracy increases to 90% when omics-based constraints are included. The flux-sum method is not able to accurately represent the gln1-3 and gln1-4 mutant conditions, suggesting that the genetic background affects the ability of the flux-sum method to predict metabolite changes. [See online article for color version of this figure.]
Figure 5.
Figure 5.
Model development and curation schematic. The work flow for the second-generation genome-scale metabolic model of the maize leaf is displayed. The data sources give three types of retrieved data (i.e. raw reaction data, reaction directionality, and compartmentalization) that are then manipulated as shown to create the final model. [See online article for color version of this figure.]

References

    1. Alberte RS, Thornber JP. (1977) Water stress effects on the content and organization of chlorophyll in mesophyll and bundle sheath chloroplasts of maize. Plant Physiol 59: 351–353 - PMC - PubMed
    1. Amiour N, Imbaud S, Clément G, Agier N, Zivy M, Valot B, Balliau T, Armengaud P, Quilleré I, Cañas R, et al. (2012) The use of metabolomics integrated with transcriptomic and proteomic studies for identifying key steps involved in the control of nitrogen metabolism in crops such as maize. J Exp Bot 63: 5017–5033 - PubMed
    1. Amiour N, Imbaud S, Clément G, Agier N, Zivy M, Valot B, Balliau B, Quilleré I, Tercé-Laforgue T, Dargel-Graffin C, et al. (2014) An integrated “omics” approach to the characterization of maize (Zea mays L.) mutants deficient in the expression of two genes encoding cytosolic glutamine synthetase. BMC Genomics (in press) - PMC - PubMed
    1. Andrews M, Lea PJ. (2013) Our nitrogen ‘footprint’: the need for increased crop nitrogen use efficiency. Ann Appl Biol 163: 165–169
    1. Andrews M, Raven JA, Lea PJ. (2013) Do plants need nitrate? The mechanisms by which nitrogen form affects plants. Ann Appl Biol 163: 174–199

Publication types

LinkOut - more resources