

doi: 10.1039/c4cc06165a.
The coaction of tonic and phasic dopamine dynamics
Affiliations
- PMID: 25249291
- PMCID: PMC4825181
- DOI: 10.1039/c4cc06165a
Item in Clipboard
The coaction of tonic and phasic dopamine dynamics
Chem Commun (Camb).
.
Abstract
Tonic neurochemical dopamine activity underlies many brain functions; however a consensus on this important concentration has not yet been reached. In this work, we introduce in vivo fast-scan controlled-adsorption voltammetry to report tonic dopamine concentrations (90 ± 9 nM) and the dopamine diffusion coefficient (1.05 ± 0.09 × 10(-6) cm(2) s(-1)) in the mouse brain.
Figures
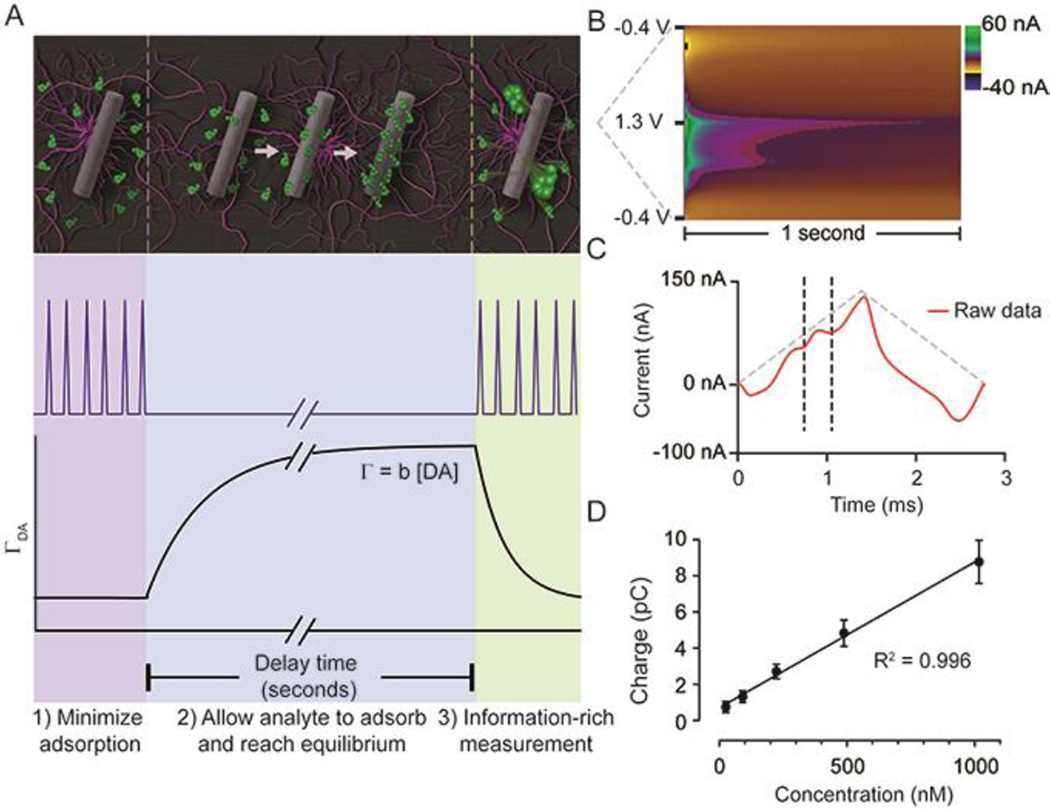
FSCAV was carried out in 3 steps (A): 1) The waveform was applied every 10 ms which minimizes dopamine adsorption to the electrode. 2) The potential was held at −0.4 V for 10 seconds to allow dopamine to adsorb to the electrode and reach equilibrium. 3) The waveform was reapplied, and the adsorbed dopamine was measured. Surface-accumulated dopamine (ΓDA) is proportional to the tonic concentration [DA] by the strength of adsorption (b). (B) Resultant color plot from step 3, with voltage on the ordinate, time on the abscissa, and current displayed using false colors. (D) Representative current trace (red) taken 10 ms after the beginning of step 3. The vertical dashed lines show the bounds for integration to quantify adsorbed dopamine. The grey-dashed triangles illustrate the voltage waveform applied. (D) A calibration plot obtained by FSCAV post implantation (R2 = 0.996, slope = 0.0078 ± 0.0002 pC/nM (n = 7 electrodes), which when accounting for electrode area and equivalents transferred, corresponds to b = 0.0037 ± 0.0002 cm.
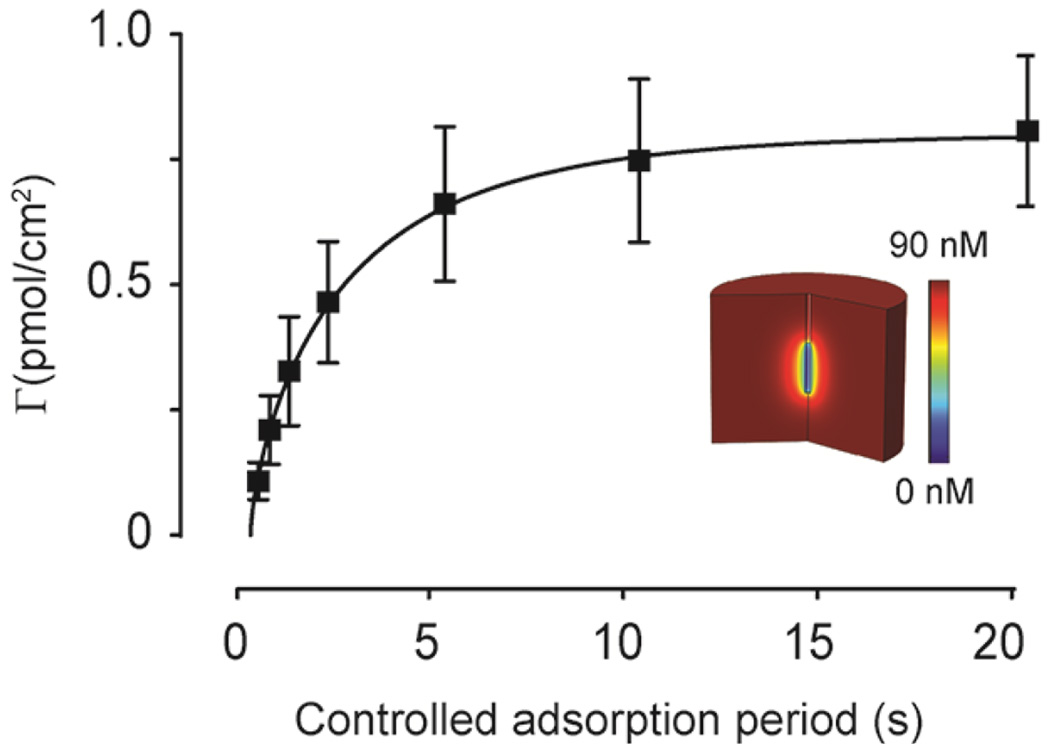
FSCAV is used to determine the diffusion coefficient of endogenous dopamine in vivo. The controlled adsorption period is varied and the amount of adsorbed dopamine vs. time is plotted (n = 4 mice). Using a finite-difference simulation (inset), the data is fit (red line), and a diffusion coefficient is determined (1.05 ± 0.09 × 10⁻⁶ cm2/s).
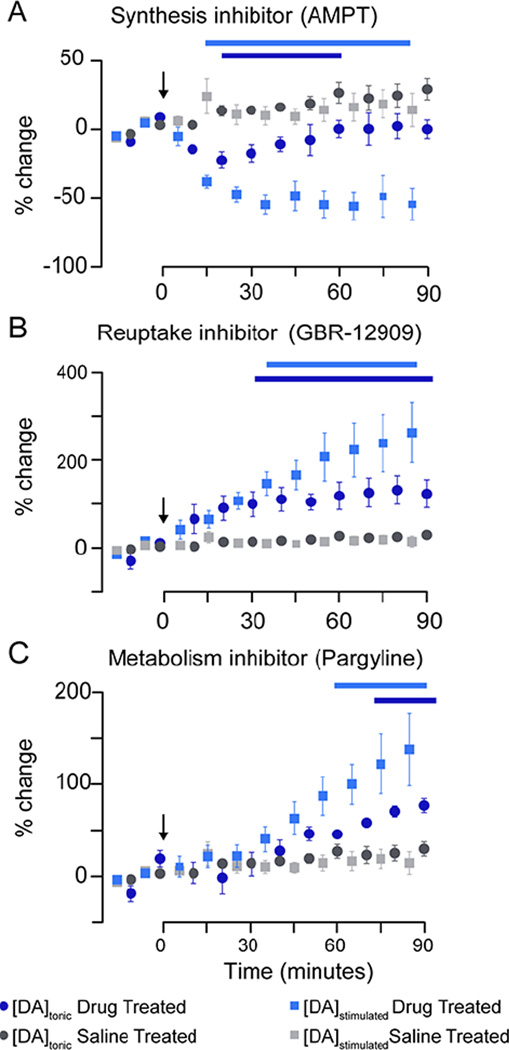
Pharmacological effects on tonic dopamine concentrations and electrically evoked dopamine release. Changes in stimulated release and tonic concentration are plotted as the percent change from baseline vs. time. Measurements began 30 minutes prior to drug administration starting with tonic measurements alternated with stimulated release measurements (every 5 minutes). The changes in electrically evoked dopamine release (blue squares) and the tonic concentration (blue circles) of dopamine in response to (A) AMPT (250 mg/kg, i.p.), (B) GBR-12909 (10 mg/kg, i.p.), and (C) pargyline (75 mg/kg, i.p.) are shown (n = 5 mice, each group). Each plot contains the saline controls (gray). Bars above plot indicate significant differences when compared to saline controls (p < 0.05)
References
Publication types
MeSH terms
Substances
Grants and funding
LinkOut - more resources
Full Text Sources
Other Literature Sources