. 2015 Oct;25(10):3654-72.
doi: 10.1093/cercor/bhu217. Epub 2014 Sep 23.

Functional Specialization and Flexibility in Human Association Cortex

Affiliations

Functional Specialization and Flexibility in Human Association Cortex

B T Thomas Yeo et al. Cereb Cortex. 2015 Oct.

Erratum in

Abstract

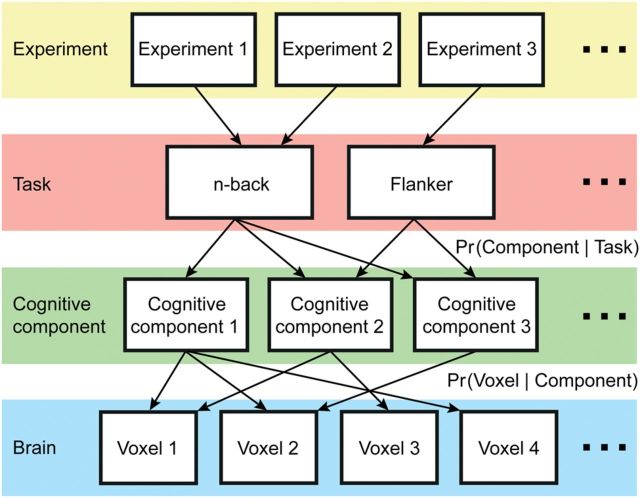
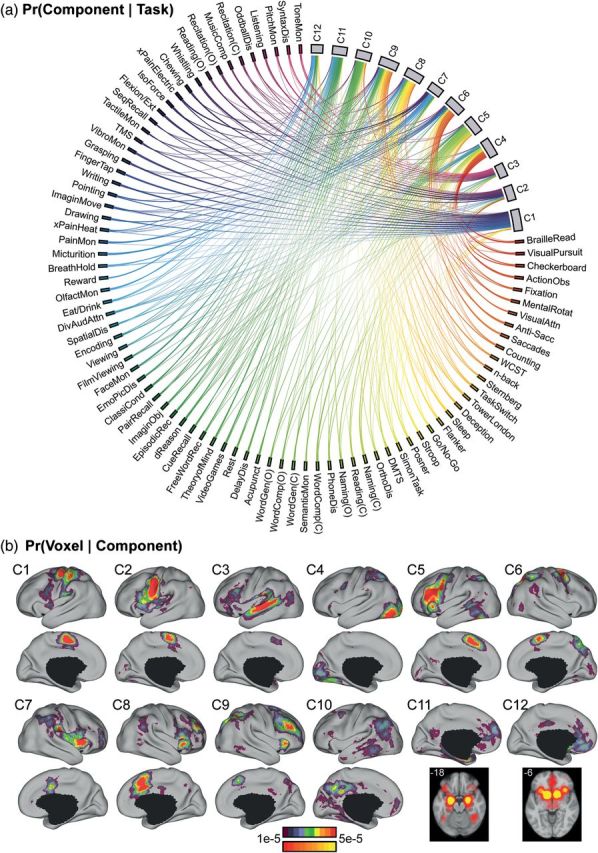
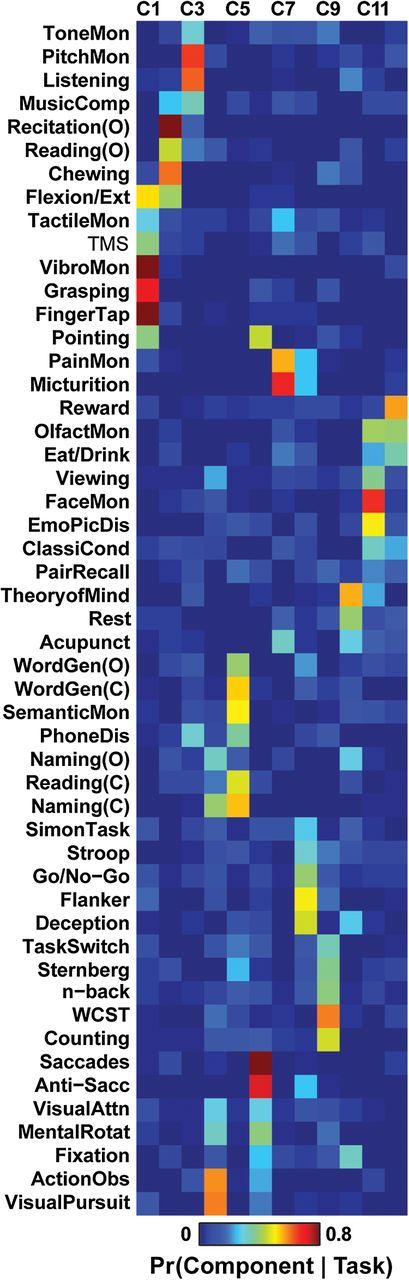
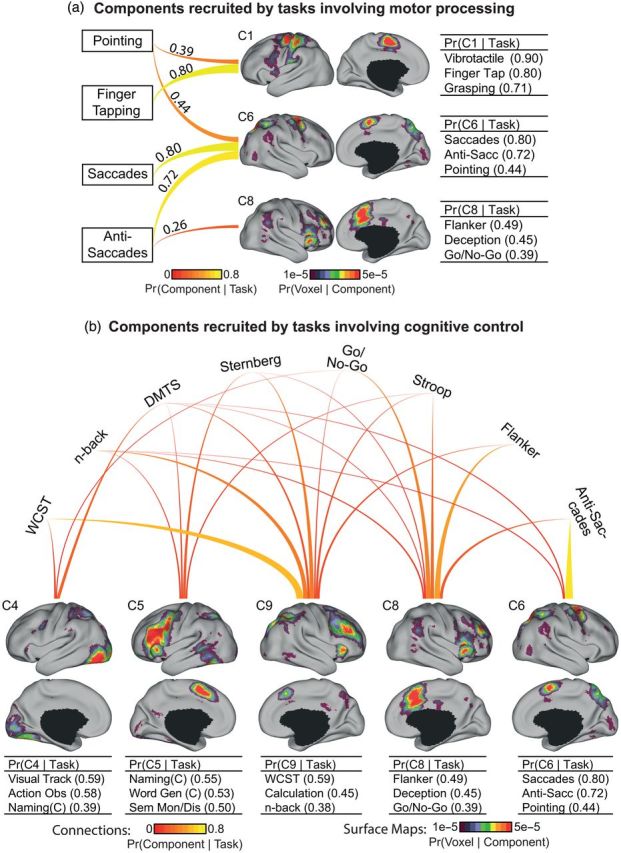
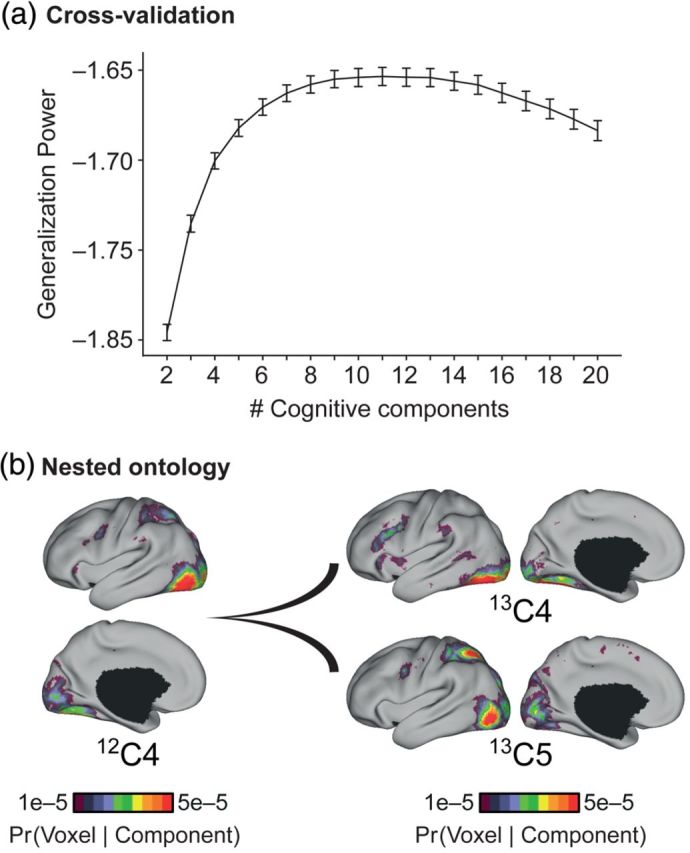
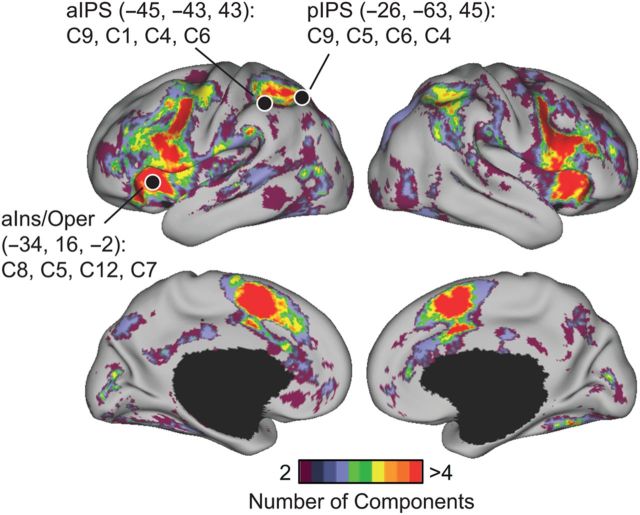
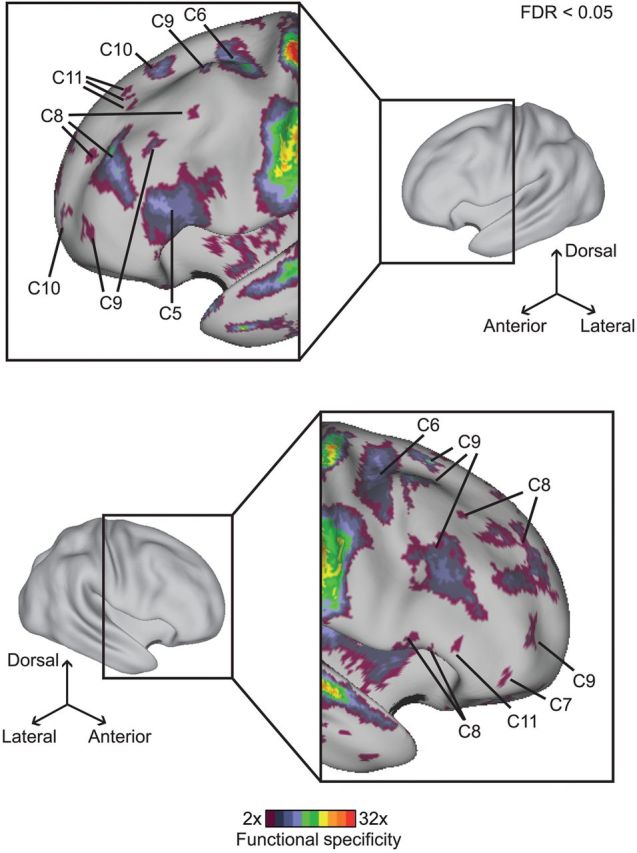
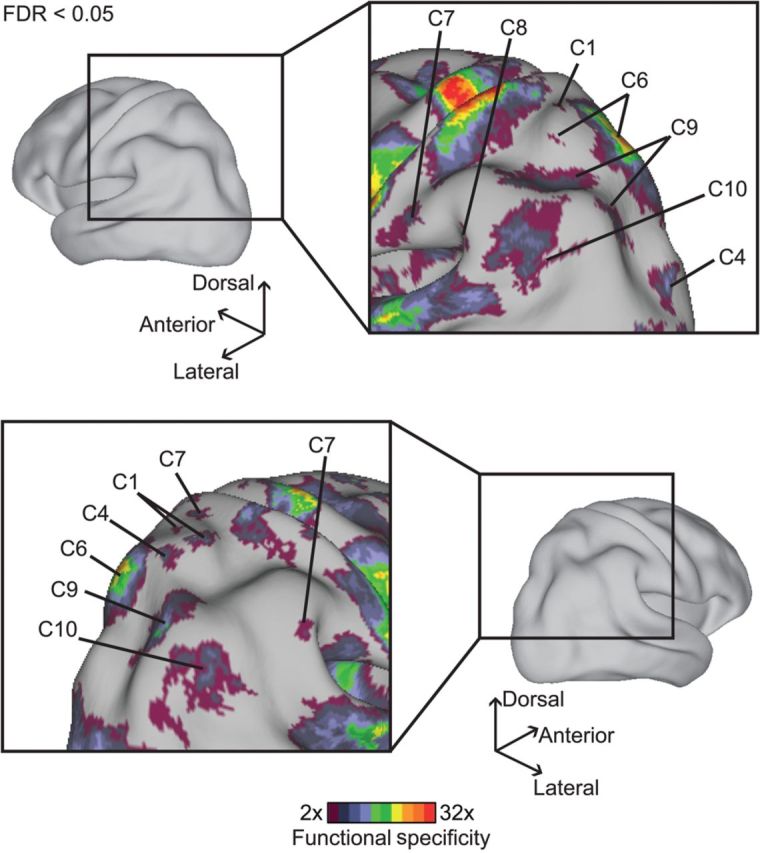
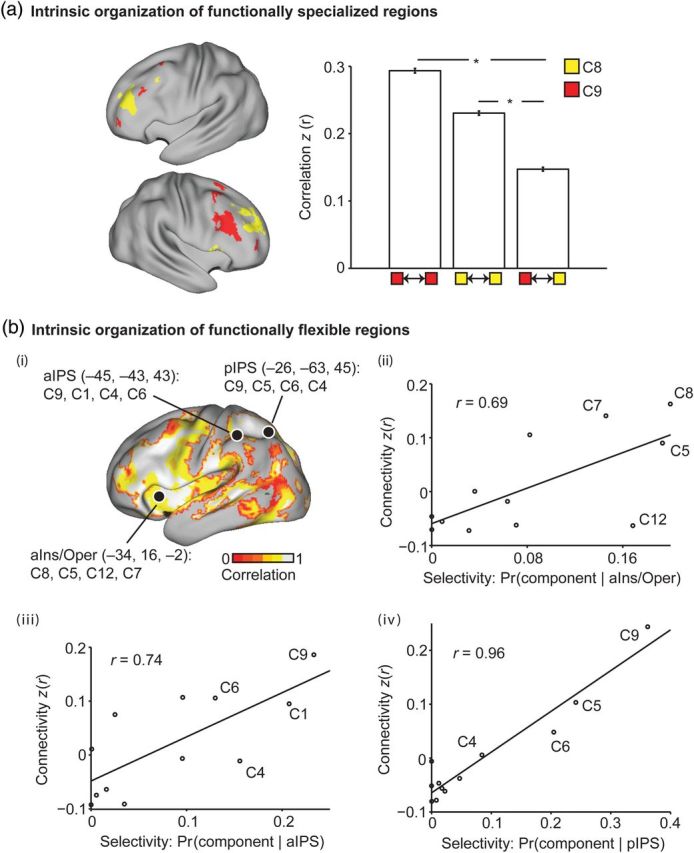
The association cortex supports cognitive functions enabling flexible behavior. Here, we explored the organization of human association cortex by mathematically formalizing the notion that a behavioral task engages multiple cognitive components, which are in turn supported by multiple overlapping brain regions. Application of the model to a large data set of neuroimaging experiments (N = 10 449) identified complex zones of frontal and parietal regions that ranged from being highly specialized to highly flexible. The network organization of the specialized and flexible regions was explored with an independent resting-state fMRI data set (N = 1000). Cortical regions specialized for the same components were strongly coupled, suggesting that components function as partially isolated networks. Functionally flexible regions participated in multiple components to different degrees. This heterogeneous selectivity was predicted by the connectivity between flexible and specialized regions. Functionally flexible regions might support binding or integrating specialized brain networks that, in turn, contribute to the ability to execute multiple and varied tasks.

Keywords: cognitive ontology; functional connectivity; meta-analysis; parietal cortex; prefrontal cortex.


Figures

Figure 1.
Figure 1.
Relationships among experiments, tasks, cognitive components, and brain regions. Underpinning our approach is the premise that performing any given task often engages not one but several cognitive components that are in turn supported by multiple brain regions (Walton and Paul 1901; Posner et al. 1988; Mesulam 1990; Poldrack 2006). Different tasks might engage common and distinct cognitive components. Furthermore, different components may activate common and distinct brain regions. Here, we demonstrated that the framework can be instantiated with a formal mathematical model (Rosen-Zvi et al. 2010), whose parameters can be estimated. The estimated model parameters are the probability that a task would recruit a cognitive component for an activation focus (i.e., Pr(component | task)) and the probability a cognitive component would activate a brain voxel for an activation focus (i.e., Pr(voxel | component)). The model parameters enabled us to derive quantitative maps of functional specialization and flexibility across the cerebral cortex. Here, the term “cognitive component” is operationally defined as latent variables within the mathematical model (Supplementary Fig. 1).
Figure 2.
Figure 2.
12-component model estimates. (a) Probability of tasks recruiting different components (i.e., Pr(component | task)). The components, C1 to C12, lie on the top right. The 83 tasks lie in the remaining segments of the circle. Each line connects 1 task with 1 cognitive component. The thickness of the lines is proportional to the magnitude of Pr(component | task). For the purpose of visualization, tasks with similar Pr(component | task) are more closely positioned and their lines were assigned similar colors. Only lines corresponding to Pr(component | task) > 1/12 are shown. (b) Probability of components activating different brain voxels (i.e., Pr(voxel | component)). The cerebral hemisphere with the stronger activation is shown, although most components have high probabilities of bilateral activation. An exception is component C5, which has high probability of activating the left, but not the right, cerebral cortex. Many components, especially C11 and C12, activate subcortical regions. Component C7 had high probability of activating the brainstem (Supplementary Fig. 2). The top color bar is utilized for the surface-based visualization of Pr(voxel | component), whereas the bottom color bar is utilized for the volumetric slices highlighting subcortical structures shown for components C11 and C12. Additional slices highlighting subcortical structures are found in Supplementary Figure 2. (C) indicates “covert” and (O) indicates “overt”. An interactive version of the model estimates and the unthresholded estimates for 10-component to 14-component estimates are available: https://surfer.nmr.mgh.harvard.edu/fswiki/BrainmapOntology_Yeo2015, last accessed September 12, 2014.
Figure 3.
Figure 3.
Alternative visualization of the probability of tasks recruiting different components Pr(component | task). For the purpose of visualization, tasks with similar Pr(component | task) are more closely positioned. Due to space constraints, only 51 tasks are shown (see Methods). (C) = Covert; (O) =Overt.
Figure 4.
Figure 4.
Shared and divergent components of tasks involving motor processing or cognitive control. (a) Shared and divergent components of tasks involving motor processing. The 4 motor-related tasks have high probability of recruiting components C1, C6, and C8. Each line connects 1 task with 1 component. The thickness and brightness of the lines are proportional to the magnitude of Pr(component | task). The 3 tasks most likely to recruit these components are shown on the right. The numbers in the brackets correspond to Pr(component | task); the numbers can add up to >1 because we are showing Pr(component | task) and not Pr(task | component). The “Pointing” task recruited components C1 and C6. The “Anti-Saccade” task recruited components C6 and C8. (b) Shared and divergent components of tasks involving cognitive control. Format follows (a). The 8 cognitive control tasks have high probability of recruiting components C4, C5, C9, C8, and C6. Components C8 and C9 were the most heavily recruited components. Wisconsin Card Sorting Test (WCST), n-back, Delayed Match-to-Sample (DMTS), and Sternberg preferentially recruited component C9, whereas Go/No-Go, Stroop, and Flanker preferentially recruited component C8.
Figure 5.
Figure 5.
Number of cognitive components. (a) Generalization power plotted as a function of the number of estimated cognitive components. Generalization power is flat from 8 to 14 components. (b) Illustration of the division of visual component into dorsal and ventral visual streams as the number of estimated components was increased from 12 to 13. Here, component 12C4 had high likelihood of activating occipital, superior parietal, and inferior temporal cortices. In contrast, component 13C4 had high likelihood of activating occipital and inferior temporal cortices, whereas component 13C5 had high likelihood of activating occipital and superior parietal cortices. The average of the Pr(voxel | component 13C4) and Pr(voxel | component 13C5) is strongly correlated with Pr(voxel | component 12C4) (see Supplementary Fig. 4), suggesting that the 13-component estimate arises from the subdivision of component 12C4 into components 13C4 and 13C5. This “nested ontology” phenomenon was observed for the flat part of the generalization power curve and in fact beyond it from 6 to 16 components. The flat generalization power and nested ontology suggest that estimates with different number of cognitive components might provide distinct insights into the organization of cognitive components. See Supplementary Figure 4 for quantification of the nested ontology. Supplementary Figure 5 and Table 1 illustrate other component fractionations.
Figure 6.
Figure 6.
Functional heterogeneity within functionally flexible regions. The figure shows cortical regions participating in multiple cognitive components of the 12-component estimate. Functionally flexible regions were mostly located in the frontal and parietal lobes. These functionally flexible regions are functionally heterogeneous. For example, the top 4 components activating an anterior insula/operculum (aIns/Oper) region (−34, 16, −2) were C8, C5, C12, and C7, with corresponding Pr(component | aIns/Oper) equal to 0.20, 0.19, 0.17, and 0.15, respectively. In contrast, the top 4 components activating an aIPS region (−45, −43, 43) were C9, C1, C4, and C6, with corresponding Pr(component | aIPS) equal to 0.23, 0.21, 0.16, and 0.13, respectively. There was heterogeneity even within a functionally flexible zone, for instance across the IPS. For example, in contrast to aIPS, the top 4 components activating a pIPS region (−26, −63, 45) were C9, C5, C6, and C4, with corresponding Pr(component | pIPS) equal to 0.36, 0.24, 0.20, and 0.08, respectively. The Desikan–Killiany atlas (Desikan et al. 2006) was used to guide the labeling of the regions aIns/Oper, aIPS, and pIPS.
Figure 7.
Figure 7.
Functional specificity in lateral frontal cortex for the 12-component estimate. A functional specificity value of 2 at a vertex implies that for an activated vertex, the top component would be twice as likely as the second most likely component to be recruited. Therefore, a functional specificity of 2 suggests at least some degree of functional specialization. Only regions with statistically significant (corrected for multiple comparison for entire cerebral cortex, FDR q < 0.05) functional specificity of at least 2 are shown. The somato-motor cortex exhibited higher functional specificity than the lateral frontal cortex. Nevertheless, 7 components exhibited significant specificity, demonstrating functional segregation in lateral frontal cortex. Note that the color scale is logarithmic.
Figure 8.
Figure 8.
Functional specificity in lateral parietal cortex for the 12-component estimate. Format follows Figure 7. The somato-motor and auditory cortices exhibited higher functional specificity than the lateral parietal cortex. Nevertheless, 7 components exhibited significant specificity, demonstrating functional segregation in lateral parietal cortex.
Figure 9.
Figure 9.
Intrinsic organization of functionally specialized and flexible regions. (a) Regions specialized for the same cognitive components are strongly connected. Yellow regions correspond to lateral frontal zones specialized for component C8. Red regions correspond to lateral frontal zones specialized for component C9. Functional coupling among lateral frontal zones specialized for component C8 was stronger than their coupling with zones specialized for component C9 (P < 1e − 184). Similarly, functional coupling among lateral frontal zones specialized for component C9 was stronger than their coupling with zones specialized for components C8 (P < 1e − 75). Therefore, components function as isolated specialized networks. Asterisks indicate the statistical tests performed. (b) Connectivity patterns of functionally flexible regions are correlated with their selectivity for cognitive components. (bi) The colored regions are functionally flexible for at least 2 components (c.f. Fig. 6). The overlay corresponds to the correlation between the selectivity (Pr(component | functionally flexible region)) and the functional connectivity of the functionally flexible region and specialized regions of individual components. Average correlation across all functionally flexible regions = 0.75 (P ≈ 0). The high positive values suggest that a functionally flexible region with high likelihood of being activated by component X tends to have stronger connectivity with regions specialized for component X. (bii–iv) Example scatterplots for the 3 functionally flexible regions from Figure 6: (bii) aIns/Oper, (biii) aIPS, and (biv) pIPS. Therefore, the connectivity patterns of functionally flexible regions were consistent with their selectivity to individual cognitive components. Flexible regions might integrate information from isolated specialized networks.

References

    1. Aron AR, Robbins TW, Poldrack RA. 2004. Inhibition and the right inferior frontal cortex. Trends Cogn Sci. 8:170–177. - PubMed
    1. Badre D, D'Esposito M. 2009. Is the rostro-caudal axis of the frontal lobe hierarchical? Nat Rev Neurosci. 10:659–669. - PMC - PubMed
    1. Badre D, Poldrack RA, Paré-Blagoev EJ, Insler RZ, Wagner AD. 2005. Dissociable controlled retrieval and generalized selection mechanisms in ventrolateral prefrontal cortex. Neuron. 47:907–918. - PubMed
    1. Bassett DS, Wymbs NF, Rombach MP, Porter MA, Mucha PJ, Grafton ST. 2013. Task-based core-periphery organization of human brain dynamics. PLoS Comp Biol. 9:e1003171. - PMC - PubMed
    1. Bechtel W. 2002. Decomposing the mind-brain: a long-term pursuit. Brain Mind. 3:229–242.

Publication types