

Activation of EGFR, HER2 and HER3 by neurotensin/neurotensin receptor 1 renders breast tumors aggressive yet highly responsive to lapatinib and metformin in mice
- PMID: 25249538
- PMCID: PMC4226680
- DOI: 10.18632/oncotarget.1632
Activation of EGFR, HER2 and HER3 by neurotensin/neurotensin receptor 1 renders breast tumors aggressive yet highly responsive to lapatinib and metformin in mice
Abstract
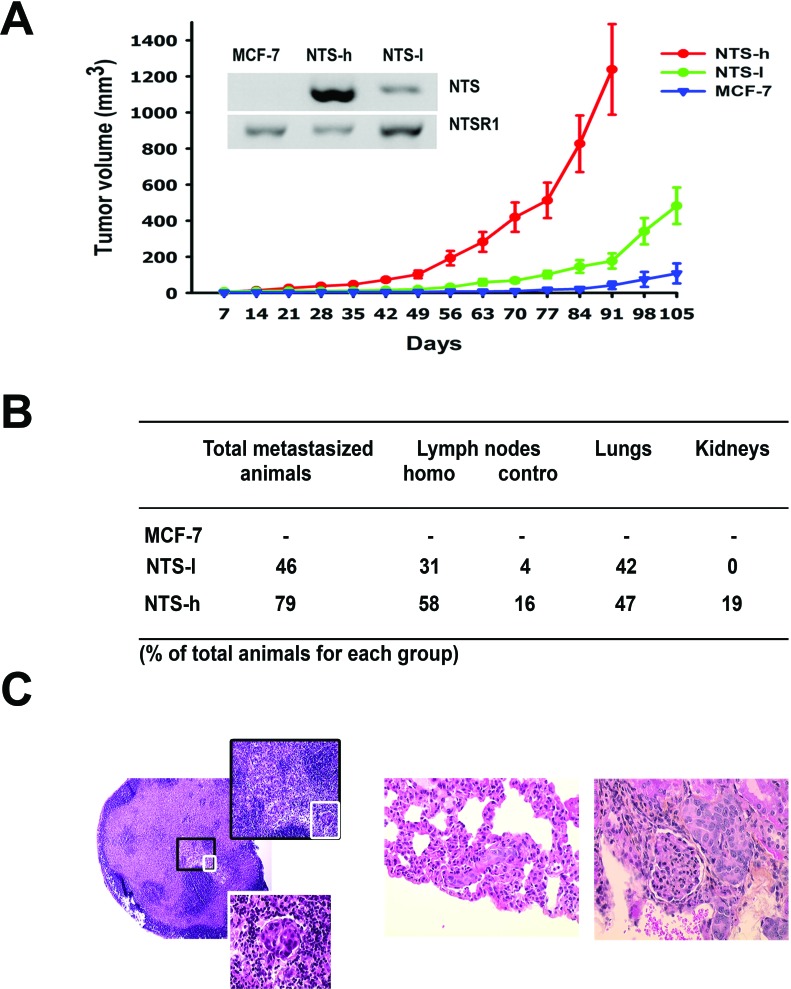
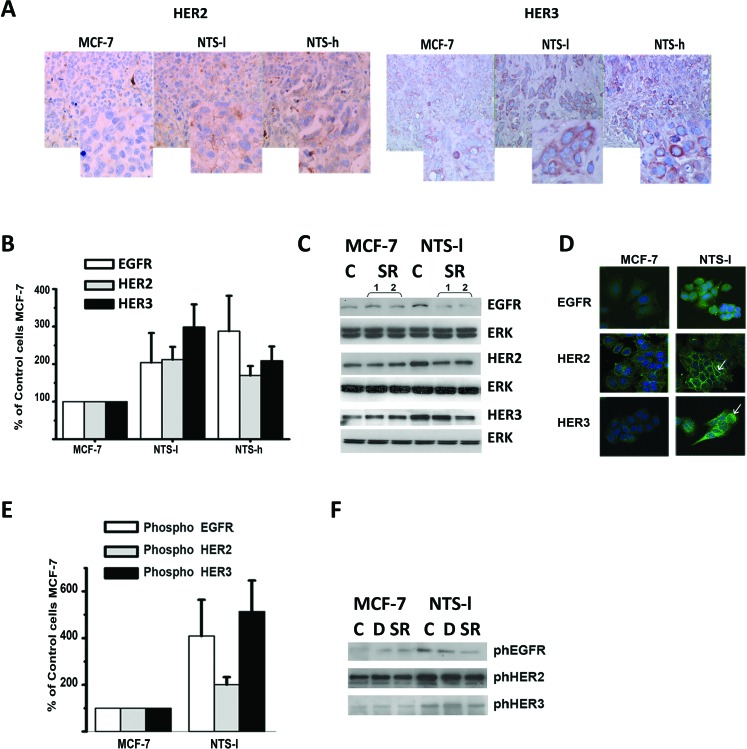
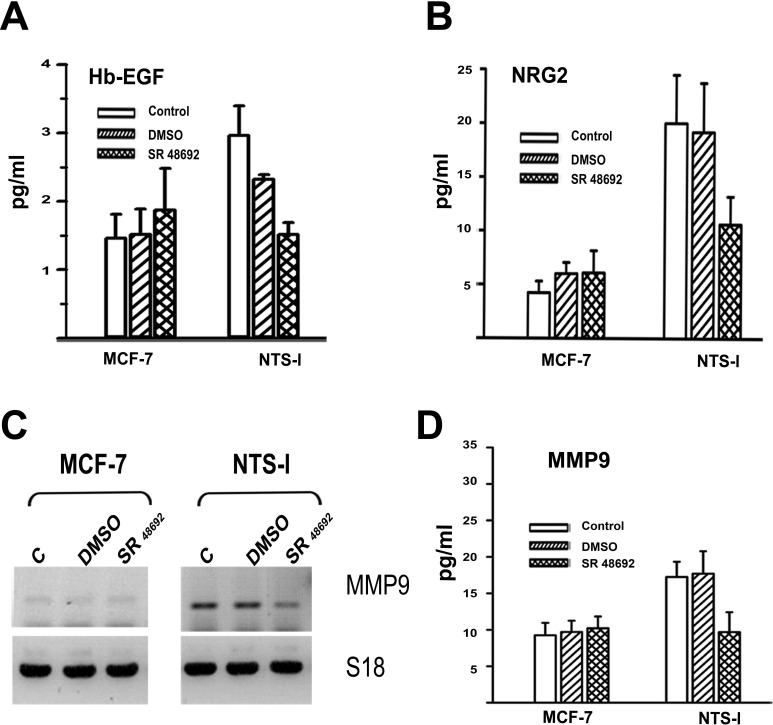
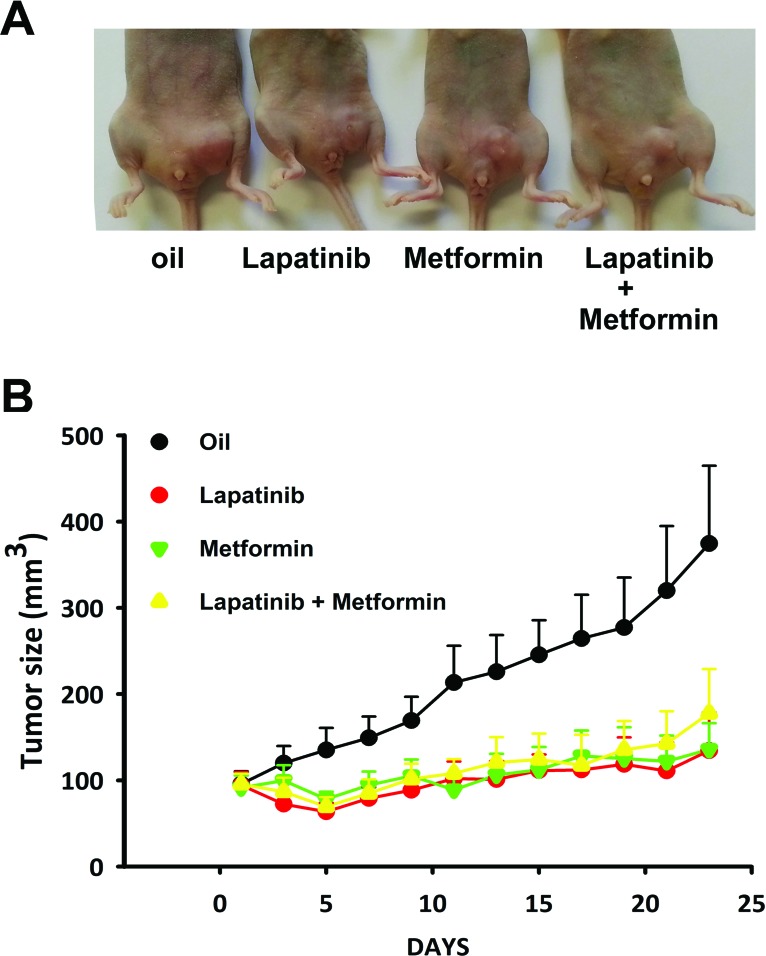
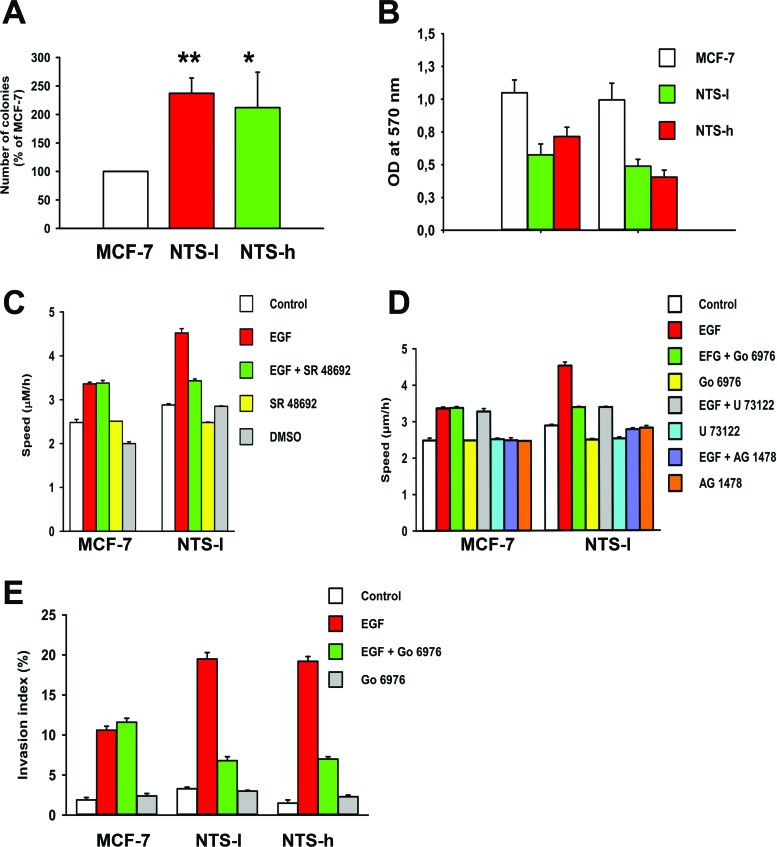
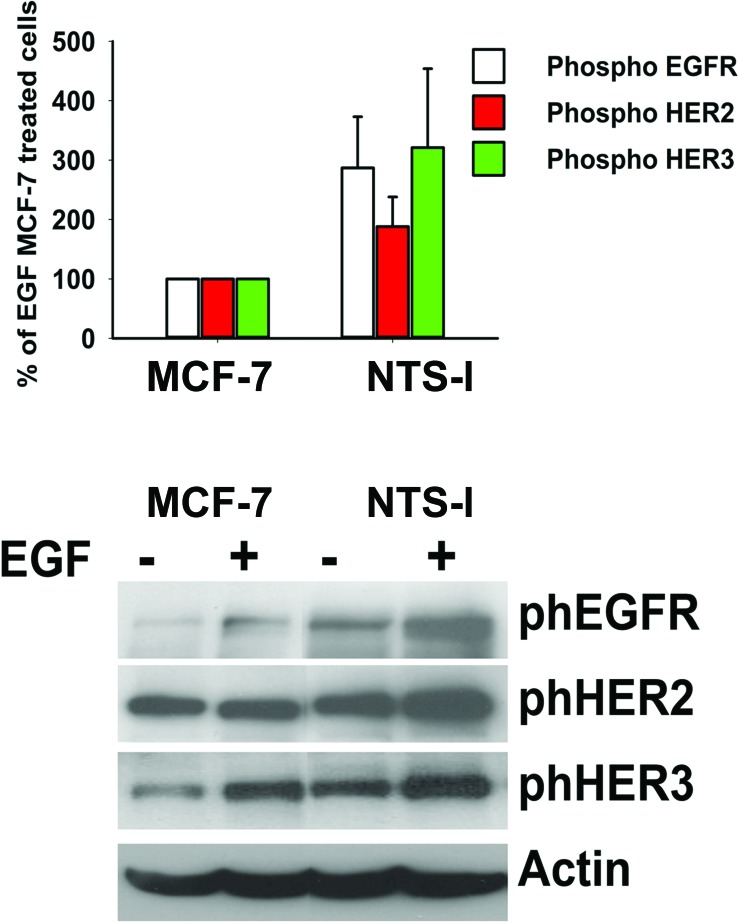
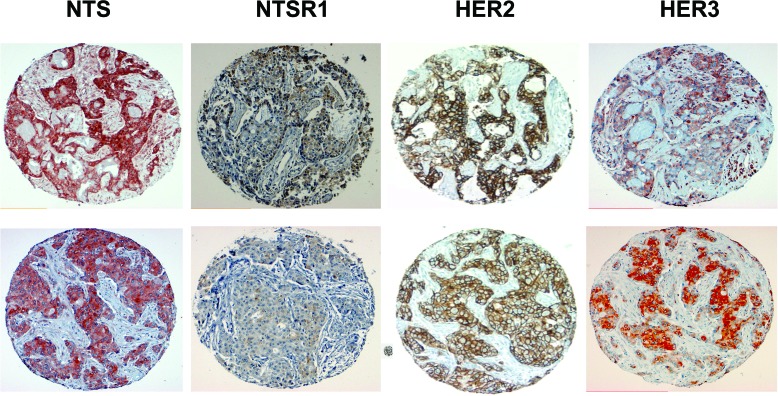
A present challenge in breast oncology research is to identify therapeutical targets which could impact tumor progression. Neurotensin (NTS) and its high affinity receptor (NTSR1) are up regulated in 20% of breast cancers, and NTSR1 overexpression was shown to predict a poor prognosis for 5 year overall survival in invasive breast carcinomas. Interactions between NTS and NTSR1 induce pro-oncogenic biological effects associated with neoplastic processes and tumor progression. Here, we depict the cellular mechanisms activated by NTS, and contributing to breast cancer cell aggressiveness. We show that neurotensin (NTS) and its high affinity receptor (NTSR1) contribute to the enhancement of experimental tumor growth and metastasis emergence in an experimental mice model. This effect ensued following EGFR, HER2, and HER3 over-expression and autocrine activation and was associated with an increase of metalloproteinase MMP9, HB-EGF and Neuregulin 2 in the culture media. EGFR over expression ensued in a more intense response to EGF on cellular migration and invasion. Accordingly, lapatinib, an EGFR/HER2 tyrosine kinase inhibitor, as well as metformin, reduced the tumor growth of cells overexpressing NTS and NTSR1. All cellular effects, such as adherence, migration, invasion, altered by NTS/NTSR1 were abolished by a specific NTSR1 antagonist. A strong statistical correlation between NTS-NTSR1-and HER3 (p< 0.0001) as well as NTS-NTSR1-and HER3- HER2 (p< 0.001) expression was found in human breast tumors. Expression of NTS/NTSR1 on breast tumoral cells creates a cellular context associated with cancer aggressiveness by enhancing epidermal growth factor receptor activity. We propose the use of labeled NTS/NTSR1 complexes to enlarge the population eligible for therapy targeting HERs tyrosine kinase inhibitor or HER2 overexpression.
Figures
Similar articles
-
Neurotensin (NTS) and its receptor (NTSR1) causes EGFR, HER2 and HER3 over-expression and their autocrine/paracrine activation in lung tumors, confirming responsiveness to erlotinib.Oncotarget. 2014 Sep 30;5(18):8252-69. doi: 10.18632/oncotarget.1633. Oncotarget. 2014. PMID: 25249545 Free PMC article.
-
Adding of neurotensin to non-small cell lung cancer cells increases tyrosine phosphorylation of HER3.Peptides. 2022 Oct;156:170858. doi: 10.1016/j.peptides.2022.170858. Epub 2022 Aug 3. Peptides. 2022. PMID: 35932909 Free PMC article.
-
An heregulin-EGFR-HER3 autocrine signaling axis can mediate acquired lapatinib resistance in HER2+ breast cancer models.Breast Cancer Res. 2013;15(5):R85. doi: 10.1186/bcr3480. Breast Cancer Res. 2013. PMID: 24044505 Free PMC article.
-
The potential use of the neurotensin high affinity receptor 1 as a biomarker for cancer progression and as a component of personalized medicine in selective cancers.Biochimie. 2011 Sep;93(9):1369-78. doi: 10.1016/j.biochi.2011.04.024. Epub 2011 May 17. Biochimie. 2011. PMID: 21605619 Review.
-
Function and mechanism of neurotensin (NTS) and its receptor 1 (NTSR1) in occurrence and development of tumors.Zhongguo Zhong Yao Za Zhi. 2015 Jul;40(13):2524-36. Zhongguo Zhong Yao Za Zhi. 2015. PMID: 26697673 Review.
Cited by
-
Golgi phosphoprotein 3 regulates metastasis of prostate cancer via matrix metalloproteinase 9.Int J Clin Exp Pathol. 2015 Apr 1;8(4):3691-700. eCollection 2015. Int J Clin Exp Pathol. 2015. PMID: 26097550 Free PMC article.
-
Neurotensin (NTS) and its receptor (NTSR1) causes EGFR, HER2 and HER3 over-expression and their autocrine/paracrine activation in lung tumors, confirming responsiveness to erlotinib.Oncotarget. 2014 Sep 30;5(18):8252-69. doi: 10.18632/oncotarget.1633. Oncotarget. 2014. PMID: 25249545 Free PMC article.
-
Mismatch repair deficiency predicts response to HER2 blockade in HER2-negative breast cancer.Nat Commun. 2021 May 19;12(1):2940. doi: 10.1038/s41467-021-23271-0. Nat Commun. 2021. PMID: 34011995 Free PMC article.
-
Neurotensin receptor type 2 protects B-cell chronic lymphocytic leukemia cells from apoptosis.Oncogene. 2018 Feb 8;37(6):756-767. doi: 10.1038/onc.2017.365. Epub 2017 Oct 23. Oncogene. 2018. PMID: 29059151 Free PMC article.
-
The role of Neurotensin and its receptors in non-gastrointestinal cancers: a review.Cell Commun Signal. 2020 Apr 26;18(1):68. doi: 10.1186/s12964-020-00569-y. Cell Commun Signal. 2020. PMID: 32336282 Free PMC article. Review.
References
-
- Jemal A, Bray F, Center MM, Ferlay J, Ward E, Forman D. Global cancer statistics. CA Cancer J.Clin. 2011;61:69–90. - PubMed
-
- Siegel R, Naishadham D, Jemal A. Cancer statistics, 2013. CA Cancer J.Clin. 2013;63:11–30. - PubMed
-
- Dean-Colomb W, Esteva FJ. Her2-positive breast cancer: herceptin and beyond. Eur.J.Cancer. 2008;44:2806–2812. - PubMed
-
- Slamon DJ, Clark GM, Wong SG, Levin WJ, Ullrich A, McGuire WL. Human breast cancer: correlation of relapse and survival with amplification of the HER-2/neu oncogene. Science. 1987;235:177–182. - PubMed
-
- Baselga J, Gelmon KA, Verma S, Wardley A, Conte P, Miles D, Bianchi G, Cortes J, McNally VA, Ross GA, Fumoleau P, Gianni L. Phase II trial of pertuzumab and trastuzumab in patients with human epidermal growth factor receptor 2-positive metastatic breast cancer that progressed during prior trastuzumab therapy. J.Clin.Oncol. 2010;28:1138–1144. - PMC - PubMed
Publication types
MeSH terms
Substances
LinkOut - more resources
Full Text Sources
Other Literature Sources
Medical
Research Materials
Miscellaneous
