

Identification and saturable nature of signaling pathways induced by metreleptin in humans: comparative evaluation of in vivo, ex vivo, and in vitro administration
- PMID: 25249580
- PMCID: PMC4338590
- DOI: 10.2337/db14-0625
Identification and saturable nature of signaling pathways induced by metreleptin in humans: comparative evaluation of in vivo, ex vivo, and in vitro administration
Abstract
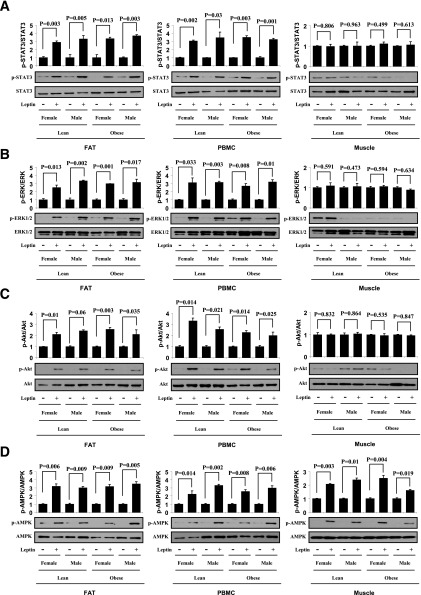
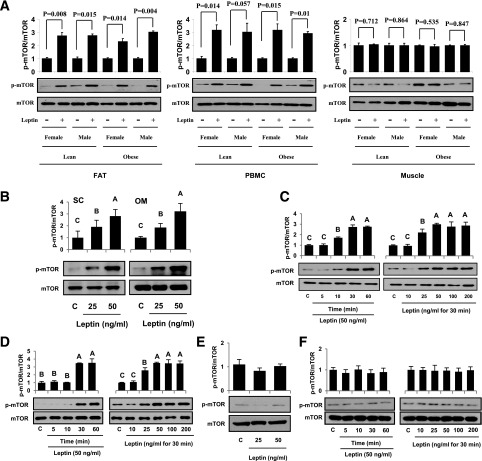
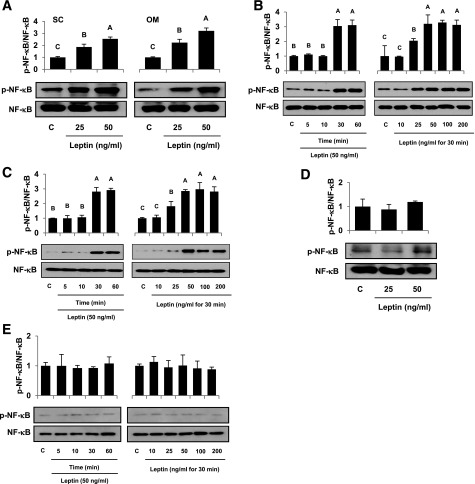
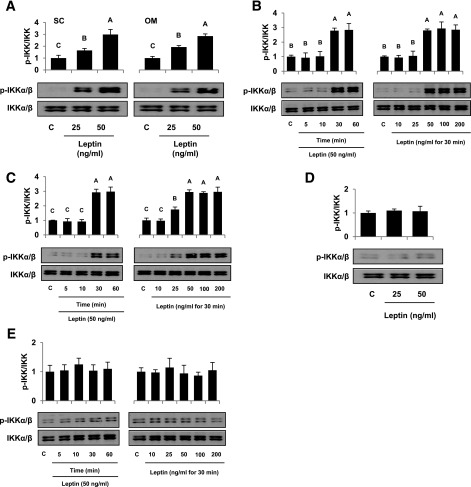
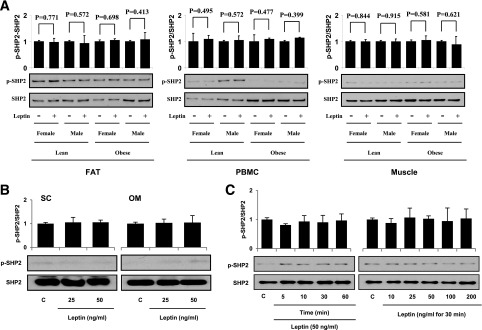
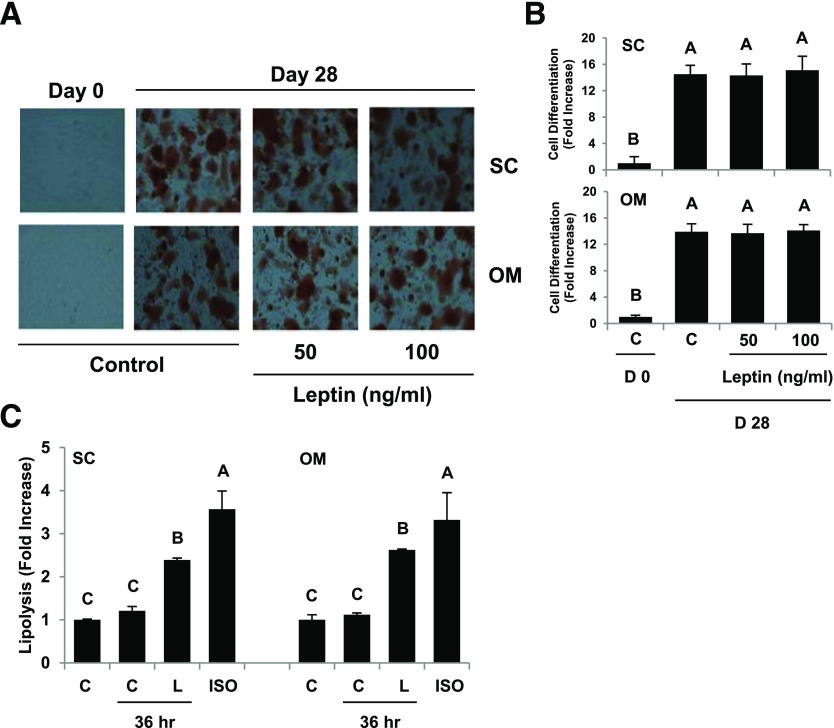
Signaling pathways activated by leptin in metabolically important organs have largely been studied only in animal and/or cell culture studies. In this study, we examined whether leptin has similar effects in human peripheral tissues in vivo, ex vivo, and in vitro and whether the response would be different in lean and obese humans. For in vivo leptin signaling, metreleptin was administered and muscle, adipose tissue, and peripheral blood mononuclear cells were taken for analysis of signal activation. Experiments were also done ex vivo and with primary cultured cells in vitro. The signal activation was compared between male versus female and obese versus lean humans. Acute in vivo, ex vivo, and/or in vitro metreleptin administration similarly activated STAT3, AMPK, ERK1/2, Akt, mTOR, NF-κB, and/or IKKα/β without any differences between male versus female and obese versus lean subjects. All signaling pathways were saturable at ∼30-50 ng/mL, consistent with the clinical evidence showing no additional effect(s) in obese subjects who already have high levels of leptin. Our data provide novel information on downstream effectors of metreleptin action in humans that may have therapeutic implications.
© 2015 by the American Diabetes Association. Readers may use this article as long as the work is properly cited, the use is educational and not for profit, and the work is not altered.
Figures
Similar articles
-
Efficacy of metreleptin in obese patients with type 2 diabetes: cellular and molecular pathways underlying leptin tolerance.Diabetes. 2011 Jun;60(6):1647-56. doi: 10.2337/db10-1791. Diabetes. 2011. PMID: 21617185 Free PMC article. Clinical Trial.
-
Early intracellular signaling events induced by in vitro metreleptin administration in cardiac myocytes and uterine smooth muscle cells.Cell Mol Biol (Noisy-le-grand). 2015 Aug 5;61(4):15-20. Cell Mol Biol (Noisy-le-grand). 2015. PMID: 26255263
-
Leptin and amylin act in an additive manner to activate overlapping signaling pathways in peripheral tissues: in vitro and ex vivo studies in humans.Diabetes Care. 2011 Jan;34(1):132-8. doi: 10.2337/dc10-0518. Epub 2010 Sep 24. Diabetes Care. 2011. PMID: 20870968 Free PMC article.
-
Multihormonal control of ob gene expression and leptin secretion from cultured human visceral adipose tissue: increased responsiveness to glucocorticoids in obesity.J Clin Endocrinol Metab. 1998 Mar;83(3):902-10. doi: 10.1210/jcem.83.3.4644. J Clin Endocrinol Metab. 1998. PMID: 9506746 Review.
-
Metreleptin and generalized lipodystrophy and evolving therapeutic perspectives.Expert Opin Biol Ther. 2015 Jul;15(7):1061-75. doi: 10.1517/14712598.2015.1052789. Expert Opin Biol Ther. 2015. PMID: 26063386 Review.
Cited by
-
The role of leptin in regulating bone metabolism.Metabolism. 2015 Jan;64(1):105-13. doi: 10.1016/j.metabol.2014.10.021. Epub 2014 Oct 25. Metabolism. 2015. PMID: 25497343 Free PMC article. Review.
-
Novel perspectives on leptin in osteoarthritis: Focus on aging.Genes Dis. 2023 Nov 4;11(6):101159. doi: 10.1016/j.gendis.2023.101159. eCollection 2024 Nov. Genes Dis. 2023. PMID: 39229323 Free PMC article. Review.
-
Pharmacotherapy of obesity: an update on the available medications and drugs under investigation.EClinicalMedicine. 2023 Mar 20;58:101882. doi: 10.1016/j.eclinm.2023.101882. eCollection 2023 Apr. EClinicalMedicine. 2023. PMID: 36992862 Free PMC article. Review.
-
Sleep apnea in relation to metabolism: An urgent need to study underlying mechanisms and to develop novel treatments for this unmet clinical need.Metabolism. 2017 Apr;69:207-210. doi: 10.1016/j.metabol.2017.01.028. Epub 2017 Feb 1. Metabolism. 2017. PMID: 28190524 Free PMC article. No abstract available.
-
Evaluating Weight Status and Sex as Moderators of the Association of Serum Leptin with Bone Mineral Density in Children and Adolescents .Horm Res Paediatr. 2017;87(4):233-243. doi: 10.1159/000459623. Epub 2017 Mar 30. Horm Res Paediatr. 2017. PMID: 28359065 Free PMC article. Clinical Trial.
References
-
- Carlton ED, Demas GE, French SS. Leptin, a neuroendocrine mediator of immune responses, inflammation, and sickness behaviors. Horm Behav 2012;62:272–279 - PubMed
-
- Papathanassoglou E, El-Haschimi K, Li XC, Matarese G, Strom T, Mantzoros C. Leptin receptor expression and signaling in lymphocytes: kinetics during lymphocyte activation, role in lymphocyte survival, and response to high fat diet in mice. J Immunol 2006;176:7745–7752 - PubMed
Publication types
MeSH terms
Substances
Grants and funding
LinkOut - more resources
Full Text Sources
Other Literature Sources
Miscellaneous
