. 2014 Oct;42(18):11589-600.
doi: 10.1093/nar/gku860. Epub 2014 Sep 23.

Non-metastatic 2 (NME2)-mediated suppression of lung cancer metastasis involves transcriptional regulation of key cell adhesion factor vinculin

Affiliations

Non-metastatic 2 (NME2)-mediated suppression of lung cancer metastasis involves transcriptional regulation of key cell adhesion factor vinculin

Ram Krishna Thakur et al. Nucleic Acids Res. 2014 Oct.

Abstract

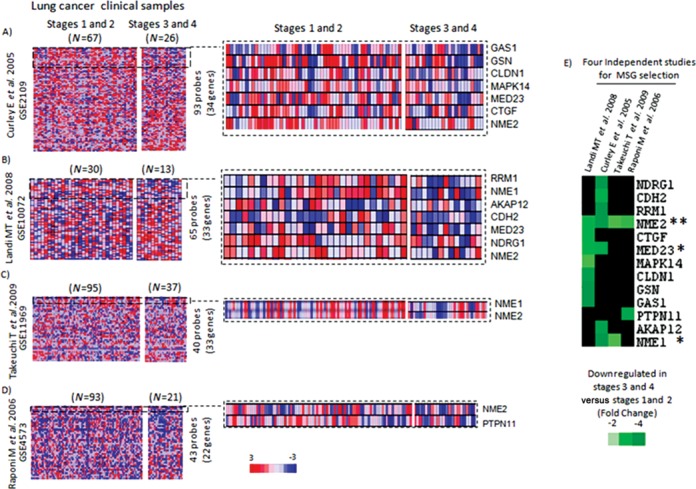
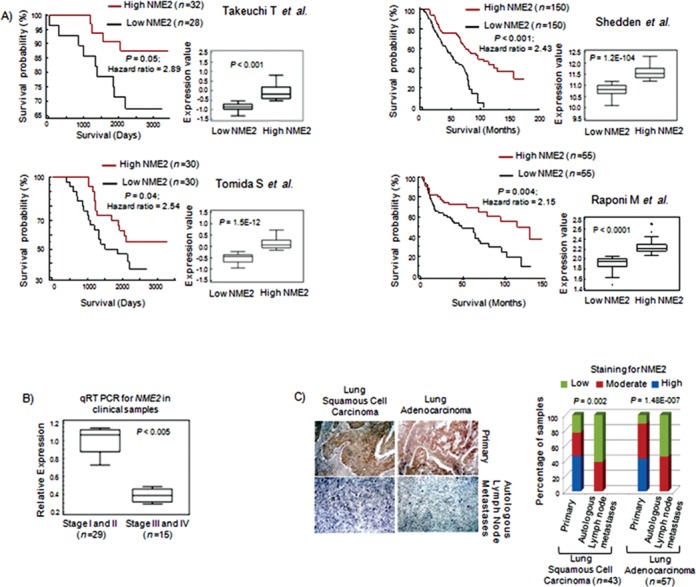
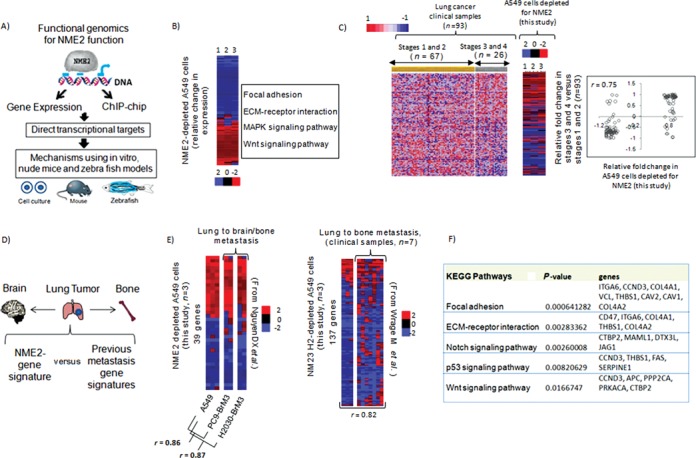
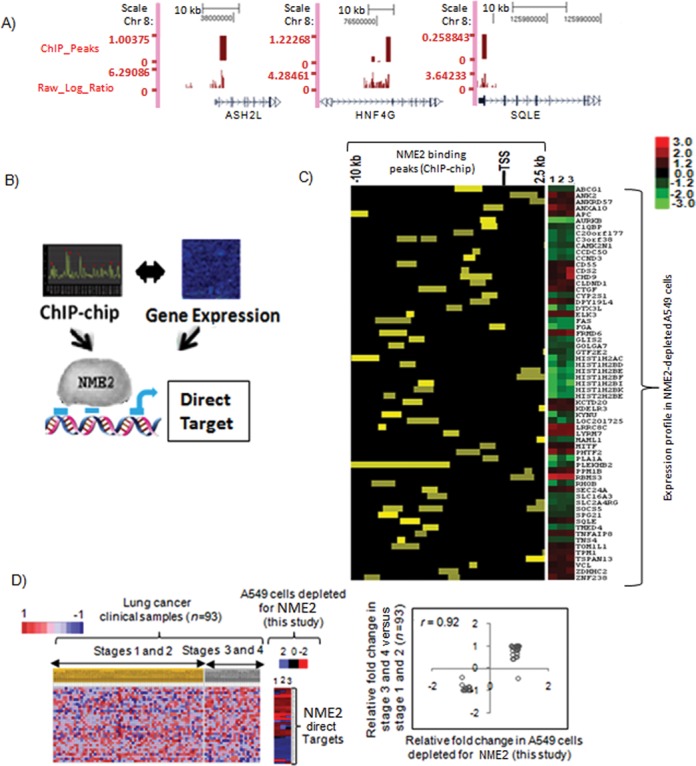
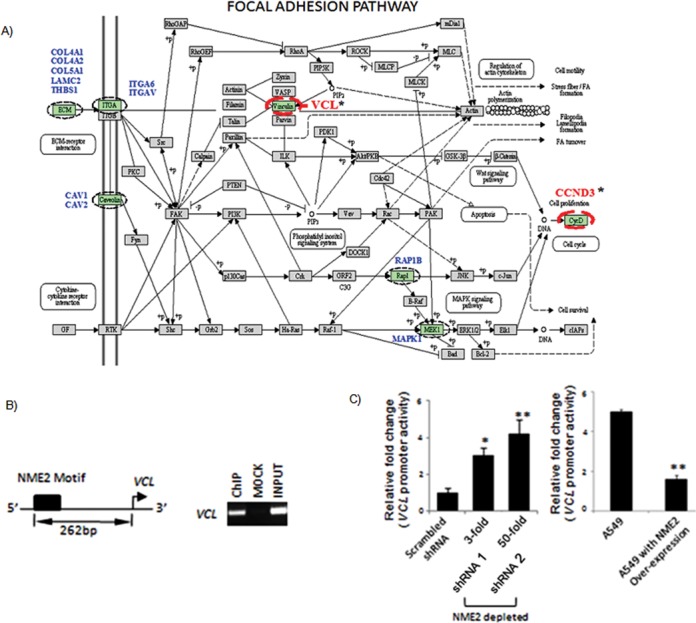
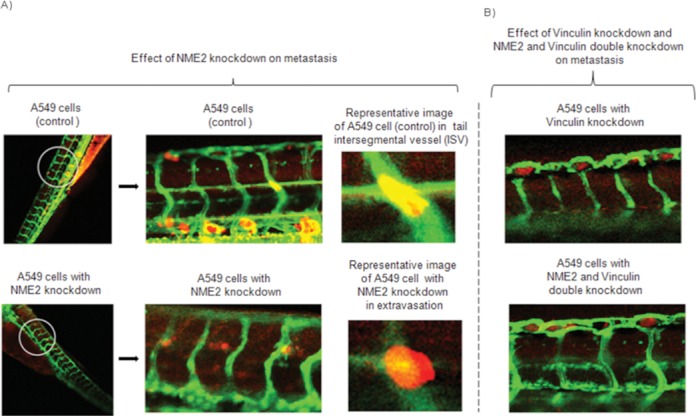
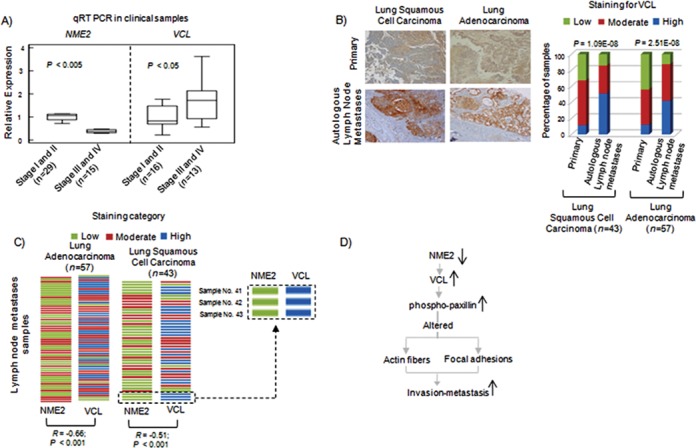
Tumor metastasis refers to spread of a tumor from site of its origin to distant organs and causes majority of cancer deaths. Although >30 metastasis suppressor genes (MSGs) that negatively regulate metastasis have been identified so far, two issues are poorly understood: first, which MSGs oppose metastasis in a tumor type, and second, which molecular function of MSG controls metastasis. Herein, integrative analyses of tumor-transcriptomes (n=382), survival data (n=530) and lymph node metastases (n=100) in lung cancer patients identified non-metastatic 2 (NME2) as a key MSG from a pool of >30 metastasis suppressors. Subsequently, we generated a promoter-wide binding map for NME2 using chromatin immunoprecipitation with promoter microarrays (ChIP-chip), and transcriptome profiling. We discovered novel targets of NME2 which are involved in focal adhesion signaling. Importantly, we detected binding of NME2 in promoter of focal adhesion factor, vinculin. Reduced expression of NME2 led to enhanced transcription of vinculin. In comparison, NME1, a close homolog of NME2, did not bind to vinculin promoter nor regulate its expression. In line, enhanced metastasis of NME2-depleted lung cancer cells was found in zebrafish and nude mice tumor models. The metastatic potential of NME2-depleted cells was remarkably diminished upon selective RNA-i-mediated silencing of vinculin. Together, we demonstrate that reduced NME2 levels lead to transcriptional de-repression of vinculin and regulate lung cancer metastasis.


Figures

Figure 1.
Figure 1.
Large-scale analyses of tumor transcriptomes identify key MSG in lung cancer metastasis. Analysis of differential expression of >30 MSGs across four independent datasets (A–E); (A) representation of analysis from Curley et al. (expression project in Oncology (expO)), (B) Landi et al., (C) Takeuchi et al. and (D) Raponi et al. The number of MSGs for which probes were found in individual study is also indicated next to the heat maps. Projections from individual heat maps show changes in expression of MSGs; the right panel indicates subset of MSGs that showed reduced expression in advanced stages relative to early stages; expression index: red: upregulation, blue: downregulation. (E) A heat map for 13 MSGs that showed reduced expression in advanced tumor stages in at least one dataset examined; A fold change of −2, −3 and −4 corresponds to 50%, 66% and 75% decrease, respectively, in expression level compared to early stage tumors; * = gene with reduced expression in at least two datasets; ** = gene with reduced expression in all four datasets. Scale: fold change of expression.
Figure 2.
Figure 2.
Metastasis suppressor NME2 expression associates with overall survival and autologous lymph node metastasis in patients. Kaplan–Meier plot was used to analyze relationship between NME2 transcript level and patient survival in data from (A) Takeuchi T et al.; n = 60, Shedden et al.; n = 300, Tomida et al.; n = 60 and Raponi et al.; n = 110; hazard ratio for each analysis shown. Inset in all cases shows box plot of NME2 transcript level in the two groups tested; statistical significance was calculated using student's t test. (B) qRT PCR for NME2 mRNA in 44 tumors grouped stage-wise from lung cancer patients; 1.7-fold depletion corresponds to 41% decreased expression compared to early stage tumors. (C) Representative immunohistochemistry images for NME2 in primary lung tumors and autologous lymph node metastases (left); quantitation of NME2 immunostaining (right panel, statistical significance calculated by Pearson chi-square test).
Figure 3.
Figure 3.
NME2 depletion results in gene expression changes characteristic of tumors with metastatic proclivity. (A) A functional genomics framework for exploring and validating functions of key metastasis suppressor, NME2; use of gene expression microarrays and chromatin immunoprecipitation coupled to hybridization to promoter microarrays (ChIP-chip) to identify direct targets, and use of in vitro and in vivo models for assessing contribution of targets to cancer progression. (B) Gene expression changes on NME2 depletion in A549 lung adenocarcinoma cells: heat map of 296 genes showing relative change in expression (1–3 are biological replicates); functional classification of the genes shows enriched biological pathways using Gene Ontology (GO)—top four KEGG pathways are shown. Expression change after depletion of NME2 in A549 cells relates closely to advanced lung cancers. (C) Left panel: heat map of normalized expression profile of 101 genes (126 probes) across 93 clinical datasets grouped stage-wise (P < 0.01); right panel: correlation of relative fold change in expression between clinical samples and NME2-depleted A549 cells (correlation coefficient, P < 0.001). (D) Primary lung tumors metastasize mainly to bones and brain; a framework to compare NME2-gene expression signature with previous organ-specific metastasis gene signatures. (E) Expression profile of NME2-depleted A549 cells relates to primary lung adenocarcinomas with preference for metastasis to bone and brain; heat maps represent relative fold changes in gene expression from Subramanian et al. (; see the text), and Nguyen et al. (; see the text) in left and right panel, respectively (PC9-BrM3 and H2030-BrM3 are lung cancer cells with demonstrated metastatic proclivity to both brain and bone, respectively). (F) Focal adhesion genes show deregulated expression in lung tumors with metastatic proclivity; GO of genes shared between NME2-depleted A549 cells and lung cancer cells with metastatic preference for bone and brain.
Figure 4.
Figure 4.
Promoter-wide location analysis identifies targets of NME2 involved in metastatic progression. (A) ChIP-chip for NME2 across promoters of human genome: representative binding sites (peaks) and enrichment score on chromosome 8 in UCSC browser format. (B) Overlap of ChIP-chip and expression microarray results identified genes with change in mRNA level as well as binding of NME2 to their respective promoters as direct targets of NME2. (C) Position of NME2 binding site with respect to TSS and ChIP-chip enrichment score within the 64 direct targets of NME2 (left panel) and the relative change (log ratio) in expression of the transcript as determined by microarrays on targeted depletion of NME2 in A549 cells (right panel). (D) NME2-direct targets (36 probes representing 27 genes) show changes in expression across 93 lung carcinoma transcriptomes (grouped stage-wise) concordant with changes in gene expression profile obtained in A549 cells; P = 0.003 (left panel); correlation of relative fold change in expression in clinical samples versus NME2-depleted A549 cells (P < 0.0001 for correlation coefficient) (right panel).
Figure 5.
Figure 5.
Focal adhesion pathway gene vinculin as a direct transcriptional target of metastasis suppressor NME2. (A) Representation of NME2-target genes enriched in KEGG focal adhesion pathway; names are mentioned against highlighted boxes. Genes in blue color showed changes in mRNA level only (indirect targets); in comparison, genes with asterisk (*) showed alteration in mRNA level and binding of NME2 to their promoter as well (direct targets). (B) ChIP-PCR validation of NME2 occupancy of vinculin promoter: scheme showing NME2-motif within vinculin promoter; ChIP assay shows NME2 occupancy at the vinculin promoter; mock represents immunoprecipitation using non-specific isotypic IgG. (C) Over expression of NME2 represses (left panel), and stable depletion of NME2 enhances vinculin promoter activity in a luciferase reporter assay (right panel); 3- and 50-fold depletion corresponds to 66% and 98% decreased expression compared to control; all significance values: *P < 0.05, **P < 0.01; Student's t test, error bars represent standard deviation (SD).
Figure 6.
Figure 6.
NME2 dictates extravasation of cancer cells through its target vinculin in zebrafish model of metastasis. Effect of knockdown of NME2 and vinculin on extravasation of A549 cells in zebrafish model of metastasis (A–B); following injection of A549 cell clones (red) into pericardium of 3 dpf Tg(Fli-GFP) zebrafish, the imaging was done 24 h later using a confocal microscope. In Tg(Fli-GFP) zebrafish, vasculature expresses GFP and appears green. (A) Control A549 cells (red) are visible within the circulatory system (green) of zebrafish and have not extravasated. A549 cells with NME2 knockdown (red) are extravasating from the circulatory system (green) and shown in extravascular space. Representative image of a control A549 cell in the tail ISV of a zebrafish (top) and an image of an extravasating NME2-depleted A549 cell (bottom). (B) A549 cells with vinculin knockdown (red) and NME2 as well as vinculin double knockdown (red) are visible within the circulatory system (green) of zebrafish and none have extravasated. Dpf: days-post-fertilization.
Figure 7.
Figure 7.
Inverse relationships between vinculin and NME2 expression in lymph node metastases. (A) qRT PCR for NME2 and vinculin transcript in stage-wise grouped tumors from lung cancer patients. Significance calculated by student's t test. (B) Representative images of IHC staining for vinculin in lung tumors (left) and quantitation of vinculin immunostaining (right). (C) Matched staining results for both NME2 and Vinculin in lymph node metastases of 100 patients; inset shows staining pattern for NME2 and vinculin in three patients; strength of staining shown by color (top). (D) A proposed model for anti-metastatic function of NME2 involving regulation of vinculin.

Similar articles

Cited by

References

    1. Fidler I.J. The pathogenesis of cancer metastasis: the ‘seed and soil’ hypothesis revisited. Nat. Rev. Cancer. 2003;3:453–458. - PubMed
    1. Hanahan D., Weinberg R.A. Hallmarks of cancer: the next generation. Cell. 2011;144:646–674. - PubMed
    1. Nguyen D.X., Bos P.D., Massague J. Metastasis: from dissemination to organ-specific colonization. Nat. Rev. Cancer. 2009;9:274–284. - PubMed
    1. Gupta G.P., Massague J. Cancer metastasis: building a framework. Cell. 2006;127:679–695. - PubMed
    1. Rinker-Schaeffer C.W., O'Keefe J.P., Welch D.R., Theodorescu D. Metastasis suppressor proteins: discovery, molecular mechanisms, and clinical application. Clin. Cancer Res. 2006;12:3882–3889. - PMC - PubMed

Publication types

Associated data