. 2014 Oct;42(18):11818-30.
doi: 10.1093/nar/gku861. Epub 2014 Sep 23.

Nova1 is a master regulator of alternative splicing in pancreatic beta cells

Affiliations

Nova1 is a master regulator of alternative splicing in pancreatic beta cells

Olatz Villate et al. Nucleic Acids Res. 2014 Oct.

Abstract

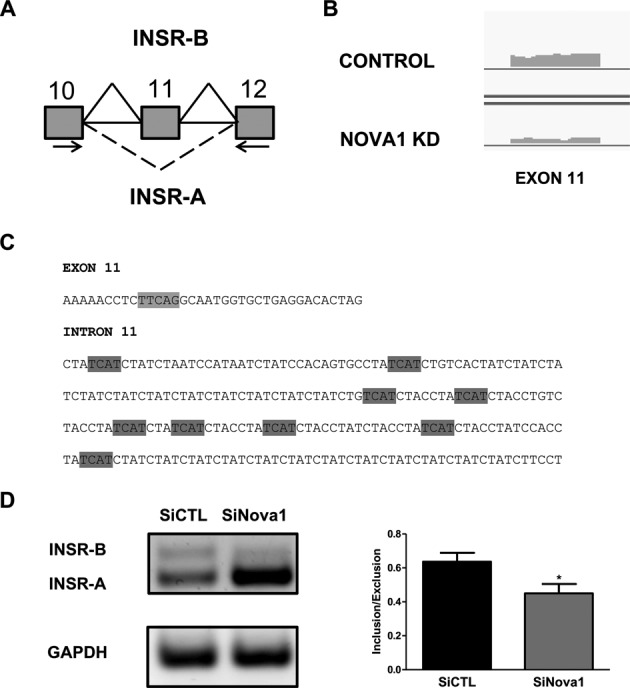
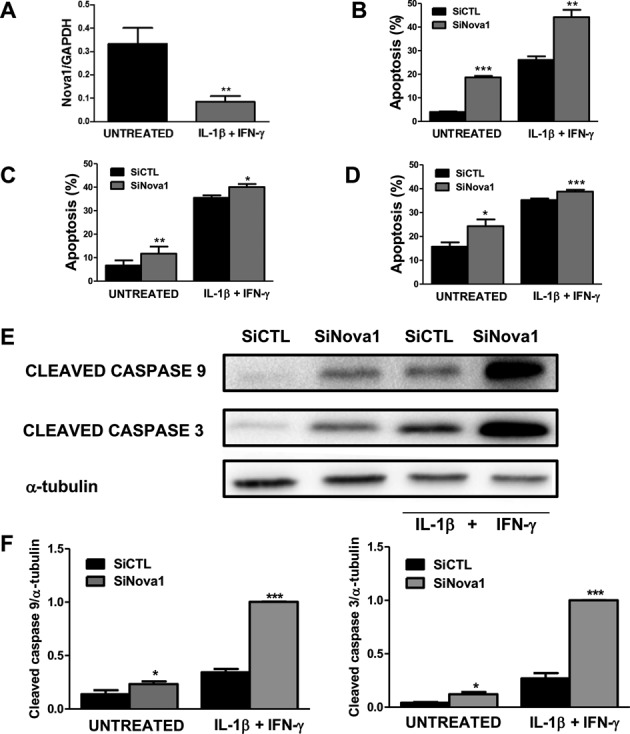
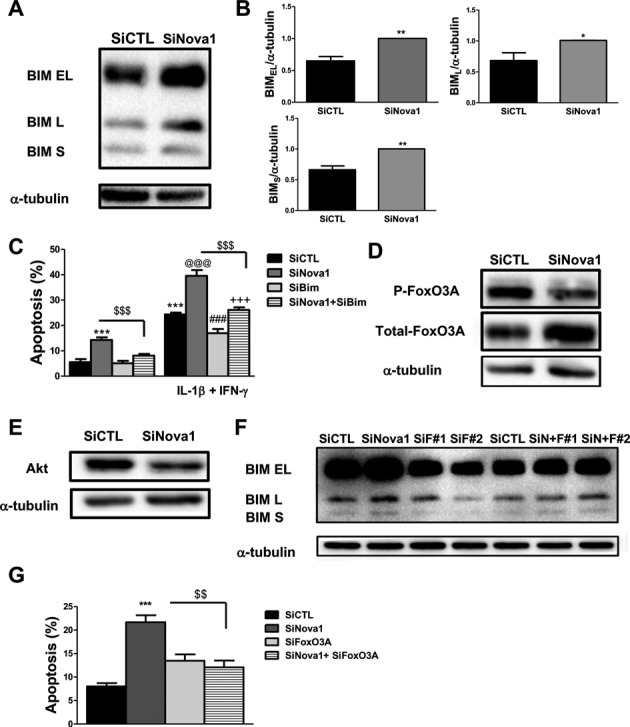
Alternative splicing (AS) is a fundamental mechanism for the regulation of gene expression. It affects more than 90% of human genes but its role in the regulation of pancreatic beta cells, the producers of insulin, remains unknown. Our recently published data indicated that the 'neuron-specific' Nova1 splicing factor is expressed in pancreatic beta cells. We have presently coupled specific knockdown (KD) of Nova1 with RNA-sequencing to determine all splice variants and downstream pathways regulated by this protein in beta cells. Nova1 KD altered the splicing of nearly 5000 transcripts. Pathway analysis indicated that these genes are involved in exocytosis, apoptosis, insulin receptor signaling, splicing and transcription. In line with these findings, Nova1 silencing inhibited insulin secretion and induced apoptosis basally and after cytokine treatment in rodent and human beta cells. These observations identify a novel layer of regulation of beta cell function, namely AS controlled by key splicing regulators such as Nova1.


Figures

Figure 1.
Figure 1.
Nova1 regulates the AS of several genes in pancreatic beta cells. (A) Primary rat beta cells were transfected with siCTL or siNova1 and then collected after 48 h for mRNA expression analyses. Expression of Nova1 after its KD is shown. Results are mean ± SEM (n = 7). ***P < 0.001 versus siCTL by paired t-test. (B) Representative western blot of Nova1 expression after its KD in INS-1E cells (n = 5). (C) Agarose gel showing that Nova1 controls AS of Gabrg2 exon 9, its own exon 4 and Neurexin1 site 4. Long and short indicates the variants with or without the corresponding analysed exons. The results shown are representative of five different experiments where Nova1 has been KD. The percentage of inclusion/exclusion of each exon was quantified by densitometry (considering the highest value in each individual experiment as 1) and is shown under the respective gels. *P < 0.05 or **P < 0.01 versus siCTL by paired t-test.
Figure 2.
Figure 2.
Effect of Nova1 KD on the fold change of genes and isoforms. (A–B) The histograms show the distributions of fold change at the gene level (A) and at the isoform level (B) after Nova1 KD and RNA-seq analysis of three independent primary rat beta cell preparations. Only 8% of all the modified genes show a log fold change higher than 1.5 (up-regulated) or lower than 0.67 (down-regulated). At the isoform level this proportion is much higher, i.e. 57%. (C) Distribution of the ‘splicing index’ values (see Results for details about the splicing index) after Nova1 KD. Most of the significantly alternatively spliced isoforms have a splicing index higher than 10% (delimited by the two vertical lines). (D) Overview of the key Nova1 modified pathways and transcripts after IPA pathways analysis.
Figure 3.
Figure 3.
Nova1 regulates insulin secretion and voltage-dependent current influx. INS-1E cells (A, D, E) and INS-1 832/13 cells (B–C) were transfected with siCTL or siNova1. After 48 h cells were used for insulin secretion assay (A), voltage-dependent current influx analysis (B–C) protein analysis (D) and mRNA analysis (E). (A) INS-1E cells were incubated for 30 min with 1.7 mM glucose, 16.7 mM glucose or 16.7 mM glucose plus forskolin (20 μM) (n = 5) and the insulin released evaluated by ELISA. *P < 0.05 versus siCTL by paired t-test. (B) A current voltage protocol where 50-ms depolarizations from −70 mV to voltages between −50 mV and +40 mV were applied to INS-1 832/13 cells. Shown in the figure are the currents measured when a siCTL cell (gray trace) and a siNova1 cell (black trace), respectively, were depolarized to 0 mV. (C) The average sustained current Isus (measured as described in B), charge (Q) and peak-current Ip as a function of the membrane voltage (V) are from the experiments described in B. Ip is a measure of the voltage-dependent Na+ current and Isus and Q are measures of the voltage-dependent Ca2+ current. Data are representative of n = 28 to 33 experiments in each group. (D) Schematic overview of PLCβ1 indicating the splicing variants and a representative western blot (n = 4) of PLCβ1 variants expression after Nova1 KD. α-tubulin was used as a control for protein loading. The quantification of PLCβ1 expression is shown. ***P < 0.001 versus siCTL by paired t-test. (E) Snap25 AS was evaluated by RT-PCR after Nova1 KD. The quantification of both splice variants by qRT-PCR is shown. **P < 0.01 versus siCTL by paired t-test. An agarose gel of one experiment is shown. (D) and (E) are representative of four similar experiments.
Figure 4.
Figure 4.
KD of Nova1-regulated Snap25 splice variant b decreases insulin secretion. (A) Snap25 exons 5a and 5b (bold) and the surrounding intron sequences are shown. Potential binding sites for Nova1 are highlighted in gray. (B) Schematic overview of Snap25 alternative exons 5a and 5b. The line indicates the position of the siRNA designed to KD Snap25 splice variant b. INS-1E cells were transfected with control or a Snap25 splice variant b siRNA and after 48 h collected for mRNA analysis. A representative agarose gel (of five similar experiments) showing the expression of both variants and gapdh is shown. (C) INS-1E cells were incubated for 30 min with 1.7 mM glucose, 16.7 mM glucose or 16.7 mM glucose plus forskolin (20 μM) (n = 5) and the insulin released evaluated by ELISA. *P < 0.05 versus siCTL by paired t-test.
Figure 5.
Figure 5.
Nova1 modifies the splicing of the insulin receptor exon 11 in beta cells. (A) Schematic figure representing INSR splice variants. Arrows indicate the primers used for the analysis of exon 11. (B) Representative scheme of the RNA-seq reads covering INSR exon 11 in control and Nova1 KD preparations. (C) Sequences of INSR exon 11 and intron 11. Potential binding sites identified for Nova1 are highlighted in gray. (D) INS-1E cells were transfected with siCTL or siNova1 and collected after 48 h for mRNA analysis. INSR exon 11 splicing was evaluated by RT-PCR. The agarose gel is representative of three independent experiments. The percentage of inclusion/exclusion of exon 11 is shown in the graph. *P < 0.05 versus siCTL by paired t-test.
Figure 6.
Figure 6.
Nova1 KD increases apoptosis under basal condition and following cytokine treatment. Primary rat beta cells were exposed to the pro-inflammatory cytokines IL-1β + IFN-γ for 48 h and then collected for mRNA expression analyses. Results are mean ± SEM (n = 8). **P < 0.01 versus untreated by paired t-test (A). After transfection with siRNA control or siRNA Nova1 (> 50% inhibition of Nova1 expression in the three cell types) INS-1E cells (B, E, F), FACS-purified primary rat beta cells (C) and dispersed human islets (D) were exposed or not to cytokines (n = 4). After 24 h for INS-1E cells or 48 h for primary beta cells or dispersed human islets, apoptosis was evaluated. (E) Cleaved caspases-9 and -3 expression after Nova1 KD. Blots are representative of four independent experiments. α-tubulin was used as a control for protein loading. (F) Densitometry analysis of western blot for cleaved caspases 9 and 3 normalized by the housekeeping protein α-tubulin. Results are mean ± SEM (n = 4). *P < 0.05, **P < 0.01 or ***P < 0.001 versus siCTL untreated or after cytokine treatment by paired t-test.
Figure 7.
Figure 7.
Bim mediates the potentiation of apoptosis in Nova1-deficient cells. INS-1E cells were transfected with control or Nova1 siRNAs. After 48 h, cells were collected for western blot analysis. (A) One representative western blot of Bim variants expression is shown. (B) Densitometry analysis of the western blots for Bim splicing variants. Results are mean ± SEM (n = 5). *P < 0.05 or **P < 0.01 versus siCTL by paired t-test. (C) INS-1E cells transfected with control, Nova1 and Bim siRNAs were exposed to cytokines for 24 h; apoptosis was then measured using nuclear dyes. Results are mean ± SEM (n = 5). ***P < 0.001 versus siCTL without cytokines; @@@P < 0.001 versus siNova1, ###P < 0.001 versus siBim; +++P < 0.001 versus siNova1 + siBim; $$$P < 0.001 as indicated by the bars. ANOVA followed by paired t-test with Bonferroni's correction. (D) Western blot of total-FoxO3A and P-FoxO3A after Nova1 KD. α-tubulin was used as a control for protein loading. Blots are representative of five experiments. (E) Western blot of Akt after Nova1 KD is shown. α-tubulin was used as a control for protein loading. The blot is representative of four experiments. (F) Western blot showing Bim expression after Nova1 KD, FoxO3A KD (with two different siRNAs F#1 and F#2) and the double KD of Nova1 and FoxO3A (n = 3). (G) Apoptosis was measured using nuclear dyes after Nova1 KD, FoxO3A KD and the double KD of Nova1 and FoxO3A. Results are mean ± SEM (n = 4). ***P < 0.001 versus siCTL and $$P < 0.01 as indicated by the bars. ANOVA followed by paired t-test with Bonferroni's correction.

Similar articles

Cited by

References

    1. Pan Q., Shai O., Lee L.J., Frey B.J., Blencowe B.J. Deep surveying of alternative splicing complexity in the human transcriptome by high-throughput sequencing. Nat. Genet. 2008;40:1413–1415. - PubMed
    1. Modrek B., Lee C. A genomic view of alternative splicing. Nat. Genet. 2002;30:13–19. - PubMed
    1. Diez J., Park Y., Zeller M., Brown D., Garza D., Ricordi C., Hutton J., Eisenbarth G.S., Pugliese A. Differential splicing of the IA-2 mRNA in pancreas and lymphoid organs as a permissive genetic mechanism for autoimmunity against the IA-2 type 1 diabetes autoantigen. Diabetes. 2001;50:895–900. - PubMed
    1. Ng B., Yang F., Huston D.P., Yan Y., Yang Y., Xiong Z., Peterson L.E., Wang H., Yang X.F. Increased noncanonical splicing of autoantigen transcripts provides the structural basis for expression of untolerized epitopes. J. Allergy Clin. Immunol. 2004;114:1463–1470. - PMC - PubMed
    1. Yang F., Chen I.H., Xiong Z., Yan Y., Wang H., Yang X.F. Model of stimulation-responsive splicing and strategies in identification of immunogenic isoforms of tumor antigens and autoantigens. Clin. Immunol. 2006;121:121–133. - PubMed

Publication types

MeSH terms