

A real-time fluorescence polarization activity assay to screen for inhibitors of bacterial ribonuclease P
- PMID: 25249623
- PMCID: PMC4227764
- DOI: 10.1093/nar/gku850
A real-time fluorescence polarization activity assay to screen for inhibitors of bacterial ribonuclease P
Abstract
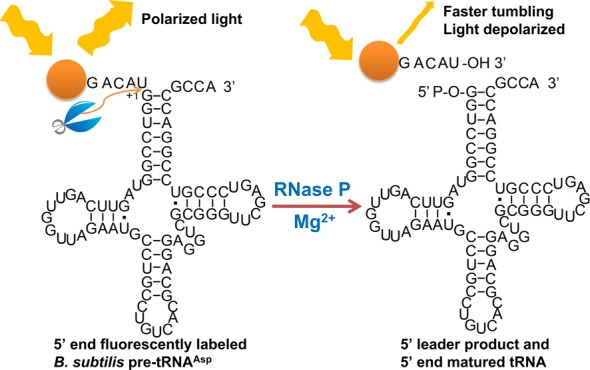
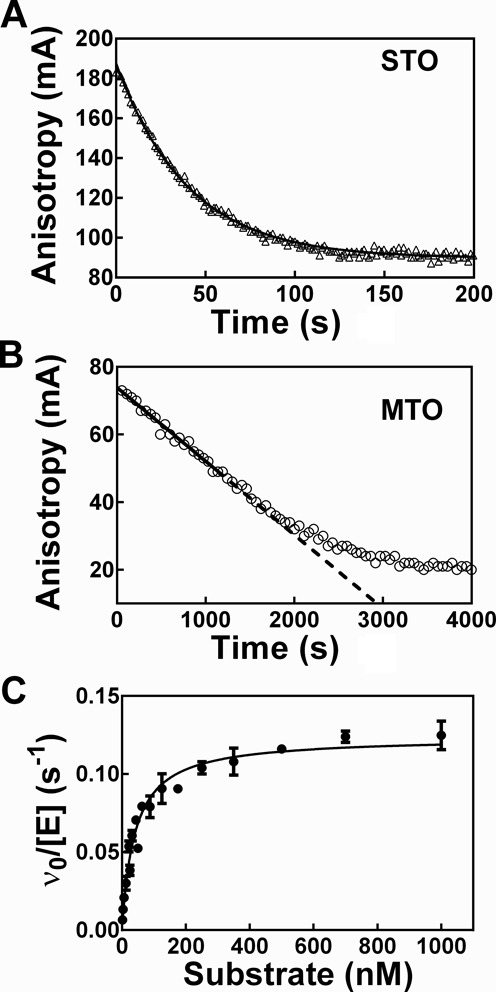
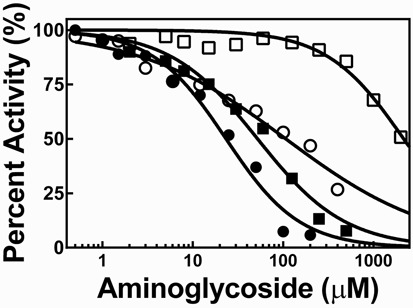
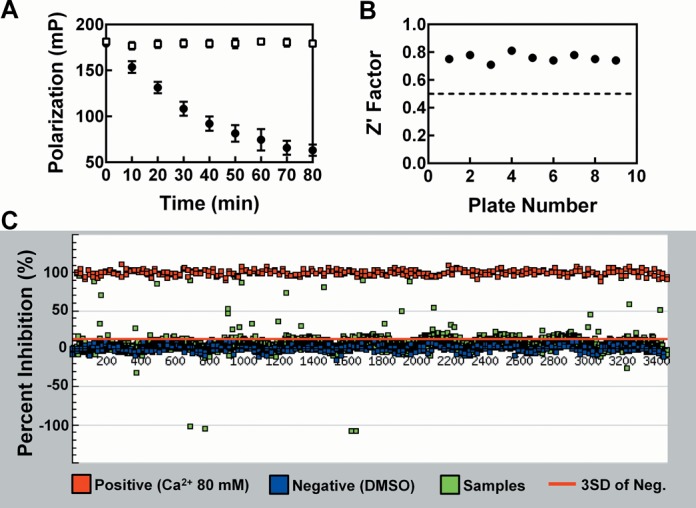
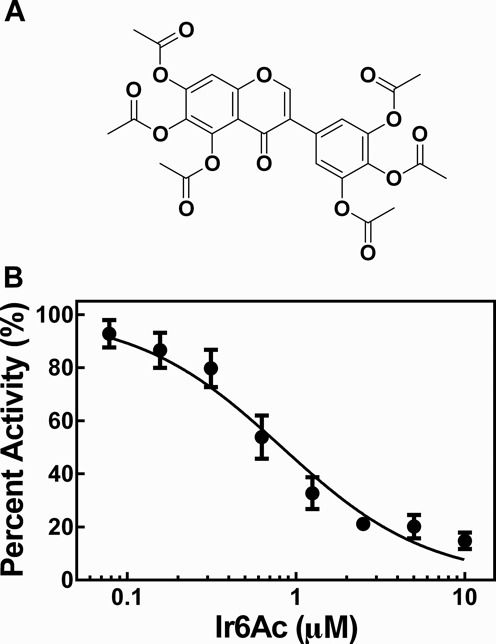
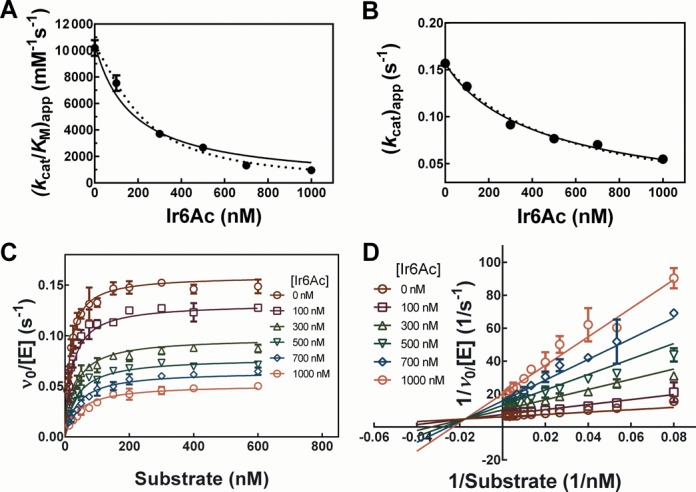
Ribonuclease P (RNase P) is an essential endonuclease that catalyzes the 5' end maturation of precursor tRNA (pre-tRNA). Bacterial RNase P is an attractive potential antibacterial target because it is essential for cell survival and has a distinct subunit composition compared to the eukaryal counterparts. To accelerate both structure-function studies and discovery of inhibitors of RNase P, we developed the first real-time RNase P activity assay using fluorescence polarization/anisotropy (FP/FA) with a 5' end fluorescein-labeled pre-tRNAAsp substrate. This FP/FA assay also detects binding of small molecules to pre-tRNA. Neomycin B and kanamycin B bind to pre-tRNAAsp with a Kd value that is comparable to their IC50 value for inhibition of RNase P, suggesting that binding of these antibiotics to the pre-tRNA substrate contributes to the inhibitory activity. This assay was optimized for high-throughput screening (HTS) to identify specific inhibitors of RNase P from a 2880 compound library. A natural product derivative, iriginol hexaacetate, was identified as a new inhibitor of Bacillus subtilis RNase P. The FP/FA methodology and inhibitors reported here will further our understanding of RNase P molecular recognition and facilitate discovery of antibacterial compounds that target RNase P.
© The Author(s) 2014. Published by Oxford University Press on behalf of Nucleic Acids Research.
Figures
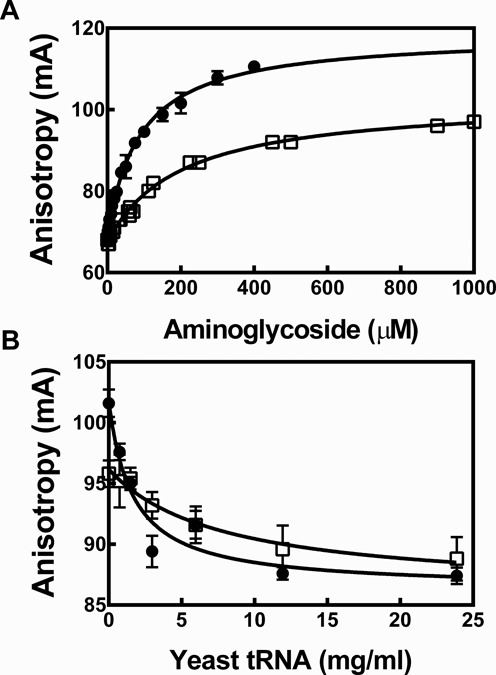
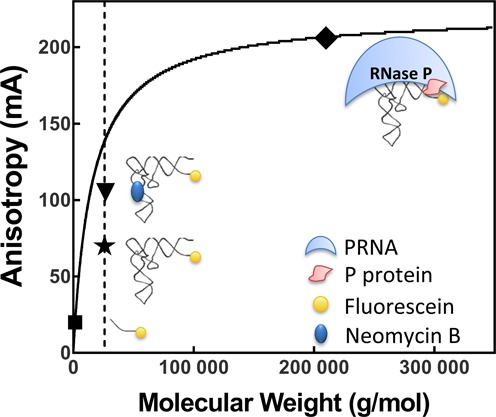
 ), Fl-pre-tRNAAsp•NeoB (▾) and Fl-pre-tRNAAsp•RNase P (♦).
Similar articles
-
Fluorescence-Based Real-Time Activity Assays to Identify RNase P Inhibitors.Methods Mol Biol. 2017;1520:201-225. doi: 10.1007/978-1-4939-6634-9_12. Methods Mol Biol. 2017. PMID: 27873254
-
Protein component of Bacillus subtilis RNase P specifically enhances the affinity for precursor-tRNAAsp.Biochemistry. 1998 Feb 24;37(8):2393-400. doi: 10.1021/bi972530m. Biochemistry. 1998. PMID: 9485387
-
Studies on the mechanism of inhibition of bacterial ribonuclease P by aminoglycoside derivatives.Nucleic Acids Res. 2008 Feb;36(2):697-704. doi: 10.1093/nar/gkm1088. Epub 2007 Dec 15. Nucleic Acids Res. 2008. PMID: 18084035 Free PMC article.
-
The Diversity of Ribonuclease P: Protein and RNA Catalysts with Analogous Biological Functions.Biomolecules. 2016 May 13;6(2):27. doi: 10.3390/biom6020027. Biomolecules. 2016. PMID: 27187488 Free PMC article. Review.
-
Bacterial RNase P: a new view of an ancient enzyme.Nat Rev Microbiol. 2006 Oct;4(10):729-40. doi: 10.1038/nrmicro1491. Nat Rev Microbiol. 2006. PMID: 16980936 Review.
Cited by
-
RNA helicase DEAD box protein 5 regulates Polycomb repressive complex 2/Hox transcript antisense intergenic RNA function in hepatitis B virus infection and hepatocarcinogenesis.Hepatology. 2016 Oct;64(4):1033-48. doi: 10.1002/hep.28698. Epub 2016 Aug 8. Hepatology. 2016. PMID: 27338022 Free PMC article.
-
Antibiotics and RNase P.Antibiotics (Basel). 2016 May 6;5(2):15. doi: 10.3390/antibiotics5020015. Antibiotics (Basel). 2016. PMID: 27164152 Free PMC article. Review.
-
A screening platform to monitor RNA processing and protein-RNA interactions in ribonuclease P uncovers a small molecule inhibitor.Nucleic Acids Res. 2019 Jul 9;47(12):6425-6438. doi: 10.1093/nar/gkz285. Nucleic Acids Res. 2019. PMID: 30997498 Free PMC article.
-
Mechanistic Studies Reveal Similar Catalytic Strategies for Phosphodiester Bond Hydrolysis by Protein-only and RNA-dependent Ribonuclease P.J Biol Chem. 2015 May 22;290(21):13454-64. doi: 10.1074/jbc.M115.644831. Epub 2015 Mar 27. J Biol Chem. 2015. PMID: 25817998 Free PMC article.
-
Noncanoncial signal recognition particle RNAs in a major eukaryotic phylum revealed by purification of SRP from the human pathogen Cryptococcus neoformans.Nucleic Acids Res. 2015 Oct 15;43(18):9017-27. doi: 10.1093/nar/gkv819. Epub 2015 Aug 14. Nucleic Acids Res. 2015. PMID: 26275773 Free PMC article.
References
-
- Kazantsev A.V., Pace N.R. Bacterial RNase P: a new view of an ancient enzyme. Nat. Rev. Microbiol. 2006;4:729–740. - PubMed
-
- Hernandez-Cid A., Aguirre-Sampieri S., Diaz-Vilchis A., Torres-Larios A. Ribonucleases P/MRP and the expanding ribonucleoprotein world. IUBMB Life. 2012;64:521–528. - PubMed
-
- Peck-Miller K.A., Altman S. Kinetics of the processing of the precursor to 4.5 S RNA, a naturally occurring substrate for RNase P from Escherichia coli. J. Mol. Biol. 1991;221:1–5. - PubMed
Publication types
MeSH terms
Substances
Grants and funding
LinkOut - more resources
Full Text Sources
Other Literature Sources
Medical
Molecular Biology Databases
