. 2014 Sep 5:8:274.
doi: 10.3389/fncel.2014.00274. eCollection 2014.

In vivo bioluminescence imaging of vascular remodeling after stroke

Affiliations

In vivo bioluminescence imaging of vascular remodeling after stroke

Joanna M Adamczak et al. Front Cell Neurosci. .

Abstract

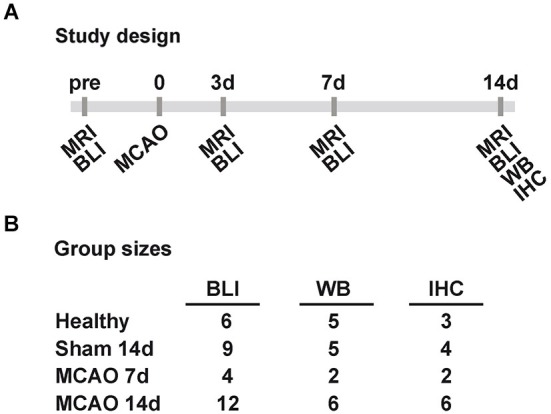
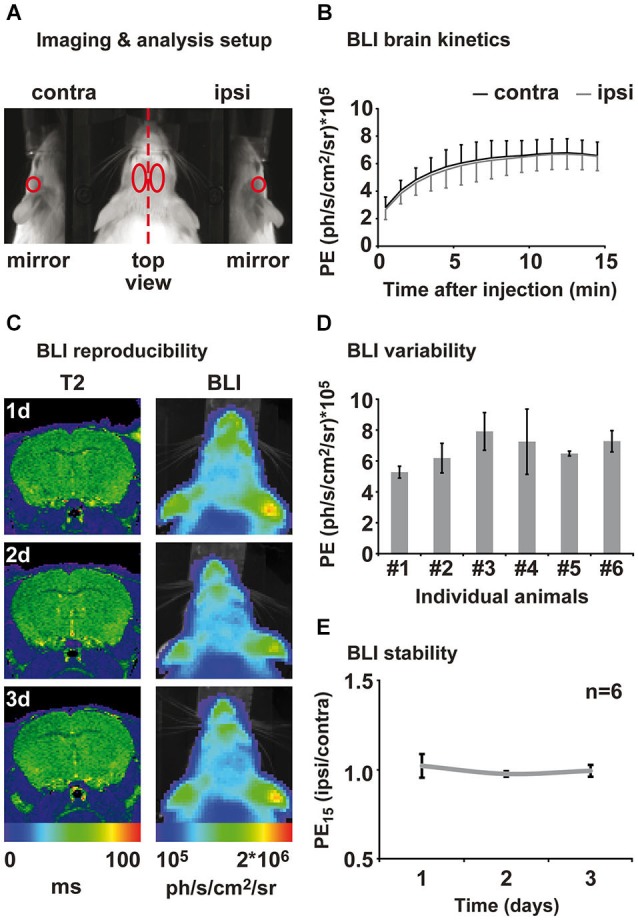
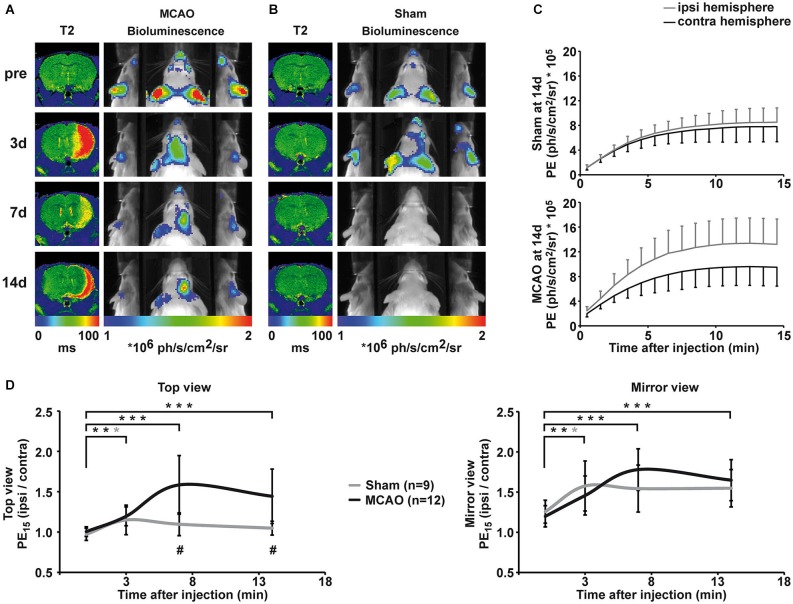
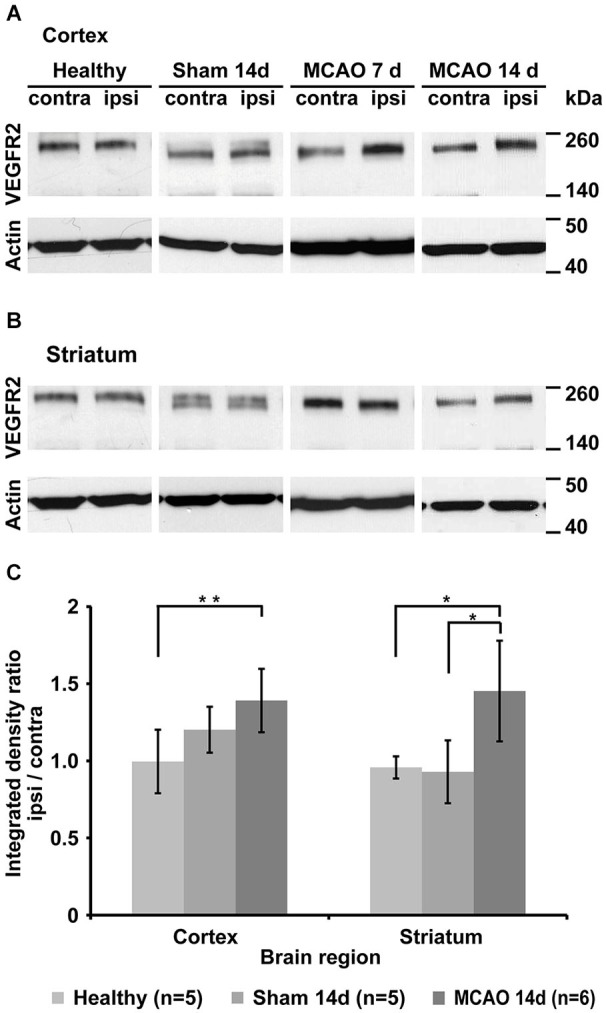
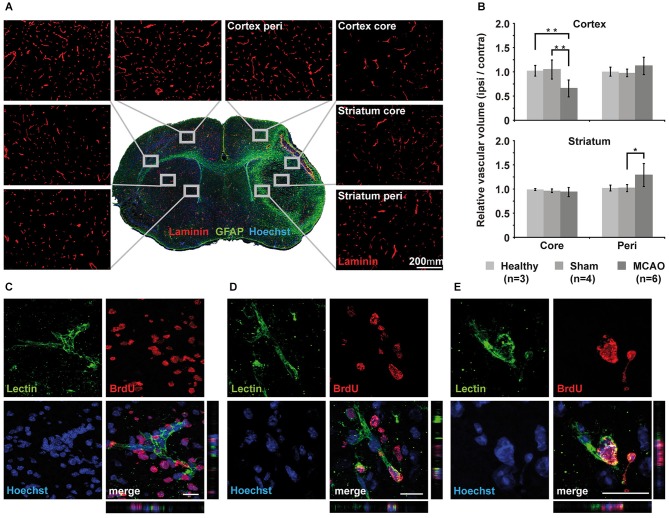
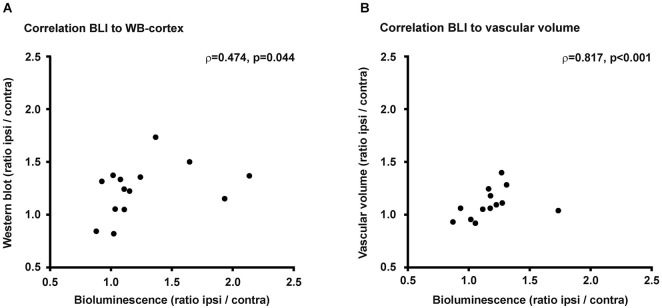
Thrombolysis remains the only beneficial therapy for ischemic stroke, but is restricted to a short therapeutic window following the infarct. Currently research is focusing on spontaneous regenerative processes during the sub-acute and chronic phase. Angiogenesis, the formation of new blood vessels from pre-existing ones, was observed in stroke patients, correlates with longer survival and positively affects the formation of new neurons. Angiogenesis takes place in the border zones of the infarct, but further insight into the temporal profile is needed to fully apprehend its therapeutic potential and its relevance for neurogenesis and functional recovery. Angiogenesis is a multistep process, involving extracellular matrix degradation, endothelial cell proliferation, and, finally, new vessel formation. Interaction between vascular endothelial growth factor and its receptor 2 (VEGFR2) plays a central role in these angiogenic signaling cascades. In the present study we investigated non-invasively the dynamics of VEGFR2 expression following cerebral ischemia in a mouse model of middle cerebral artery occlusion (MCAO). We used a transgenic mouse expressing firefly luciferase under the control of the VEGFR2 promotor to non-invasively elucidate the temporal profile of VEGFR2 expression after stroke as a biomarker for VEGF/VEGFR2 signaling. We measured each animal repetitively up to 2 weeks after stroke and found increased VEGFR2 expression starting 3 days after the insult with peak values at 7 days. These were paralleled by increased VEGFR2 protein levels and increased vascular volume in peri-infarct areas at 14 days after the infarct, indicating that signaling via VEGFR2 leads to successful vascular remodeling. This study describes VEGFR2-related signaling is active at least up to 2 weeks after the infarct and results in increased vascular volume. Further, this study presents a novel strategy for the non-invasive evaluation of angiogenesis-based therapies.

Keywords: VEGFR2; angiogenesis; cerebral ischemia; flk-1; vessel density.


Figures

Figure 1
Figure 1
Study design and group sizes. (A) Sham and MCAO animals were measured before (pre), and 3, 7, 14 days (3d, 7d, 14d) after 30 min MCAO with MRI and BLI. At 7d and 14d post MCAO tissue was collected for WB and IHC. (B) The displayed final group sizes as used per method and group. Excluded animals are not listed. (MCAO: middle cerebral artery occlusion, MRI: magnetic resonance imaging, BLI: bioluminescence imaging, WB: western blot, IHC: immunohistochemistry).
Figure 2
Figure 2
Assessment of brain kinetics and stability of the BLI signal from healthy animals. (A) Animals were placed in a prone position on an elevated bar between two 45° mirrors. BLI was evaluated in four different regions of interest: ipsi- and contralateral top view, ipsi- and contra-lateral mirror (side) view. (B) Measuring PE directly after luciferin injection reveals brain specific inflow kinetics. An inflow phase between 1–10 min can be distinguished from a plateau phase of maximal PE between 12 and 15 min after injection. Emission from ipsi- and contralateral hemisphere was consistently of same magnitude. (C) Healthy control animals were measured repetitively for the assessment of the inter- and intra-animal variability of the BLI signal. MRI and BLI images of an exemplary healthy animal show an intact brain and stable intensity of PE over time. MRI is shown as coronal brain section, BLI is shown as horizontal planar projection of the PE onto the mouse photograph. (D) Three-fold measurement of each healthy animal revealed intra-individual variability of 3–30%. Inter-animal variability was around 20% to 45%. (E) Normalization of PE from ipsi- to contralateral hemisphere eliminates intra- and inter-animal variability and results in stable bioluminescence over time. Data is presented as mean ± standard deviation. (PE: photon emission, PE15: photon emission of the 15th minute after luciferin injection).
Figure 3
Figure 3
Qualitative and quantitative evaluation of BLI changes after sham and MCAO surgery. (A) Representative longitudinal MRI and BLI data set from one animal that received MCAO surgery. MRI is shown as coronal brain section, BLI is shown as horizontal planar projection of the PE onto the mouse photograph. After MCAO, a clear lesion is visible in the right hemisphere on T2 maps. BLI signal intensity starts to increase 3d post-stroke and PE is clearly increased over the ischemic hemisphere compared to the intact hemisphere at 7d and 14d post-stroke. Increased PE from the ischemic hemisphere is distinctively visualized in the mirrors. (B) Representative longitudinal MRI and BLI data set from one animal that received sham surgery. Sham surgery did not result in lesion formation confirmed by unchanged T2 maps. However, sham surgery lead to a transient increase in PE from the ipsilateral side, which was best visible in the mirror system. (C) BLI kinetics of the ischemic and the intact hemisphere at 14d post sham surgery (upper graph) and MCAO surgery (lower graph). (D) Quantification of BLI changes was achieved by normalization of PE from ipsi- to contralateral hemisphere for the top view (left graph) and the mirror view (right graph). Pre-stroke PE was consistently equal in all investigated groups with a stronger variation in the mirror view. Increased PE was significantly different to pre-stroke values on day three for stroke, but also for sham animals in both views. At 7d and 14d, elevated PE in stroke animals was statistically significant compared to pre-stroke values (both p < 0.001) and to the sham group (p = 0.001, p = 0.004). (black = stroke, gray = sham, * p < 0.05, ** p < 0.01, *** p < 0.001; # comparison between groups p < 0.01).
Figure 4
Figure 4
Qualitative and quantitative evaluation of tissue VEGFR2 protein content. (A) Representative Western blots from cortical tissue samples for each group showing increased VEGFR2 (210 and 230 kDa) content in the ischemic cortex of animals that underwent MCAO. Note the strong increase in the 7d group. Sham animals and healthy control display similar levels between left and right hemisphere. (B) Representative Western blots from striatal tissue samples. Strongest elevation is visible in the 14d MCAO group. (C) Semi-quantification (including normalization to actin) and subsequent normalization to the intact hemisphere reveals significant increased VEGFR2 expression in the ischemic cortex (p = 0.005) and ischemic striatum (p = 0.048) (* p < 0.05, ** p < 0.01).
Figure 5
Figure 5
Immunohistochemical analysis of vascular changes. (A) Immunohistochemistry of laminin for vascular volume estimation. Representative close-ups of 20x magnification for each region of interest visualize changes in vessel density. (B) Quantification and subsequent normalization to the intact hemisphere confirms decreased vascular volume in the core region of the cortex but not in the core region of the striatum. Vascular volume increases significantly in the striatal peri-infarct zone (p = 0.03) but does not reach significance in peri-infarct cortex (p = 0.08). Sham animals showed little changes in corresponding areas of the brain. (C–E) Three examples of Z-stacks of representative BrdU+/lectin+newly formed endothelial cells from the peri-infarct striatum (C) and the cortex (D,E). Scale bar 20 μm.
Figure 6
Figure 6
Correlations. (A) Changes of PE within the ischemic hemisphere correlates to VEGFR2 protein changes in the ischemic cortex (ρ = 0.474, p = 0.044). (B) Photon emission increase also correlates to vascular volume changes within the ischemic hemisphere (ρ = 0.817, p < 0.001).

References

    1. Adams R. H., Alitalo K. (2007). Molecular regulation of angiogenesis and lymphangiogenesis. Nat. Rev. Mol. Cell Biol. 8, 464–478 10.1038/nrm2183 - DOI - PubMed
    1. Bahmani P., Schellenberger E., Klohs J., Steinbrink J., Cordell R., Zille M., et al. (2011). Visualization of cell death in mice with focal cerebral ischemia using fluorescent annexin A5, propidium iodide and TUNEL staining. J. Cereb. Blood Flow Metab. 31, 1311–1320 10.1038/jcbfm.2010.233 - DOI - PMC - PubMed
    1. Beck H., Acker T., Wiessner C., Allegrini P. R., Plate K. H. (2000). Expression of angiopoietin-1, angiopoietin-2 and tie receptors after middle cerebral artery occlusion in the rat. Am. J. Pathol. 157, 1473–1483 10.1016/s0002-9440(10)64786-4 - DOI - PMC - PubMed
    1. Beck H., Plate K. H. (2009). Angiogenesis after cerebral ischemia. Acta Neuropathol. 117, 481–496 10.1007/s00401-009-0483-6 - DOI - PubMed
    1. Berger F., Paulmurugan R., Bhaumik S., Gambhir S. S. (2008). Uptake kinetics and biodistribution of 14C-D-luciferin—a radiolabeled substrate for the firefly luciferase catalyzed bioluminescence reaction: impact on bioluminescence based reporter gene imaging. Eur. J. Nucl. Med. Mol. Imaging 35, 2275–2285 10.1007/s00259-008-0870-6 - DOI - PMC - PubMed

LinkOut - more resources