. 2014 Sep 9:8:277.
doi: 10.3389/fncel.2014.00277. eCollection 2014.

Laser-scanning astrocyte mapping reveals increased glutamate-responsive domain size and disrupted maturation of glutamate uptake following neonatal cortical freeze-lesion

Affiliations

Laser-scanning astrocyte mapping reveals increased glutamate-responsive domain size and disrupted maturation of glutamate uptake following neonatal cortical freeze-lesion

Moritz Armbruster et al. Front Cell Neurosci. .

Abstract

Astrocytic uptake of glutamate shapes extracellular neurotransmitter dynamics, receptor activation, and synaptogenesis. During development, glutamate transport becomes more robust. How neonatal brain insult affects the functional maturation of glutamate transport remains unanswered. Neonatal brain insult can lead to developmental delays, cognitive losses, and epilepsy; the disruption of glutamate transport is known to cause changes in synaptogenesis, receptor activation, and seizure. Using the neonatal freeze-lesion (FL) model, we have investigated how insult affects the maturation of astrocytic glutamate transport. As lesioning occurs on the day of birth, a time when astrocytes are still functionally immature, this model is ideal for identifying changes in astrocyte maturation following insult. Reactive astrocytosis, astrocyte proliferation, and in vitro hyperexcitability are known to occur in this model. To probe astrocyte glutamate transport with better spatial precision we have developed a novel technique, Laser Scanning Astrocyte Mapping (LSAM), which combines glutamate transport current (TC) recording from astrocytes with laser scanning glutamate photolysis. LSAM allows us to identify the area from which a single astrocyte can transport glutamate and to quantify spatial heterogeneity in the rate of glutamate clearance kinetics within that domain. Using LSAM, we report that cortical astrocytes have an increased glutamate-responsive area following FL and that TCs have faster decay times in distal, as compared to proximal processes. Furthermore, the developmental shift from GLAST- to GLT-1-dominated clearance is disrupted following FL. These findings introduce a novel method to probe astrocyte glutamate uptake and show that neonatal cortical FL disrupts the functional maturation of cortical astrocytes.

Keywords: GLAST; GLT-1; astrocyte; freeze lesion; glutamate.


Figures

Figure 1
Figure 1
Recording glutamate transporter currents from astrocytes following freeze lesion in a spatially defined manner. (A) Cartoon showing an in-folding of the cortical layer structure following freeze lesion. Whole-cell recordings are made from astrocytes in the paramicrogyral zone from deep cortical layers. A 160 μm square area surrounding the patch-clamped astrocyte is then subjected to laser scanning photostimulation with MNI-glutamate present in the perfusate. (B) fEPSP example trace, with a stimulating electrode in the white matter of the cortex and recording in layer II–III, shows epileptiform activity following Freeze Lesion. (C) An example glutamate laser uncaging trace demonstrating voltage step and glutamate evoked transporter current (black). Addition of the glutamate transport inhibitor TBOA (100 μM) eliminates the glutamate transporter current (red). (D) In order to map the astrocytic glutamate domain of individual astrocytes, we establish a whole-cell patch configuration of a SR-101 labeled astrocyte. Using a laser-scanning photostimulation system, we spatially modulated the location of uncaging. A large glutamate evoked current is recorded when uncaging occurs within the domain of an astrocyte, while an off-domain uncaging evokes a minimal current.
Figure 2
Figure 2
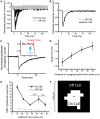
Identifying the glutamate responsive area for individual astrocytes. (A) a representative astrocyte (P29 Sham), showing a subset of glutamate evoked transporter currents segregated into the On-domain (black) and Off-domain (gray) responses. Locations were grouped area based on onset time of the glutamate current (see methods). Each trace is an average of 3 uncaging trails on the same uncaging location. 55 traces were On-domain and 45 traces were Off-domain. (B) Average On-cell and Off-domain responses of the cell pictured in A. Off-domain average shows small glutamate evoked currents with a delayed onset time suggesting indirect activation of glutamate transporters. (C) An example glutamate uncaging trace with a piecewise function fit to estimate the onset time of the glutamate evoked current. (D) Onset times scale with distance between the uncaging spot and the soma. N = 33 cells, P26–34 Sham, with 850 uncaging traces overall. (E) Signal to noise ratio of glutamate current across distance from the soma, for On and Off cell locations, demonstrating that the On-domain currents remain above the noise. N = 33 cells, P26–34 Sham cells. (F) Example glutamate responsive map of a mature sham astrocyte. 22 responsive spots out of 100 total spots. Average spacing 16.4 μm between spots, red dot marks approximate soma location.
Figure 3
Figure 3
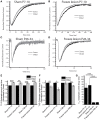
Characterizing the specificity of spatial glutamate uncaging. (A) In order to control for possible glutamate evoked current coming from gap junction coupled neighboring cells, we compared On and Off cell responses before (black and gray) and after the application of the gap junction inhibitor MFA (100 μM, red and pink). No difference is seen in On or Off cell traces after application of MFA. N = 10 cells. (B) For the cells in A, the glutamate responsive area was quantified. No significant difference was seen following the application of MFA, paired t-test p > 0.6. (C) In order to control for the glutamate sensitivity of the assay, we mapped cells at normal (black and gray) and 2X normal laser uncaging power (red and pink). N = 6 cells. (D) For the cells in C, the glutamate responsive area was quantified, no significant difference is seen, paired t-test p > 0.07.
Figure 4
Figure 4
Mapping glutamate responsive domains. A 10 × 10 grid of uncaging locations around the patched astrocyte, with 16.4 μm spacing between locations and a 10um spot size enables the characterization of the glutamate responsive domain of individual astrocytes. (A) Single cell example maps of glutamate responsive domains. White squares represent an On-domain response at the given location, a Black square represents an Off-domain response based upon the glutamate evoked current. The red dot marks approximate soma location. (B) Average glutamate response maps. Grayscale from White (all cells responsive) to Black (no cells responsive). (C) Quantification of the glutamate responsive area pictured in B. Box and whisker plots, whiskers (min/max), box 25, 50, 75% quartiles, and square (mean). Astrocytes increase their glutamate responsive domain through development, and FL P26–34 astrocytes show a significantly increased glutamate responsive area compared to sham. One way log corrected Anova, Bonferroni test. Sham P7–10 vs. FL P7–10 p > 0.3, Sham P7–10 vs. Sham P26–34 p < 0.0007, FL P7–10 vs. FL P26–34 p < 0.008, FLP26–34 vs. Sham P26–34 p < 0.02. (D) The fraction of uncaging spots that are responsive (On-domain) based on the distance from the soma for all conditions. 24–300 uncaging spots per condition, N = 13, 9, 36, 19 cells for Sham P7–10, FL P7–10, Sham P26–34, and FL P26–34 respectively. Sham vs. FL P7–10 p < 0.008 (15–30 μm), p < 0.004 (45–60 μm) Sham vs. FL P26–34 p < 0.0001 (15–30, 30–45, 45–60 μm), p < 0.03 (60–75 μm), Fisher exact test. *p < 0.05, **p < 0.01, ***p < 0.001 tests as described.
Figure 5
Figure 5
Astrocyte density following freeze lesion. Using human EAAT2 promoter driven tdTomato reporter mice (A), the number of astrocyte cell bodies in the paramicrogyral zone adjacent to the lesion in layers IV–V (B) and Layers II–III (C) were quantified in P27–29 Sham and FL mice. Deep layers showed a significant decrease in astrocyte density p < 0.03, while layers II–III showed no significant difference in astrocyte density p > 0.5, two sample t-test N = 3 Sham, N = 5 FL mice Scale bar 100 μm. *p < 0.05 t-test.
Figure 6
Figure 6
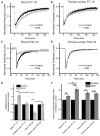
Kinetic changes between somatic and distal glutamate clearance. Example traces for Somatic (Black) and Distal (Gray) glutamate evoked transporter currents, normalized to peak, for (A) Sham P7–10, (B) Freeze Lesion P7–10, (C) Sham P26–34, and (D) Freeze Lesion P26–34 (E) The rise-time of the transporter current is significantly slowed in all conditions, paired t-test p < 0.0003, p < 0.007, p < 0.0003, and p < 0.000003, and N = 11, 9, 26, and 18 cells for Sham P7–10, Freeze Lesion P7–10, Sham P26–34, and Freeze Lesion P26–34. (F) T1/2 of evoked glutamate current decay is representative of glutamate clearance. Distal (uncaging location >20 um from soma) transporter currents show faster decay than somatic currents except for Sham P26–34, which showed no significant difference. Log corrected paired t-test p < 0.002, p < 0.02, p > 0.25, p < 0.006 for Sham P7–10, Freeze Lesion P7–10, Sham P26–34, and Freeze Lesion P26–34, respectively. (G) Changes in currents through development. T1/2 of glutamate current decay kinetics show no difference between Sham and Freeze lesion at neonatal timepoints and mature timepoints, but are accelerated through development. Sham P7–10 vs. P26–34, p < 3* 10−11; FL P7–10 vs. P26–34 p < 2* 10−7 log corrected ANOVA Bonferroni test. *p < 0.05, **p < 0.01, ***p < 0.001 tests as described.
Figure 7
Figure 7
Freeze lesion alters EAAT subtype-specific functional maturation in astrocytes. Somatic glutamate evoked traces are recorded before and after the application of the GLT-1 inhibitor DHK (300 μM), for (A) Sham P7–10, (B) Freeze Lesion P7–10, (C) Sham P26–34, and (D) Freeze Lesion P26–34. Average of N = 10, 8, 5, and 10 cells respectively. (E) Integrated glutamate evoked currents, normalized to control, shows a significant increase following DHK application in Sham P7–10 astrocytes p < 0.02. Sham P26–34 shows a significant decrease in integrated current p < 0.02. The effects of DHK on integrated TC current are significantly different between neonatal and mature sham astrocytes and between mature FL and sham astrocytes. log corrected ANOVA Bonferroni test (F) Centroids of glutamate evoked currents of P7–10 and P26–34 Sham and Freeze lesion show slowing of glutamate reuptake following DHK application. P7–10 Sham p < 0.007, P7–10 Freeze lesion p < 0.0006, P26–34 Sham p < 0.02, P26–34 Freeze Lesion p < 4* 10−6 log corrected paired t-test. P7–10 Freeze lesion astrocytes show an enhanced slowing compared to P7–10 sham following DHK application p < 0.02 two sample t-test. *p < 0.05, **p < 0.01, ***p < 0.001 tests as described.
Figure 8
Figure 8
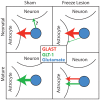
Glutamate transporter utilization through development. Based on our findings, we postulate the following mechanism for the utilization of EAATs in clearing uncaged glutamate. In the sham-lesioned condition, neonatal uptake is largely mediated by GLAST in astrocytes with some possible contribution by neuronal (or other non-astrocytic) GLT-1. As astrocytes mature, they rely heavily on GLT-1 instead of GLAST. In the FL cortex, neonatal astrocytes utilize more GLT-1-dependent transport. In the mature FL cortex, astrocytes use robust GLT-1 and GLAST function to remove glutamate.

References

    1. Andresen L., Hampton D., Taylor A., Morel L., Yang Y., Maguire J., et al. (2014). Gabapentin attenuates hyperexcitability in the free-lesion model of developmental cortical malformation. Neurobiol. Dis. [Epub ahead of print]. 10.1016/j.nbd.2014.08.022 - DOI - PMC - PubMed
    1. Arriza J., Fairman W., Wadiche J., Murdoch G., Kavanaugh M., Amara S. (1994). Functional comparisons of three glutamate transporter subtypes cloned from human motor cortex. J. Neurosci. 14, 5559–5569 - PMC - PubMed
    1. Bell A., Jacobs K. (2014). Early susceptibility for epileptiform activity in malformed cortex. Epilepsy Res. 108, 241–250 10.1016/j.eplepsyres.2013.11.021 - DOI - PMC - PubMed
    1. Bergles D., Tzingounis A., Jahr C. (2002). Comparison of coupled and uncoupled currents during glutamate uptake by GLT-1 transporters. J. Neurosci. 22, 10153–10162 - PMC - PubMed
    1. Bernardinelli Y., Haeberli C., Chatton J. Y. (2005). Flash photolysis using a light emitting diode: an efficient, compact, and affordable solution. Cell Calcium 37, 565–572 10.1016/j.ceca.2005.03.001 - DOI - PubMed