. 2014 Sep 5:5:453.
doi: 10.3389/fmicb.2014.00453. eCollection 2014.

Feedbacks between protistan single-cell activity and bacterial physiological structure reinforce the predator/prey link in microbial foodwebs

Affiliations

Feedbacks between protistan single-cell activity and bacterial physiological structure reinforce the predator/prey link in microbial foodwebs

Eva Sintes et al. Front Microbiol. .

Abstract

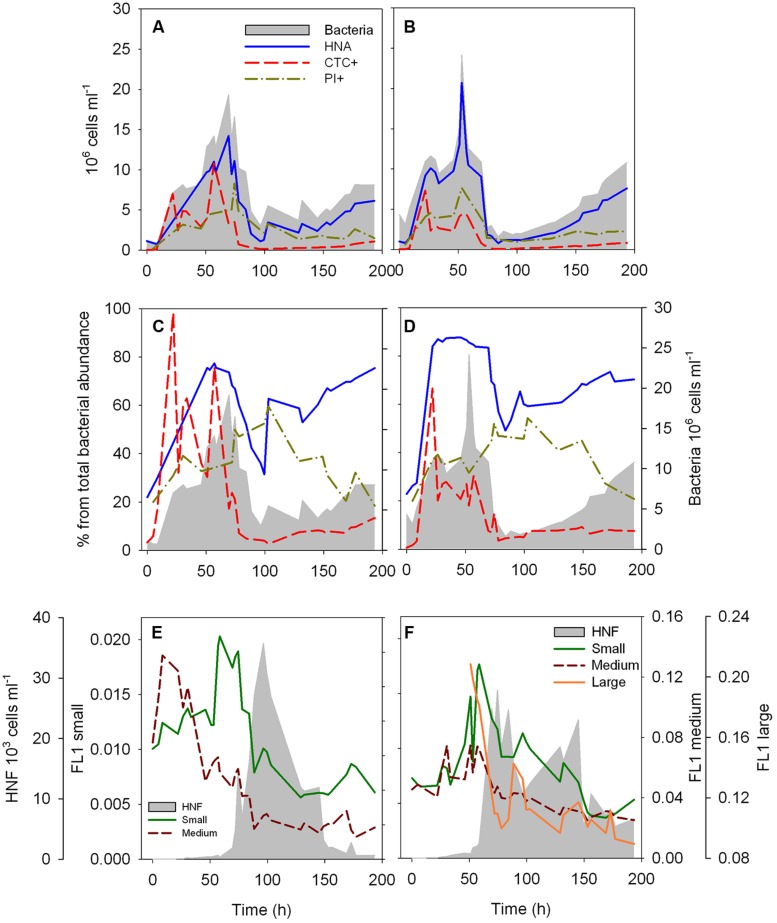
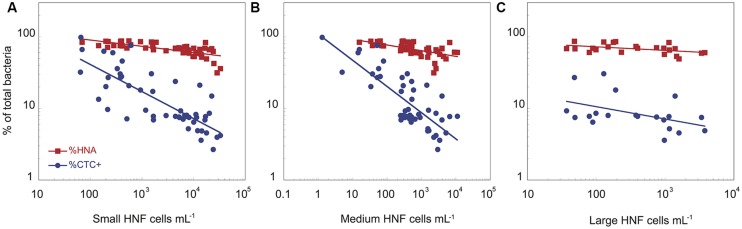
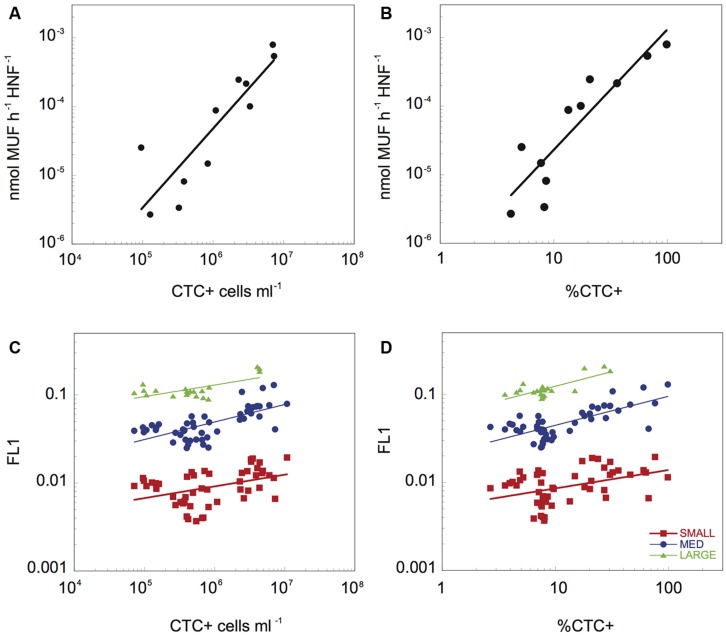
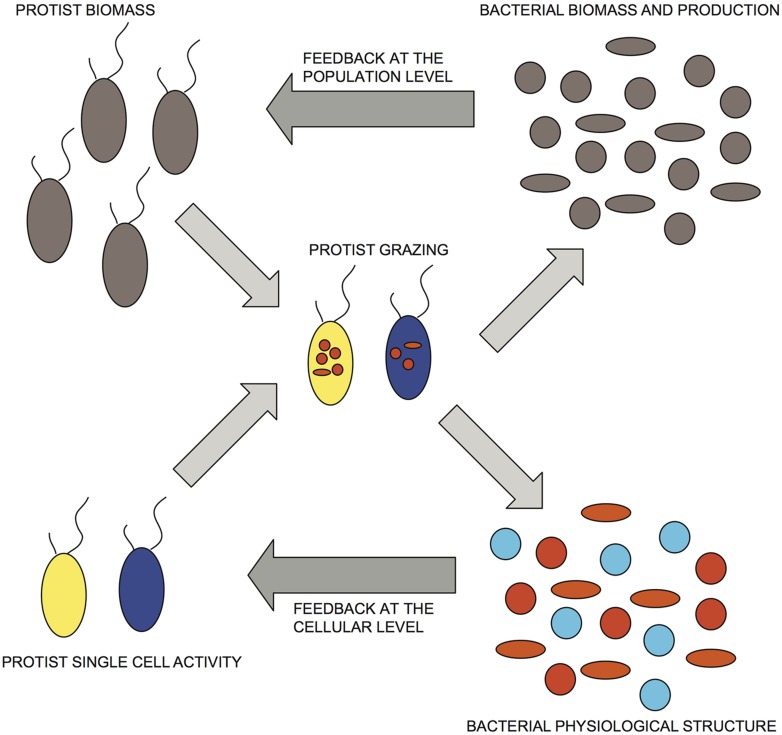
The trophic interactions between bacteria and their main predators, the heterotrophic nanoflagellates (HNFs), play a key role in the structuring and functioning of aquatic microbial food webs. Grazing regulation of bacterial communities, both of biomass and community structure, have been frequently reported. Additionally, bottom-up responses of the HNF at the population level (numerical responses) have also been extensively described. However, the functional response of HNF at the single-cell level has not been well explored. In this study, we concurrently measured the physiological structure of bacterial communities and HNF single-cell activities during re-growth cultures of natural aquatic communities. We found that changes in the abundance and proportion of the preferred, highly active bacterial prey, caused by the feeding activity of their predators (HNF), induced a negative feedback effect on the single-cell activity of these HNF. These shifts in the specific cellular activity of HNF occur at a much shorter time scale than population level shifts in flagellate abundance, and offer a complementary mechanism to explain not only the tight coupling between bacteria and HNF, but also the relative constancy of bacterial abundance in aquatic ecosystems.

Keywords: aquatic food webs; feedbacks; functional response; heterotrophic bacteria; heterotrophic nanoflagellates; predator-prey link; single-cell activity.


Figures

FIGURE 1
FIGURE 1
Dynamics of the abundance (A,B) and proportion (C,D) of HNA, CTC+ and membrane compromised (PI+) cells over the time course of the two re-growth cultures, and dynamics of the fluorescence characteristics of the different HNF populations over the time course of the two re-growth cultures (E,F). The intensity of the green fluorescence (FL1) associated to LysoTracker Green of each HNF population is used as a proxy of single-cell digestive activity. Total bacterial and total HNF abundance (gray area) are plotted as a reference (Data of total bacterial and HNF abundance for the culture 2, B,D,F, was previously presented in Sintes and del Giorgio, 2010).
FIGURE 2
FIGURE 2
The relationships between the abundance of small (A), medium (B), and large (C) heterotrophic flagellates and the proportion of HNA and CTC+ bacterial cells for the two cultures. The data have been log-transformed.
FIGURE 3
FIGURE 3
The relationship between β-Gam activity per HNF cell and the abundance (A) and proportion of CTC+ cells (B), and relationship between the average green fluorescence (FL1) associated to the three different HNF populations and the abundance (C) and proportion (D) of CTC+ cells. The data have been log-transformed.
FIGURE 4
FIGURE 4
Conceptual representation of bacterial/HNF interactions that incorporate both numerical and functional responses. Dark-gray arrows indicate proposed feedbacks at the population and cellular levels. Bacterial physiological structure, cell activity: red > orange > blue; protist single-cell activity: yellow > blue.
Figure A1
Figure A1
Dynamics of the abundance of small, medium, and large HNF cells over the time course of the two re-growth cultures (A,B). Data from culture 2 was previously presented in Figure 9 from Sintes and del Giorgio (2010).

Similar articles

Cited by

References

    1. Alonso C., Pernthaler J. (2006). Roseobacter and SAR11 dominate microbial glucose uptake in coastal North Sea waters. Environ. Microbiol. 8 2022–2030 10.1111/j.1462-2920.2006.01082.x - DOI - PubMed
    1. Andersen P., Sorensen H. M. (1986). Population-dynamics and trophic coupling in pelagic microorganisms in eutrophic coastal waters. Mar. Ecol. Prog. Ser. 33 99–109 10.3354/meps033099 - DOI
    1. Andersson A., Larsson U., Hagstrom A. (1986). Size-selective grazing by a microflagellate on pelagic bacteria. Mar. Ecol. Prog. Ser. 33 51–57 10.3354/meps033051 - DOI
    1. Bakalara N., Seyfang A., Davis C., Baltz T. (1995). Characterization of a life-cycle-stage-regulated membrane protein tyrosine phosphatase in Tripanosoma brucei. Eur. J. Biochem. 234 871–877 10.1111/j.1432-1033.1995.871_a.x - DOI - PubMed
    1. Baker S. C., Ferguson S. J., Ludwig B., Page M. D., Richter O. M. H., Van Spanning R. J. M. (1998). Molecular genetics of the genus Paracoccus: metabolically versatile bacteria with bioenergetic flexibility. Microbiol. Mol. Biol. Rev. 62 1046–1078 - PMC - PubMed

LinkOut - more resources