

Thy1-GCaMP6 transgenic mice for neuronal population imaging in vivo
- PMID: 25250714
- PMCID: PMC4177405
- DOI: 10.1371/journal.pone.0108697
Thy1-GCaMP6 transgenic mice for neuronal population imaging in vivo
Abstract
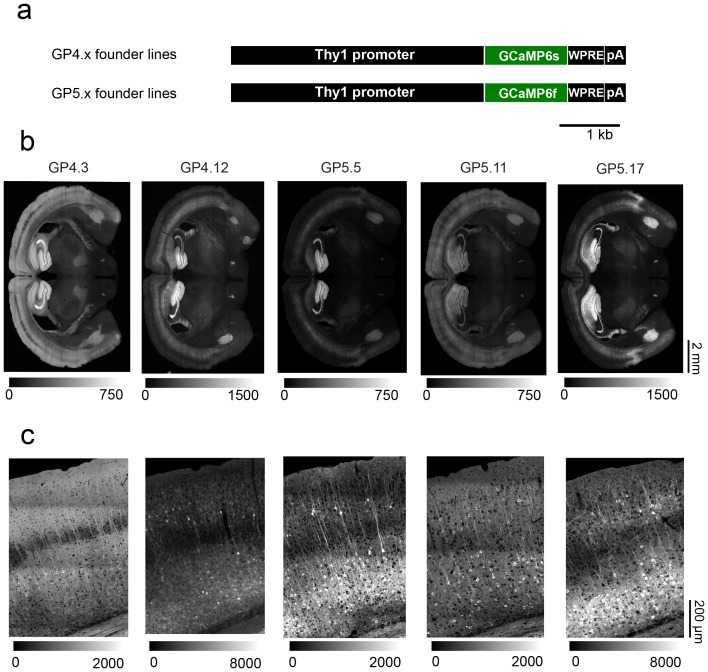
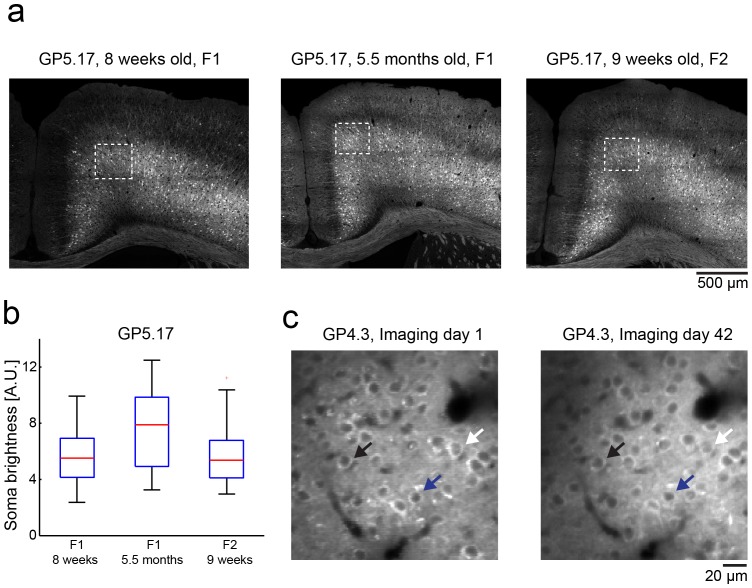
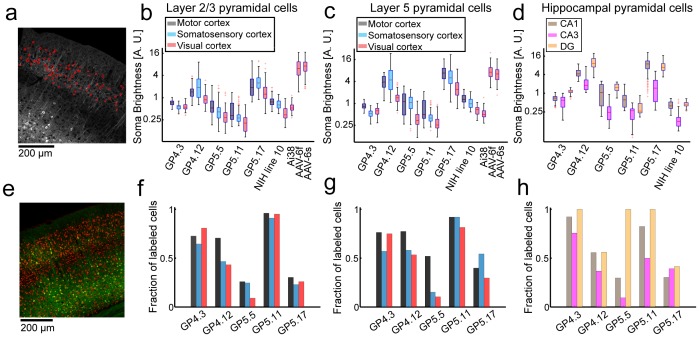
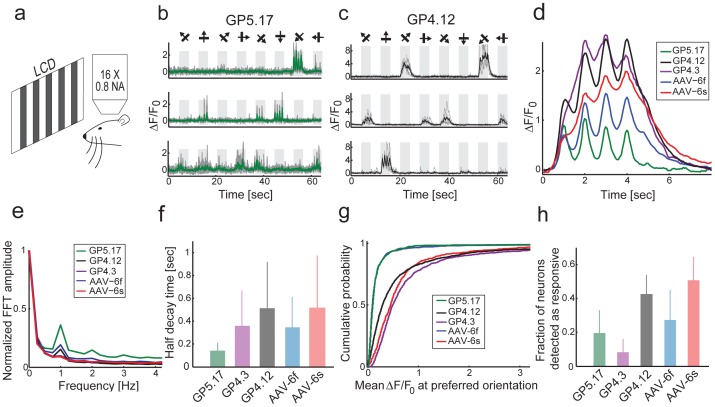
Genetically-encoded calcium indicators (GECIs) facilitate imaging activity of genetically defined neuronal populations in vivo. The high intracellular GECI concentrations required for in vivo imaging are usually achieved by viral gene transfer using adeno-associated viruses. Transgenic expression of GECIs promises important advantages, including homogeneous, repeatable, and stable expression without the need for invasive virus injections. Here we present the generation and characterization of transgenic mice expressing the GECIs GCaMP6s or GCaMP6f under the Thy1 promoter. We quantified GCaMP6 expression across brain regions and neurons and compared to other transgenic mice and AAV-mediated expression. We tested three mouse lines for imaging in the visual cortex in vivo and compared their performance to mice injected with AAV expressing GCaMP6. Furthermore, we show that GCaMP6 Thy1 transgenic mice are useful for long-term, high-sensitivity imaging in behaving mice.
Conflict of interest statement
Figures
Similar articles
-
Thy1 transgenic mice expressing the red fluorescent calcium indicator jRGECO1a for neuronal population imaging in vivo.PLoS One. 2018 Oct 11;13(10):e0205444. doi: 10.1371/journal.pone.0205444. eCollection 2018. PLoS One. 2018. PMID: 30308007 Free PMC article.
-
GCaMP as an indirect measure of electrical activity in rat trigeminal ganglion neurons.Cell Calcium. 2020 Jul;89:102225. doi: 10.1016/j.ceca.2020.102225. Epub 2020 May 30. Cell Calcium. 2020. PMID: 32505783 Free PMC article.
-
Imaging neuronal activity in the central and peripheral nervous systems using new Thy1.2-GCaMP6 transgenic mouse lines.J Neurosci Methods. 2020 Mar 15;334:108535. doi: 10.1016/j.jneumeth.2019.108535. Epub 2020 Jan 20. J Neurosci Methods. 2020. PMID: 31972184 Free PMC article.
-
Neural activity imaging with genetically encoded calcium indicators.Prog Brain Res. 2012;196:79-94. doi: 10.1016/B978-0-444-59426-6.00005-7. Prog Brain Res. 2012. PMID: 22341322 Review.
-
Genetically encoded calcium indicators to probe complex brain circuit dynamics in vivo.Neurosci Res. 2021 Aug;169:2-8. doi: 10.1016/j.neures.2020.05.013. Epub 2020 Jun 9. Neurosci Res. 2021. PMID: 32531233 Review.
Cited by
-
Sensory and decision-related activity propagate in a cortical feedback loop during touch perception.Nat Neurosci. 2016 Sep;19(9):1243-9. doi: 10.1038/nn.4356. Epub 2016 Jul 20. Nat Neurosci. 2016. PMID: 27437910 Free PMC article.
-
Experimental and Computational Study on Motor Control and Recovery After Stroke: Toward a Constructive Loop Between Experimental and Virtual Embodied Neuroscience.Front Syst Neurosci. 2020 Jul 7;14:31. doi: 10.3389/fnsys.2020.00031. eCollection 2020. Front Syst Neurosci. 2020. PMID: 32733210 Free PMC article.
-
Decontaminate Traces From Fluorescence Calcium Imaging Videos Using Targeted Non-negative Matrix Factorization.Front Neurosci. 2022 Jan 21;15:797421. doi: 10.3389/fnins.2021.797421. eCollection 2021. Front Neurosci. 2022. PMID: 35126042 Free PMC article.
-
Phase advancing is a common property of multiple neuron classes in the mouse retina.eNeuro. 2022 Aug 22;9(5):ENEURO.0270-22.2022. doi: 10.1523/ENEURO.0270-22.2022. Online ahead of print. eNeuro. 2022. PMID: 35995559 Free PMC article.
-
Optimizing Strategies for Developing Genetically Encoded Voltage Indicators.Front Cell Neurosci. 2019 Feb 26;13:53. doi: 10.3389/fncel.2019.00053. eCollection 2019. Front Cell Neurosci. 2019. PMID: 30863283 Free PMC article. Review.
References
-
- Horikawa K, Yamada Y, Matsuda T, Kobayashi K, Hashimoto M, et al. (2010) Spontaneous network activity visualized by ultrasensitive Ca(2+) indicators, yellow Cameleon-Nano. Nature methods 7: 729–732. - PubMed
Publication types
MeSH terms
Substances
Grants and funding
LinkOut - more resources
Full Text Sources
Other Literature Sources
Molecular Biology Databases
Miscellaneous
