

Serum complement C3f and fibrinopeptide A are potential novel diagnostic biomarkers for non-alcoholic fatty liver disease: a study in Qingdao Twins
- PMID: 25250770
- PMCID: PMC4176972
- DOI: 10.1371/journal.pone.0108132
Serum complement C3f and fibrinopeptide A are potential novel diagnostic biomarkers for non-alcoholic fatty liver disease: a study in Qingdao Twins
Abstract
Aims: To compare the different serum peptidome patterns between twins with and without non-alcoholic fatty liver disease (NAFLD) in order to help understand the pathogenesis of NAFLD and to identify potential diagnostic and therapeutic targets.
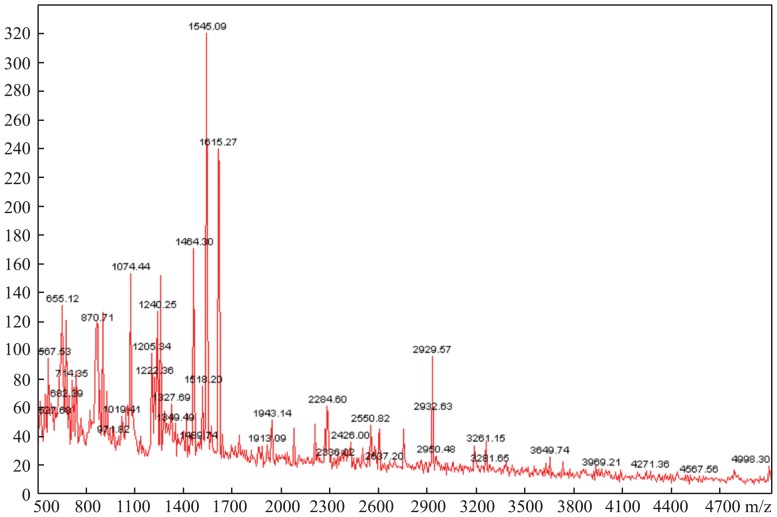
Methods: The peptidomics patterns of 63 cases with NAFLD were compared with their twin healthy controls in Qingdao, China. Peptides between 800 Da and 3,500 Da were captured and concentrated using C18 reversed-phase columns, followed by MALDI-TOF mass spectrometry. The sequences of peptides associated with NAFLD were further identified by MALDI-TOF-TOF. Further validation studies were conducted. One hundred additional serum samples were detected by commercially available ELISA kits to calculate the concentrations of complement C3f and fibrinopeptide A, respectively. The differences of these two peptides in the NAFLD and control groups were compared using SPSS 17.0, respectively.
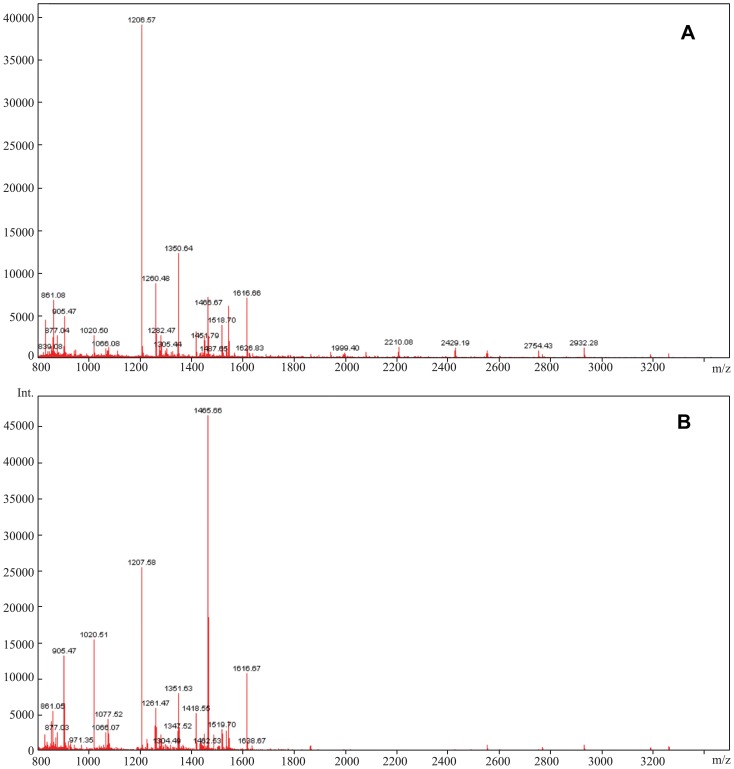
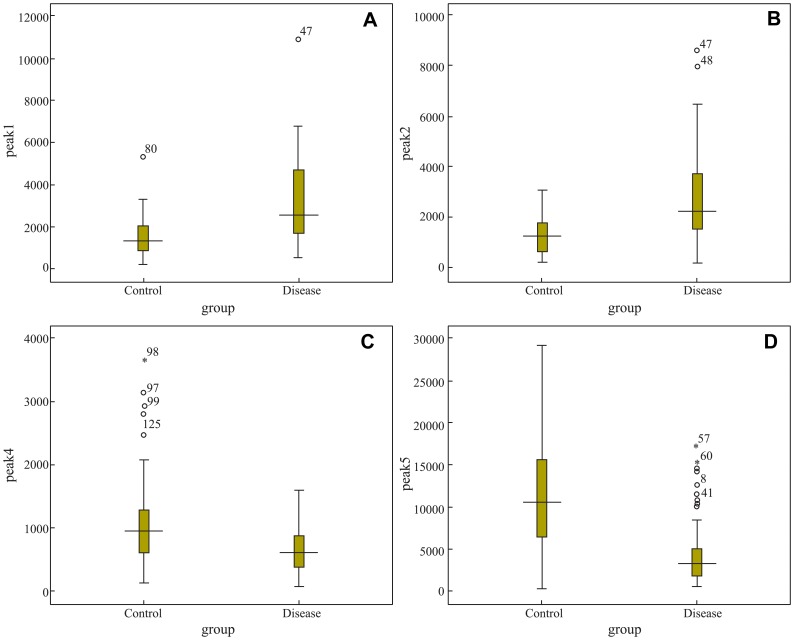
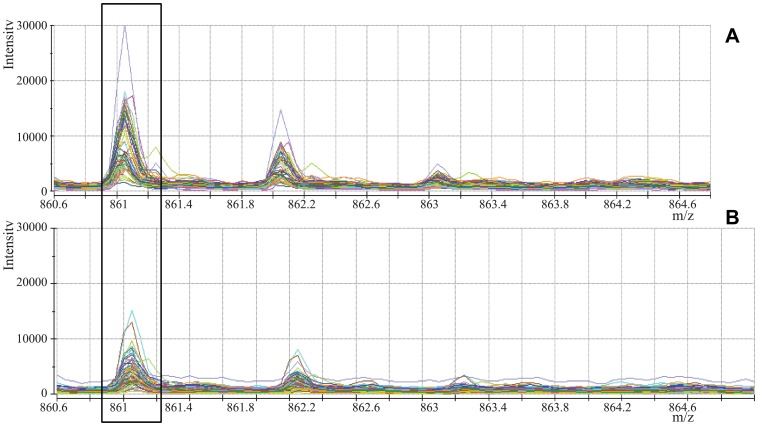
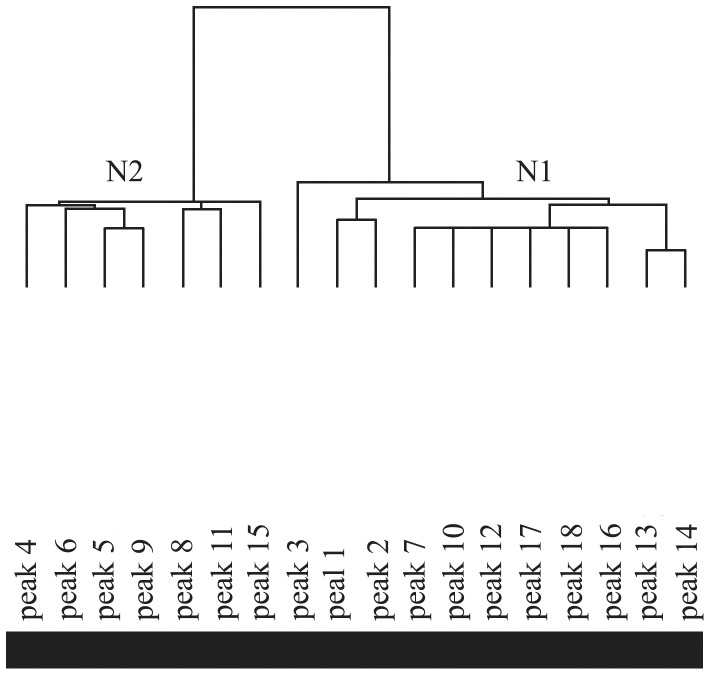
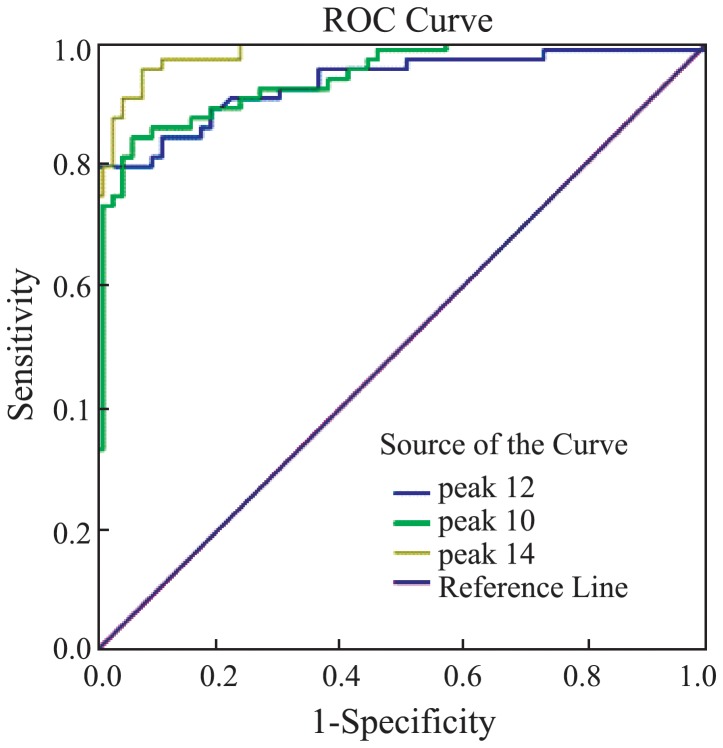
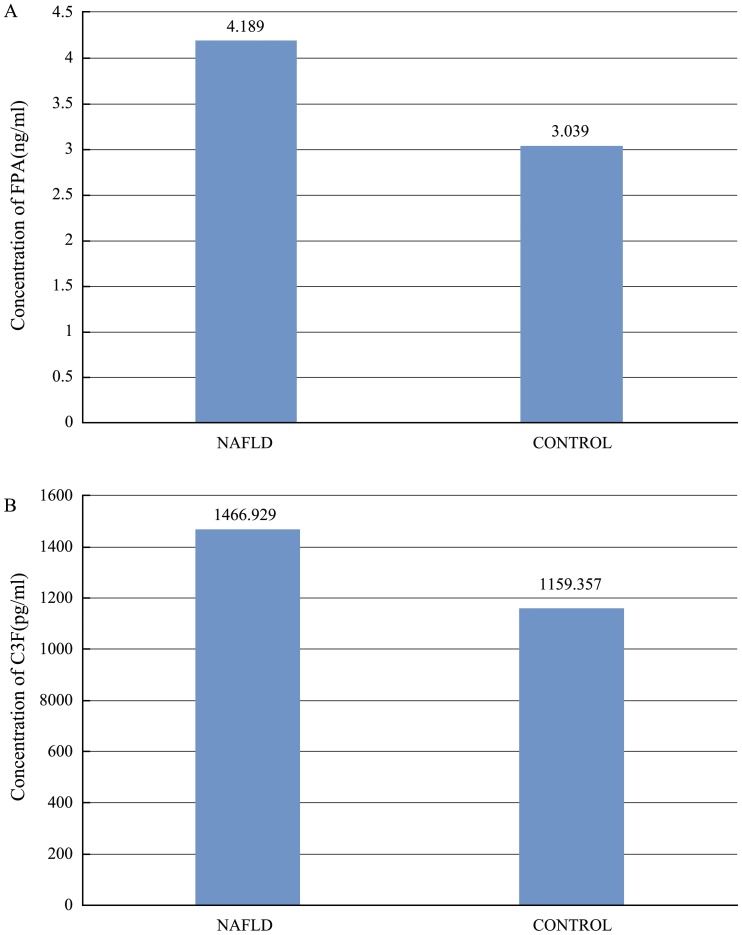
Results: Compared with healthy controls, eleven peaks (861.1, 877.07, 904.5, 1206.57, 1350.64, 1518.7, 1690.9, 1777.94, 2931.29, 3190.4, 3261.4) were up-regulated and 7 peaks (942.44, 1020.47, 1060.06, 1211.7, 1263.63, 1449.76, 2768.3) were down-regulated in the NAFLD group. Two peptides derived from complement C3f and fibrinopeptide A, respectively, had the highest ROC values indistinguishing NAFLD cases from their normal controls. In the validation group, the concentrations of complement C3f and fibrinopeptide A (1466.929 ± 78.306 pg/ml, 4.189 ± 0.326 ng/ml, respevtively) in NAFLD group was higher than in control group (complement C3f 1159.357 ± 99.624 pg/ml, FPA 3.039 ± 0.483 ng/ml; P<0.05).
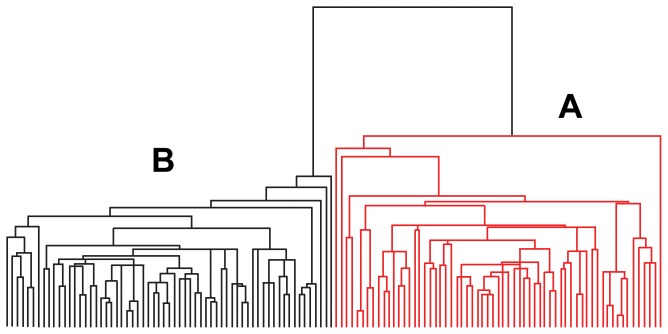
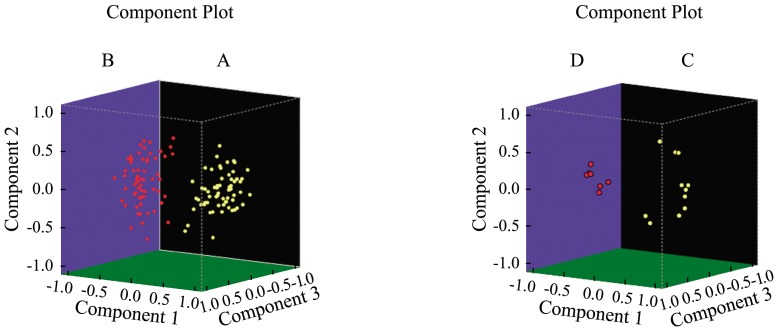
Conclusions: In this study, we established apeptidomics pattern that could help distinguish NAFLD patients from their twin controls. The differently-regulated peptides identified in our study may be potential diagnostic markers or therapeutic targets for NAFLD.
Conflict of interest statement
Figures
Similar articles
-
Profiling of schizophrenia-associated serum peptides by MALDI-TOF-MS.J Neural Transm (Vienna). 2020 Jan;127(1):95-101. doi: 10.1007/s00702-019-02108-7. Epub 2019 Nov 30. J Neural Transm (Vienna). 2020. PMID: 31786691
-
Diagnostic value of alcoholic liver disease (ALD)/nonalcoholic fatty liver disease (NAFLD) index combined with γ-glutamyl transferase in differentiating ALD and NAFLD.Korean J Intern Med. 2016 May;31(3):479-87. doi: 10.3904/kjim.2015.253. Epub 2016 Mar 30. Korean J Intern Med. 2016. PMID: 27025268 Free PMC article.
-
Serum microRNAs explain discordance of non-alcoholic fatty liver disease in monozygotic and dizygotic twins: a prospective study.Gut. 2016 Sep;65(9):1546-54. doi: 10.1136/gutjnl-2015-309456. Epub 2015 May 22. Gut. 2016. PMID: 26002934 Free PMC article.
-
miRNAs in patients with non-alcoholic fatty liver disease: A systematic review and meta-analysis.J Hepatol. 2018 Dec;69(6):1335-1348. doi: 10.1016/j.jhep.2018.08.008. Epub 2018 Aug 22. J Hepatol. 2018. PMID: 30142428
-
Diagnosis of Non-alcoholic Fatty Liver Disease (NAFLD): Current Concepts.Curr Pharm Des. 2018;24(38):4574-4586. doi: 10.2174/1381612825666190117102111. Curr Pharm Des. 2018. PMID: 30652642 Review.
Cited by
-
Oxidised Apolipoprotein Peptidome Characterises Metabolic Dysfunction-Associated Steatotic Liver Disease.Liver Int. 2025 Feb;45(2):e16200. doi: 10.1111/liv.16200. Liver Int. 2025. PMID: 39822152 Free PMC article.
-
4210 Da and 1866 Da polypeptides as potential biomarkers of liver disease progression in hepatitis B virus patients.Sci Rep. 2021 Aug 20;11(1):16982. doi: 10.1038/s41598-021-96581-4. Sci Rep. 2021. PMID: 34417517 Free PMC article.
-
Profiling of schizophrenia-associated serum peptides by MALDI-TOF-MS.J Neural Transm (Vienna). 2020 Jan;127(1):95-101. doi: 10.1007/s00702-019-02108-7. Epub 2019 Nov 30. J Neural Transm (Vienna). 2020. PMID: 31786691
-
Fibrinopeptide a promotes the proliferation and migration of vascular smooth muscle cells by regulating the integrin αVβ3/PI3K/AKT signaling pathway.Mol Biol Rep. 2025 Feb 5;52(1):205. doi: 10.1007/s11033-025-10314-8. Mol Biol Rep. 2025. PMID: 39907881
-
Proteomic screening of plasma identifies potential noninvasive biomarkers associated with significant/advanced fibrosis in patients with nonalcoholic fatty liver disease.Biosci Rep. 2020 Jan 31;40(1):BSR20190395. doi: 10.1042/BSR20190395. Biosci Rep. 2020. PMID: 31860081 Free PMC article.
References
-
- Toshimitsu K, Matsuura B, Ohkubo I, Niiya T, Furukawa S, et al. (2007) Dietary habits and nutrient intake in non-alcoholic steatohepatitis. Nutrition 23: 46–52. - PubMed
-
- Musso G, Gambino R, Pacini G, De Michieli F, Cassader M (2009) Prolonged saturated fat-induced, glucose-dependent insulinotropic polypeptide elevation is associated with adipokine imbalance and liver injury in nonalcoholic steatohepatitis: dysregulatedenteroadipocyte axis as a novel feature of fatty liver. Am J ClinNutr 89: 558–567. - PubMed
-
- Nomura K, Yamanouchi T (2012) The role of fructose-enriched diets in mechanisms of nonalcoholic fatty liver disease. J NutrBiochem 23: 203–208. - PubMed
-
- Sanyal AJ, Campbell-Sargent C, Mirshahi F, Rizzo WB, Contos MJ, et al. (2001) Nonalcoholic steatohepatitis: association of insulin resistance and mitochondrial abnormalities. Gastroenterology 120: 1183–1192. - PubMed
-
- Yang HY, Tzeng YH, Chai CY, Hsieh AT, Chen JR, et al. (2011) Soy protein retards the progression of non-alcoholic steatohepatitis via improvement of insulin resistance and steatosis. Nutrition 27: 943–948. - PubMed
Publication types
MeSH terms
Substances
LinkOut - more resources
Full Text Sources
Other Literature Sources
Medical
