

Role of actin filaments in correlating nuclear shape and cell spreading
- PMID: 25251154
- PMCID: PMC4177564
- DOI: 10.1371/journal.pone.0107895
Role of actin filaments in correlating nuclear shape and cell spreading
Erratum in
-
Correction: Role of actin filaments in correlating nuclear shape and cell spreading.PLoS One. 2015 Mar 23;10(3):e0119076. doi: 10.1371/journal.pone.0119076. eCollection 2015. PLoS One. 2015. PMID: 25799051 Free PMC article. No abstract available.
Abstract
It is well known that substrate properties like stiffness and adhesivity influence stem cell morphology and differentiation. Recent experiments show that cell morphology influences nuclear geometry and hence gene expression profile. The mechanism by which surface properties regulate cell and nuclear properties is only beginning to be understood. Direct transmission of forces as well as chemical signalling are involved in this process. Here, we investigate the formal aspect by studying the correlation between cell spreading and nuclear deformation using Mesenchymal stem cells under a wide variety of conditions. It is observed that a robust quantitative relation holds between the cell and nuclear projected areas, irrespective of how the cell area is modified or when various cytoskeletal or nuclear components are perturbed. By studying the role of actin stress fibers in compressing the nucleus we propose that nuclear compression by stress fibers can lead to enhanced cell spreading due to an interplay between elastic and adhesion factors. The significance of myosin-II in regulating this process is also explored. We demonstrate this effect using a simple technique to apply external compressive loads on the nucleus.
Conflict of interest statement
Figures
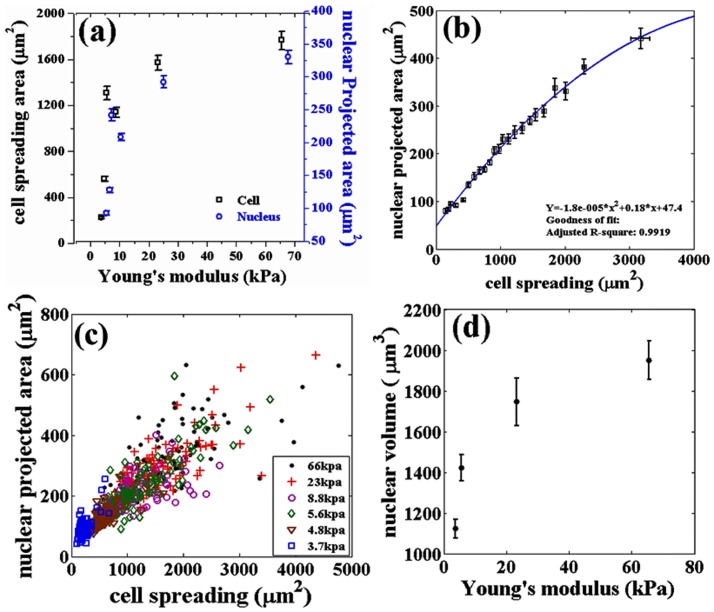
 is calculated using the curve fitting toolbox, MATLAB. (c) Scatter plot (raw data) of the two areas of individual cells obtained from different substrates (same data as in a and b). Note that the range of measured cell area increases with substrate stiffness. (d) Nuclear volume as a function of the elastic modulus of the substrate measured from confocal stacks as describes in the text (20 cells for each data point). Error bars in all the plots represent mean
  standard error (SE).
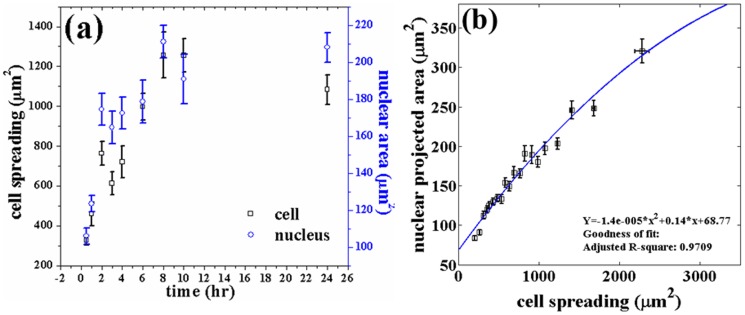
 is calculated using the curve fitting toolbox, MATLAB. Note, the difference in maximum spread area between the two figures arises due to this pooling and binning of data according to cell spread area. The smooth line is the fit from Fig. 1 given for the sake of comparison. The error bars in (a) and (b) are mean
  SE.
SE.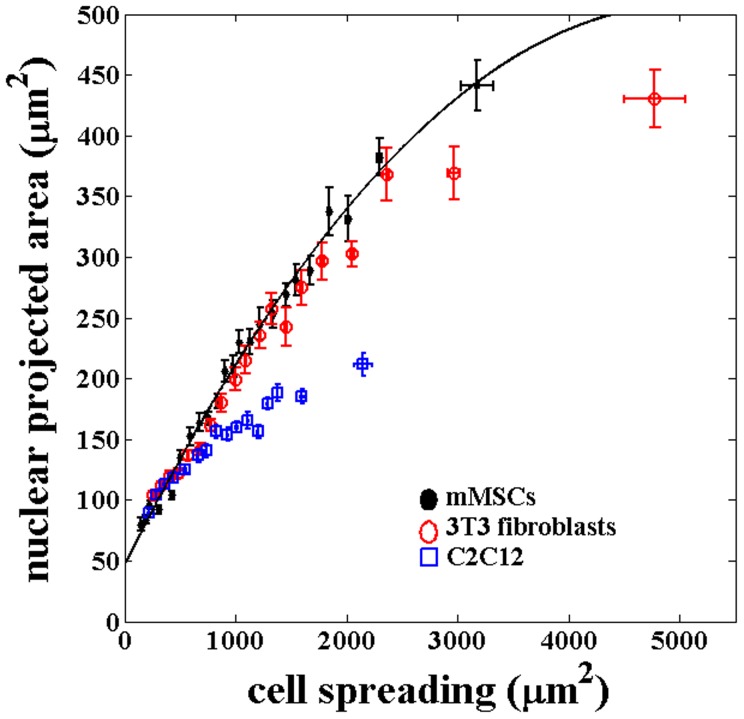
 SE. The correlated behavior between cell and nuclear projected area seem to be roughly intact even across these different cell types although the nuclear projected areas is reaching saturation at different values.
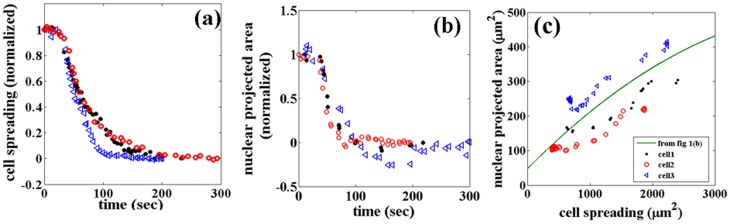
 . (c) Variation in nuclear projected area as a function of cell spreading for the same cells. The line is the same fit as in Fig. 1b, and is plotted for comparison. In some cases nuclear area shows an undershoot where the area decreases below the final value as seen in (b). Moreover, in some cases cell shrinkage precedes nuclear shrinkage as can be seen in (c).
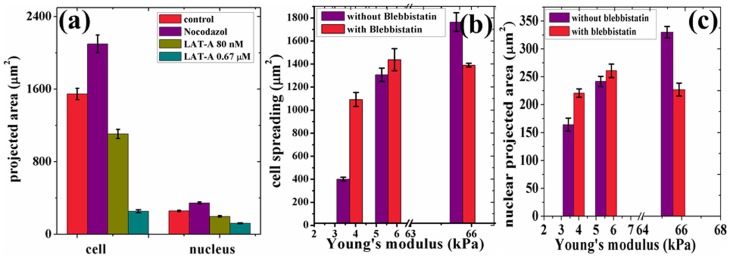
 and the comparison is with control for (a) and with 65 kPa substrate for (b).
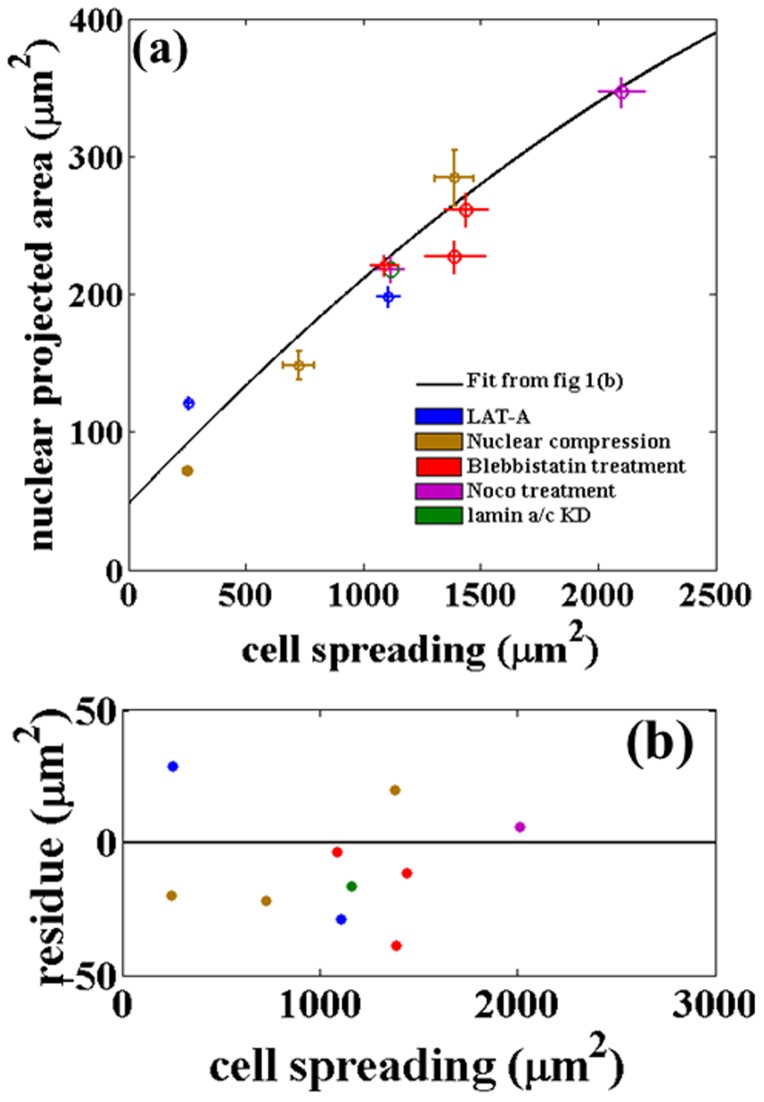
 SE. (b) Residue plot for the data in (a). The residue plot shows the extend of deviations of the data obtained after perturbations from the fit obtained for the unperturbed cells. The agreement is remarkable considering the fact that perturbation experiments, although performed using specific drugs, lead to global reorganization of cellular components.
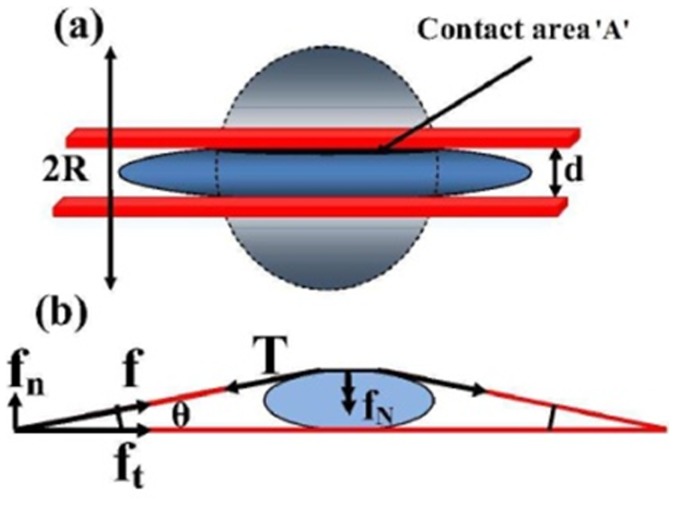
 . After loading the contact area with the plate is
  and the nuclear height is
  . (b) Schematic showing how normal stresses arise due to a perinuclear stress fiber.
Similar articles
-
The regulation of dynamic mechanical coupling between actin cytoskeleton and nucleus by matrix geometry.Biomaterials. 2014 Jan;35(3):961-9. doi: 10.1016/j.biomaterials.2013.10.037. Epub 2013 Oct 31. Biomaterials. 2014. PMID: 24183171
-
Spreading Shape and Area Regulate the Osteogenesis of Mesenchymal Stem Cells.Tissue Eng Regen Med. 2019 Aug 29;16(6):573-583. doi: 10.1007/s13770-019-00213-y. eCollection 2019 Dec. Tissue Eng Regen Med. 2019. PMID: 31824820 Free PMC article.
-
Substrate elasticity regulates adipose-derived stromal cell differentiation towards osteogenesis and adipogenesis through β-catenin transduction.Acta Biomater. 2018 Oct 1;79:83-95. doi: 10.1016/j.actbio.2018.08.018. Epub 2018 Aug 19. Acta Biomater. 2018. PMID: 30134207
-
Gene regulation through dynamic actin control of nuclear structure.Exp Biol Med (Maywood). 2019 Nov;244(15):1345-1353. doi: 10.1177/1535370219850079. Epub 2019 May 13. Exp Biol Med (Maywood). 2019. PMID: 31084213 Free PMC article. Review.
-
Ultrastructure of the actin cytoskeleton.Curr Opin Cell Biol. 2018 Oct;54:1-8. doi: 10.1016/j.ceb.2018.02.007. Epub 2018 Feb 21. Curr Opin Cell Biol. 2018. PMID: 29477121 Free PMC article. Review.
Cited by
-
Dynamic intracellular mechanical cues facilitate collective signaling responses.iScience. 2021 Apr 3;24(5):102396. doi: 10.1016/j.isci.2021.102396. eCollection 2021 May 21. iScience. 2021. PMID: 33997681 Free PMC article.
-
Stiffness of the microenvironment upregulates ERBB2 expression in 3D cultures of MCF10A within the range of mammographic density.Sci Rep. 2016 Jul 7;6:28987. doi: 10.1038/srep28987. Sci Rep. 2016. PMID: 27383056 Free PMC article.
-
Mechanical principles of nuclear shaping and positioning.J Cell Biol. 2018 Oct 1;217(10):3330-3342. doi: 10.1083/jcb.201804052. Epub 2018 Sep 7. J Cell Biol. 2018. PMID: 30194270 Free PMC article. Review.
-
Nucleus-cytoskeleton communication impacts on OCT4-chromatin interactions in embryonic stem cells.BMC Biol. 2022 Jan 7;20(1):6. doi: 10.1186/s12915-021-01207-w. BMC Biol. 2022. PMID: 34996451 Free PMC article.
-
An Energetic Approach to Modeling Cytoskeletal Architecture in Maturing Cardiomyocytes.J Biomech Eng. 2022 Feb 1;144(2):021002. doi: 10.1115/1.4052112. J Biomech Eng. 2022. PMID: 34382649 Free PMC article.
References
-
- Yeung T, Georges PC, Flanagan LA, Marg B, Ortiz M, et al. (2005) Effects of Substrate Stiffness on cell Morphology, cytoskeletal Structure, and Adhesion. Cell Motility and the Cytoskeleton 60: 24–34. - PubMed
-
- Ghibaudo M, Saez A, Trichet L, Xayaphoummine A, Browaeys J, et al. (2008) Traction forces and rigidity sensing regulate cell functions. Soft Matter 4: 1836–1843.
Publication types
MeSH terms
Substances
Grants and funding
LinkOut - more resources
Full Text Sources
Other Literature Sources
Research Materials
