. 2014 Sep 24;9(9):e108564.
doi: 10.1371/journal.pone.0108564. eCollection 2014.

Deletion of serum amyloid A3 improves high fat high sucrose diet-induced adipose tissue inflammation and hyperlipidemia in female mice

Affiliations

Deletion of serum amyloid A3 improves high fat high sucrose diet-induced adipose tissue inflammation and hyperlipidemia in female mice

Laura J den Hartigh et al. PLoS One. .

Abstract

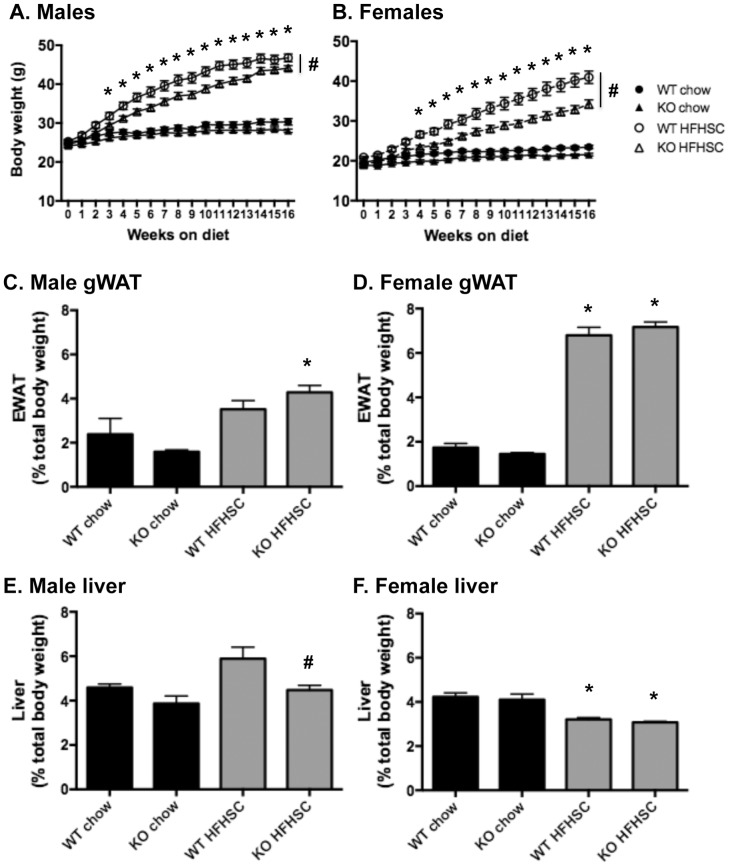
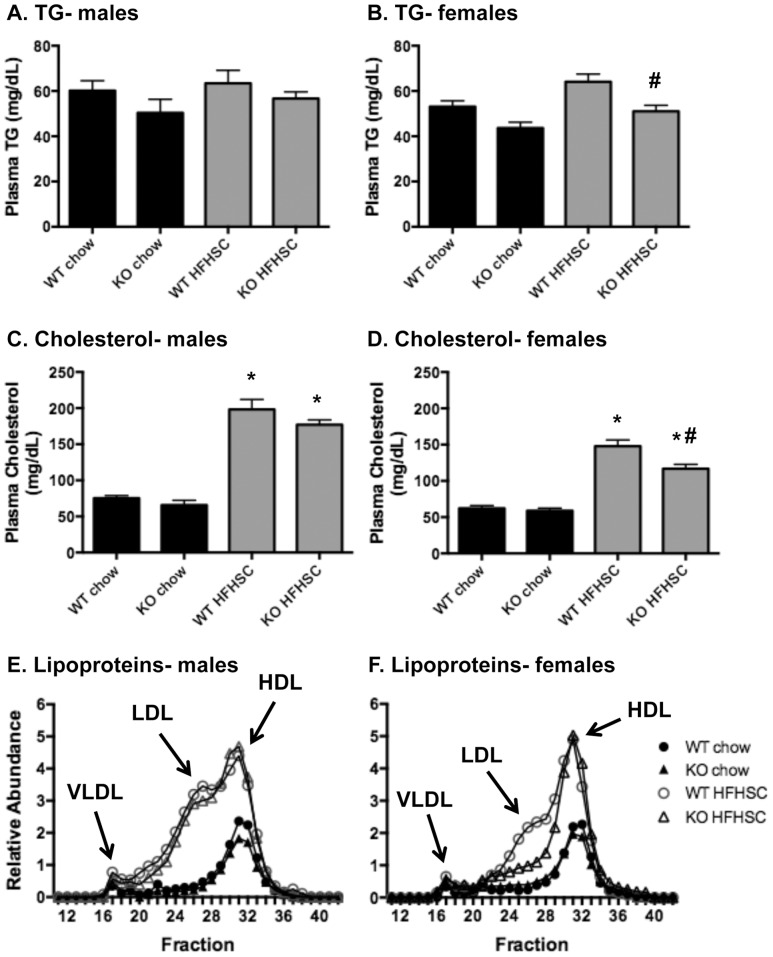
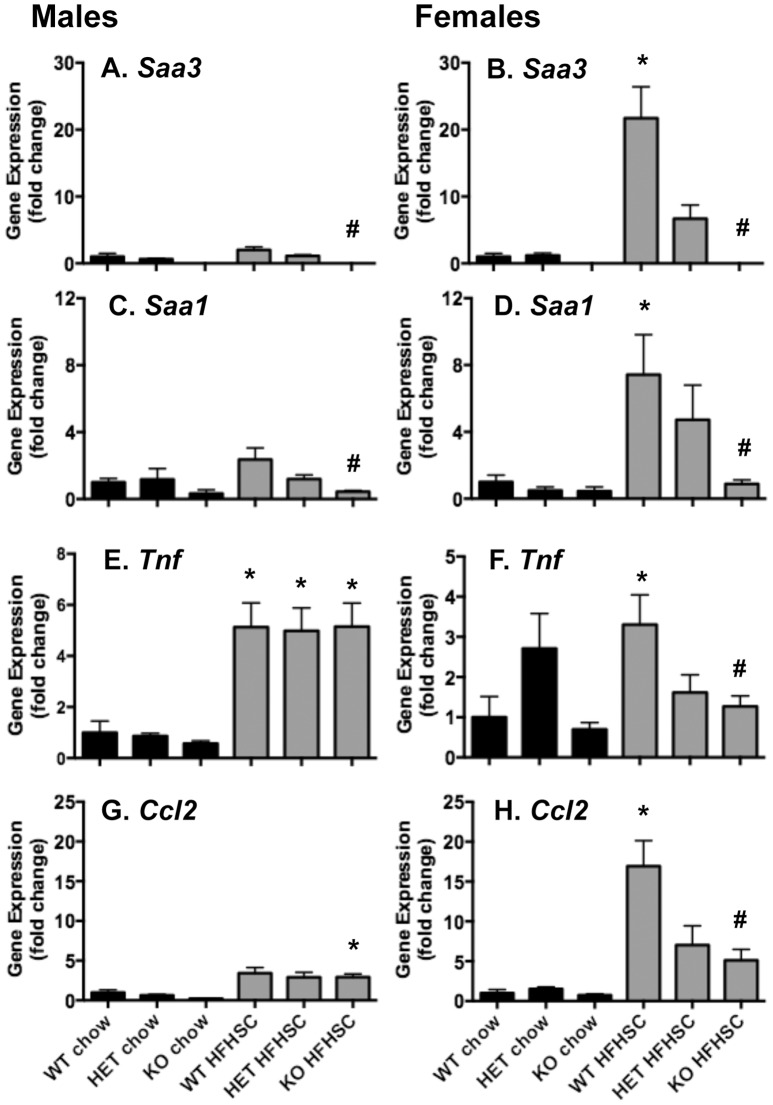
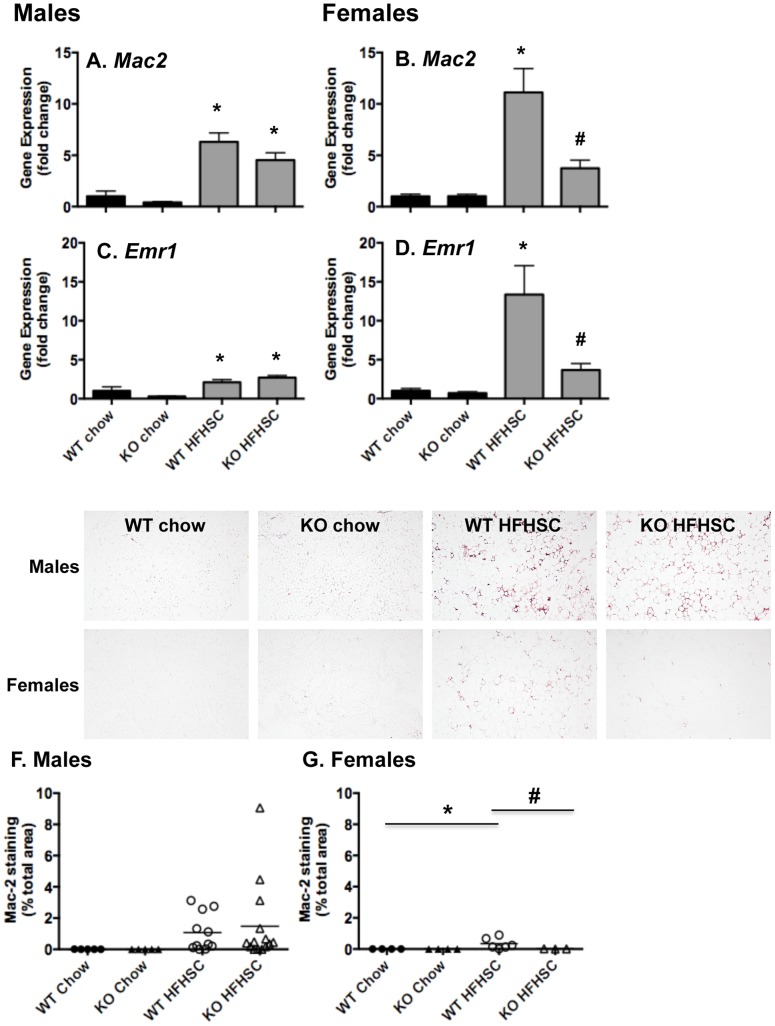
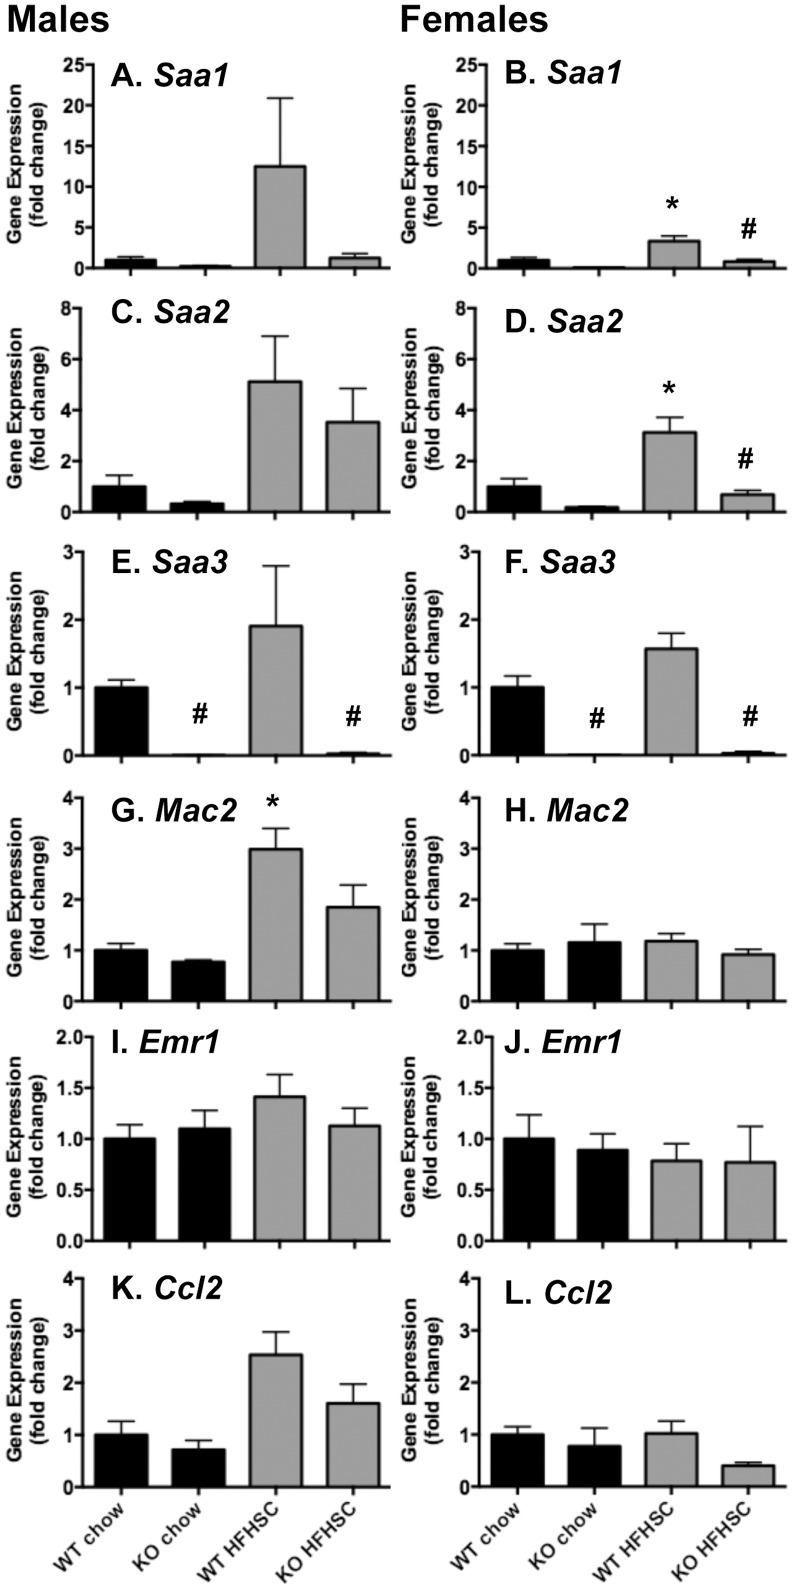
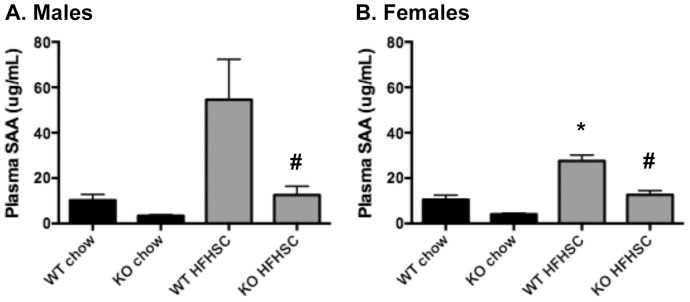
Serum amyloid A (SAA) increases in response to acute inflammatory stimuli and is modestly and chronically elevated in obesity. SAA3, an inducible form of SAA, is highly expressed in adipose tissue in obese mice where it promotes monocyte chemotaxis, providing a mechanism for the macrophage accumulation that occurs with adipose tissue expansion in obesity. Humans do not express functional SAA3 protein, but instead express SAA1 and SAA2 in hepatic as well as extrahepatic tissues, making it difficult to distinguish between liver and adipose tissue-specific SAA effects. SAA3 does not circulate in plasma, but may exert local effects that impact systemic inflammation. We tested the hypothesis that SAA3 contributes to chronic systemic inflammation and adipose tissue macrophage accumulation in obesity using mice deficient for Saa3 (Saa3(-/-)). Mice were rendered obese by feeding a pro-inflammatory high fat, high sucrose diet with added cholesterol (HFHSC). Both male and female Saa3(-/-) mice gained less weight on the HFHSC diet compared to Saa3(+/+) littermate controls, with no differences in body composition or resting metabolism. Female Saa3(-/-) mice, but not males, had reduced HFHSC diet-induced adipose tissue inflammation and macrophage content. Both male and female Saa3(-/-) mice had reduced liver Saa1 and Saa2 expression in association with reduced plasma SAA. Additionally, female Saa3(-/-) mice, but not males, showed improved plasma cholesterol, triglycerides, and lipoprotein profiles, with no changes in glucose metabolism. Taken together, these results suggest that the absence of Saa3 attenuates liver-specific SAA (i.e., SAA1/2) secretion into plasma and blunts weight gain induced by an obesogenic diet. Furthermore, adipose tissue-specific inflammation and macrophage accumulation are attenuated in female Saa3(-/-) mice, suggesting a novel sexually dimorphic role for this protein. These results also suggest that Saa3 influences liver-specific SAA1/2 expression, and that SAA3 could play a larger role in the acute phase response than previously thought.


Conflict of interest statement

Competing Interests: The authors have declared that no competing interests exist.

Figures

Figure 1
Figure 1. Deletion of Saa3 attenuates weight gain on a HFHSC diet.
(A) Male and (B) female Saa3 +/+ and Saa3 −/− mice were fed chow or a high fat, high sucrose + cholesterol (HFHSC) diet for 16 weeks, and weekly body weights recorded. (C–D) Gonadal white adipose tissue (gWAT) and (E–F) liver weight were recorded at sacrifice and normalized to total body weight. n = 6–15 mice per group. *P<0.05 from chow group; #P<0.05 from Saa3 +/+ controls. WT: Saa3 +/+; KO: Saa3 −/−.
Figure 2
Figure 2. Plasma triglycerides, cholesterol, and lipoprotein profiles are improved in female Saa3 −/− mice.
(A–B) Triglycerides and (C–D) total cholesterol were measured from fasted plasma after 16 weeks on chow or HFHSC diet. (E–F) Lipoprotein profiles were obtained by fast-phase liquid chromatography (FPLC) of pooled fasted plasma samples taken at sacrifice. n = 6–15 mice per group. *P<0.05 from chow group; #P<0.05 from Saa3 +/+ controls. WT: Saa3 +/+; KO: Saa3 −/−.
Figure 3
Figure 3. Gonadal white adipose tissue inflammatory and chemotactic gene expression is attenuated in female Saa3 −/− mice.
(A–H) Total RNA from whole gonadal white adipose tissue (gWAT) was reverse transcribed into cDNA for quantitative PCR analysis. Genes including Saa3 (A–B), Saa1 (C–D), Tnf (E–F), and Ccl2 (G–H) are presented, normalized to an internal control gene (Gapdh) and presented as fold change from Saa3 +/+ chow controls. n = 6–15 mice per group. *P<0.05 from chow group; #P<0.05 from Saa3 +/+ controls. WT: Saa3 +/+; HET: Saa3 +/−; KO: Saa3 −/−.
Figure 4
Figure 4. Macrophage content of gonadal white adipose tissue is decreased in female Saa3 −/− mice.
(A–D) Total RNA from whole gonadal white adipose tissue (gWAT) was reverse transcribed into cDNA for quantitative PCR analysis. Genes including Mac2 (A–B) and Emr1 (C–D) are presented, normalized to an internal control gene (Gapdh) and presented as fold change from Saa3 +/+ chow controls. (E–G) gWAT was fixed in formalin and embedded in formalin before sectioning and staining with a Mac2 antibody. (E) Representative images are shown, 10X magnification. (F–G) Quantification of the percentage of total Mac2-stained area in all tissue sections examined. n = 6–15 mice per group. *P<0.05 from chow group; #P<0.05 from Saa3 +/+ controls. WT: Saa3 +/+; KO: Saa3 −/−.
Figure 5
Figure 5. Liver Saa1 and Saa2 are attenuated in Saa3 −/− mice.
Total RNA from whole liver was reverse transcribed into cDNA for quantitative PCR analysis. Genes including Saa1 (A–B), Saa2 (C–D), Saa3 (E–F), Mac2 (G–H), Emr1 (I–J), and Ccl2 (K–L) are presented, normalized to an internal control gene (Gapdh) and presented as fold change from Saa3 +/+ chow controls. n = 6–15 mice per group. *P<0.05 from chow group; #P<0.05 from Saa3 +/+ controls. WT: Saa3 +/+; KO: Saa3 −/−.
Figure 6
Figure 6. Plasma SAA is decreased in both male and female Saa3 / mice.
(A–B) Total SAA was measured from fasted plasma taken at sacrifice by ELISA. n = 6–15 mice per group. *P<0.05 from chow group; #P<0.05 from Saa3 +/+ controls. WT: Saa3 +/+; KO: Saa3 −/−.

References

    1. Müller S, Martin S, Koenig W, Hanifi-Moghaddam P, Rathmann W, et al. (2002) Impaired glucose tolerance is associated with increased serum concentrations of interleukin 6 and co-regulated acute-phase proteins but not TNF-alpha or its receptors. Diabetologia 45: 805–812. - PubMed
    1. Poitou C, Viguerie N, Cancello R, De Matteis R, Cinti S, et al. (2005) Serum amyloid A: production by human white adipocyte and regulation by obesity and nutrition. Diabetologia 48: 519–528. - PubMed
    1. Lewis KE, Kirk EA, McDonald TO, Wang S, Wight TN, et al. (2004) Increase in serum amyloid a evoked by dietary cholesterol is associated with increased atherosclerosis in mice. Circulation 110: 540–545. - PubMed
    1. Scheja L, Heese B, Zitzer H, Michael MD, Siesky AM, et al. (2008) Acute-phase serum amyloid A as a marker of insulin resistance in mice. Exp Diabetes Res 2008: 230837. - PMC - PubMed
    1. McAdam KP, Sipe JD (1976) Murine model for human secondary amyloidosis: genetic variability of the acute-phase serum protein SAA response to endotoxins and casein. J Exp Med 144: 1121–1127. - PMC - PubMed

Publication types

LinkOut - more resources