

Efficient illumination for microsecond tracking microscopy
- PMID: 25251462
- PMCID: PMC4175081
- DOI: 10.1371/journal.pone.0107335
Efficient illumination for microsecond tracking microscopy
Abstract
The possibility to observe microsecond dynamics at the sub-micron scale, opened by recent technological advances in fast camera sensors, will affect many biophysical studies based on particle tracking in optical microscopy. A main limiting factor for further development of fast video microscopy remains the illumination of the sample, which must deliver sufficient light to the camera to allow microsecond exposure times. Here we systematically compare the main illumination systems employed in holographic tracking microscopy, and we show that a superluminescent diode and a modulated laser diode perform the best in terms of image quality and acquisition speed, respectively. In particular, we show that the simple and inexpensive laser illumination enables less than 1 μs camera exposure time at high magnification on a large field of view without coherence image artifacts, together with a good hologram quality that allows nm-tracking of microscopic beads to be performed. This comparison of sources can guide in choosing the most efficient illumination system with respect to the specific application.
Conflict of interest statement
Figures
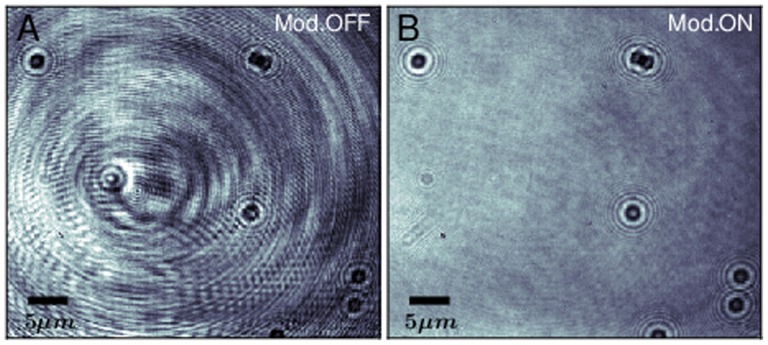
 m diameter stuck on the glass surface are illuminated by the free running laser biased above threshold (at a current of 96 mA). The coherent noise severely degrades the image quality. B) Same field of view as in A), with bias current modulated by a sinusoidal signal of 80 mA
 , 2 MHz. Exposure time = 20
  s.
s.
 , square wave). Each optical spectrum is integrated over a 0.5 s time-window. The color code is the same in A and B. C) Normalized spectra of the SLD, LED, and white lamp (whose spectrum is flat in the visualized region).
 m. The grey and color scale is the same for all the panels. Exposure times: A) and B) 2
  s; C) 3 ms; D) 70
  s; E) 15 ms; F) 6 ms.
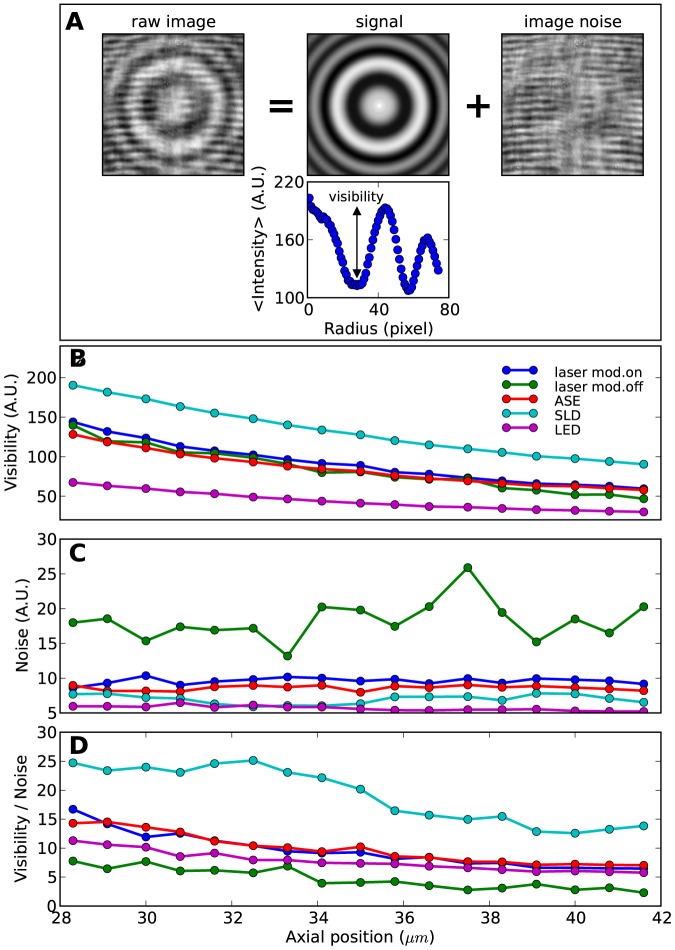
 m. The signal is obtained averaging the raw image rotated in 100 steps around its center (determined with sub-pixel resolution). The image noise is obtained subtracting the signal from the raw image. B) Fringe visibility (defined in the radial intensity profile by the difference of the second maximum with the first minimum), C) noise (defined as the standard deviation of the image noise), and D) visibility-to-noise ratio are shown for the different sources at different axial z-positions.
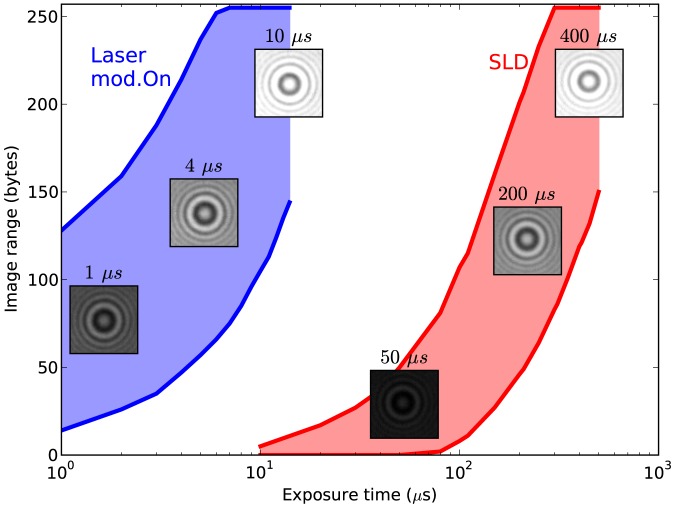
 m bead out of focus). The insets show example images obtained at the exposure time indicated; their grey levels are all fixed within the interval (0, 255) to show under-exposure and saturation. The two sources were focused to illuminate evenly the same field of view, and delivered maximum intensity (laser: 120 mW, sinusoidal modulation of 3
  at 2 MHz; SLD: 5 mW).
 100 nm. The traces are vertically offset for clarity. Acquisition rate: 3000 fps, exposure time: 1
  s.
s.References
-
- Lansdorp BM, Tabrizi SJ, Dittmore A, Saleh OA (2013) A high-speed magnetic tweezer beyond 10,000 frames per second. Review of Scientific Instruments 84: 044301. - PubMed
-
- Soni GV, Jonsson MP, Dekker C (2013) Periodic modulations of optical tweezers near solid-state membranes. Small 9: 679–684. - PubMed
-
- Lee SH, Grier DG (2007) Holographic microscopy of holographically trapped three-dimensional structures. Optics Express 15: 1505–1512. - PubMed
-
- Otto O, Czerwinski F, Gornall JL, Stober G, Oddershede LB, et al. (2010) Real-time particle tracking at 10,000 fps using optical fiber illumination. Optics Express 18: 22722–22733. - PubMed
Publication types
MeSH terms
LinkOut - more resources
Full Text Sources
Other Literature Sources
