. 2014 Sep 24;9(9):e108459.
doi: 10.1371/journal.pone.0108459. eCollection 2014.

Phosphate concentration and arbuscular mycorrhizal colonisation influence the growth, yield and expression of twelve PHT1 family phosphate transporters in foxtail millet (Setaria italica)

Affiliations

Phosphate concentration and arbuscular mycorrhizal colonisation influence the growth, yield and expression of twelve PHT1 family phosphate transporters in foxtail millet (Setaria italica)

S Antony Ceasar et al. PLoS One. .

Abstract

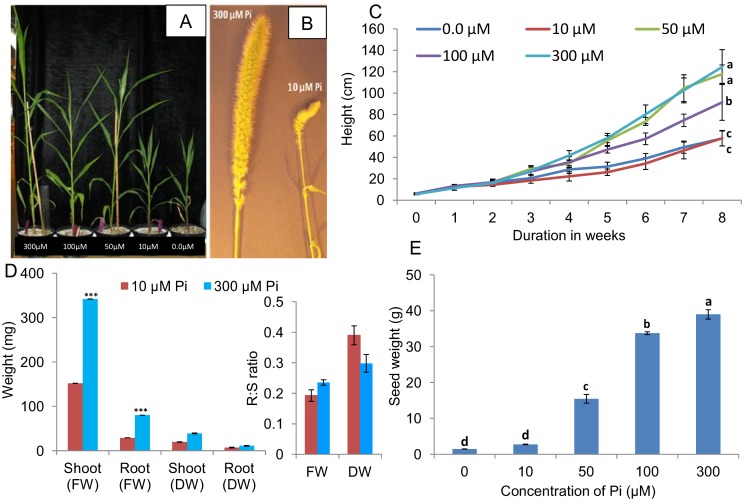
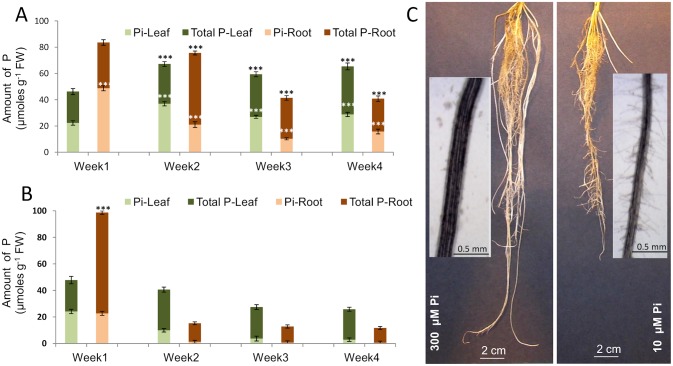
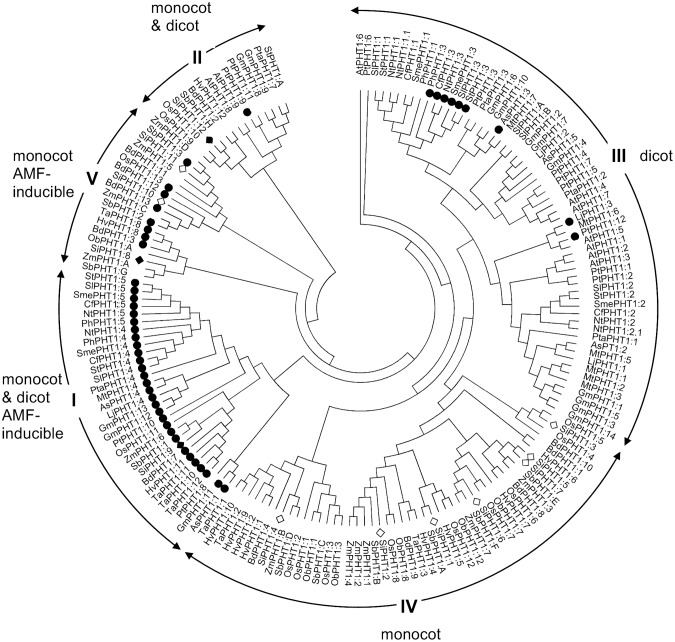
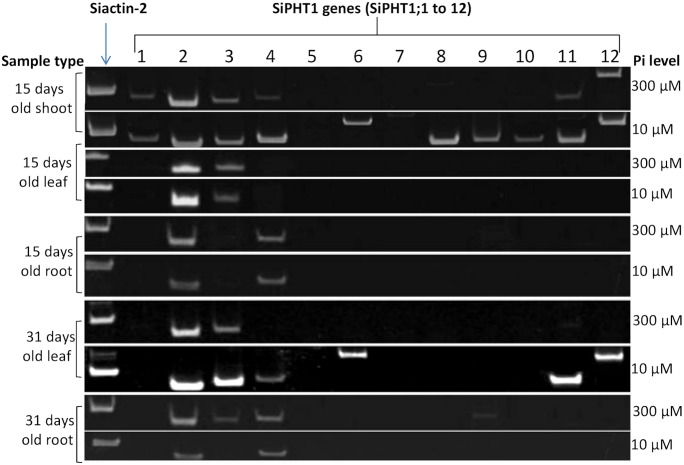
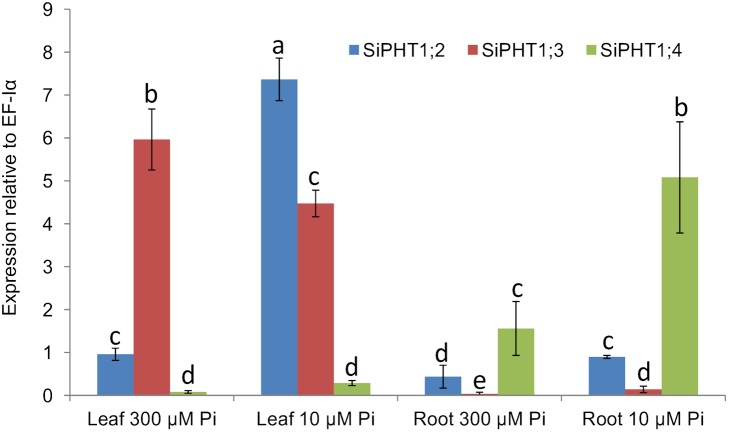
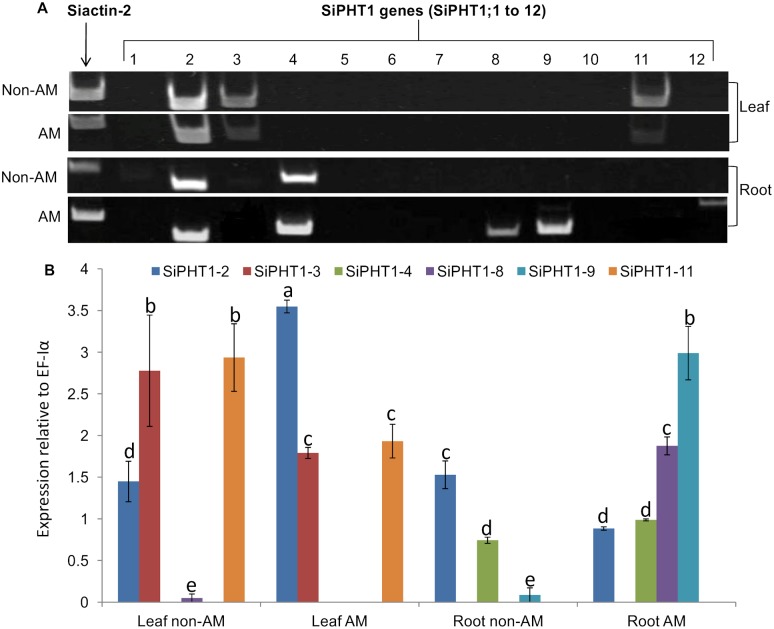
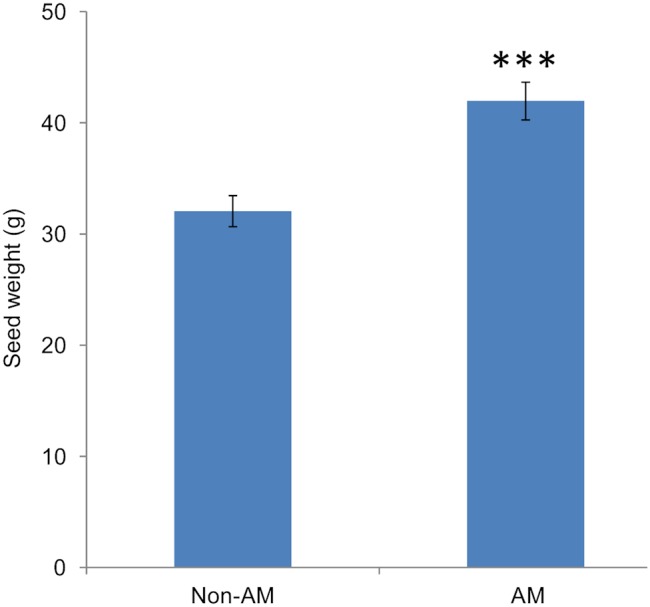
Phosphorus (P) is an essential element which plays several key roles in all living organisms. Setaria italica (foxtail millet) is a model species for panacoid grasses including several millet species widely grown in arid regions of Asia and Africa, and for the bioenergy crop switchgrass. The growth responses of S. italica to different levels of inorganic phosphate (Pi) and to colonisation with the arbuscular mycorrhizal fungus Funneliformis mosseae (syn. Glomus mosseae) were studied. Phosphate is taken up from the environment by the PHT1 family of plant phosphate transporters, which have been well characterized in several plant species. Bioinformatic analysis identified 12 members of the PHT1 gene family (SiPHT1;1-1;12) in S. italica, and RT and qPCR analysis showed that most of these transporters displayed specific expression patterns with respect to tissue, phosphate status and arbuscular mycorrhizal colonisation. SiPHT1;2 was found to be expressed in all tissues and in all growth conditions tested. In contrast, expression of SiPHT1;4 was induced in roots after 15 days growth in hydroponic medium of low Pi concentration. Expression of SiPHT1;8 and SiPHT1;9 in roots was selectively induced by colonisation with F. mosseae. SiPHT1;3 and SiPHT1;4 were found to be predominantly expressed in leaf and root tissues respectively. Several other transporters were expressed in shoots and leaves during growth in low Pi concentrations. This study will form the basis for the further characterization of these transporters, with the long term goal of improving the phosphate use efficiency of foxtail millet.


Conflict of interest statement

Competing Interests: The authors have declared that no competing interests exist.

Figures

Figure 1
Figure 1. Plant growth experiments.
Foxtail millet plants grown in pots containing a 1∶1 (v/v) ratio of perlite:vermiculite and supplied with nutrient solution containing various concentrations of inorganic phosphate (Pi). A, 6-week old plants grown in various concentrations of Pi; from left to right: 300 µM, 100 µM, 50 µM, 10 µM and no added Pi (0 µM); B, image of flowers representative of plants grown for 12 weeks in the presence of sufficient (300 µM) or deficient (10 µM) Pi; C, plant height measured weekly for plants grown in the presence of various concentrations of Pi. Statistical analysis was conducted at the end of the recording period (i.e. at 8 weeks); D, shoot (S) and root (R) weight (mg) and root:shoot (R:S) weight ratio of foxtail millet seedlings grown for 16 days in the presence of sufficient (300 µM) or deficient (10 µM) Pi; and E, seed yield (seed dry weight) of plants grown in the presence of various concentrations of Pi after 16 weeks of growth. Data shown are means ± standard deviation (SD), n = 5. Values followed by the same letter were not significantly (P<0.05) different based on a Bonferroni post-hoc test. For Fig. 1D, data were tested by a t-test; *** represents a significant difference (P<0.001) between the shoots or roots of plants grown with high (300 µM) compared to low (10 µM) Pi concentrations.
Figure 2
Figure 2. Assay of total and inorganic phosphate content in leaf and root samples.
A and B, Total P and inorganic P (Pi) content in leaf and root samples of foxtail millet grown hydroponically in media containing 300 µM (A) and 10 µM (B) Pi. The total height for the bar represents total P, while inorganic P is shown within the total P bar and indicated by the lighter shading. Values shown are the means ± SD (n = 5). Data were analysed by a t-test where *** represents a significant difference (P<0.001) between the plants grown with high (300 µM) compared to low (10 µM) Pi concentrations. C, Root architecture of 20-day old foxtail millet plants grown hydroponically in medium containing 300 or 10 µM Pi. The insets show roots magnified to illustrate the induction of root hairs in plants grown in 10 µM Pi.
Figure 3
Figure 3. Phylogenetic analysis of plant PHT1 family members.
Roman numerals (I–IV) indicate the four PHT1 subfamilies identified by Nagy et al. together with a more-recently identified family of arbuscular mycorrhizal fungus (AMF)-inducible transporters (V) specific to the Poaceae . Sequence names start with the first letter of the genus and the first one or two letters of the species name, followed by the gene name. Accession numbers for the proteins are given in Table S5. PHT1 family members from S. italica are indicated by open diamonds or, in the case of AMF-inducible members, filled diamonds. Other plant PHT1 family members that have been described to be AMF-inducible are indicated by filled circles.
Figure 4
Figure 4. RT-PCR analysis of expression patterns of the foxtail millet PHT1 gene family.
cDNA produced by reverse transcription of mRNA was prepared from various tissues of plants grown in Pi-deficient (10 µM) and Pi-sufficient (300 µM) conditions and then amplified with primers specific for each of the 12 SiPHT1 genes and for the Siactin-2 gene. PCR products were separated on 10% polyacrylamide gels and visualized using SYBR safe DNA gel stain. The 15 and 31 d leaf and root samples were obtained from hydroponically grown plants; 15 dshoot was obtained from pot grown plants (perlite:vermiculite).
Figure 5
Figure 5. Quantitative real-time PCR analysis of SiPHT1;2, SiPHT1;3 and SiPHT1;4.
Quantitative real-time PCR analysis of SiPHT1;2, SiPHT1;3 and SiPHT1;4 expression in leaf and root samples of 15 d foxtail millet plants grown hydroponically in media containing either 300 µM or 10 µM Pi. Values are mean ± SE of 3 biological replicates each consisting of 3 technical replicates. The values were compared by one way ANOVA for the expression of genes. Values indicated by the same letter are not significantly different (p<0.05), based on a Bonferroni post-hoc test for the expression level of the same gene in different tissues.
Figure 6
Figure 6. Expression analysis of SiPHT1 genes in roots and leaves of plants colonised by F. mosseae.
A; expression analysis by semi quantitative RT-PCR. cDNA was prepared and PCR performed as described in the legend to Figure 4. B; expression analysis by quantitative real-time PCR of SiPHT1;2, SiPHT1;3, SiPHT1;4, SiPHT1;8, SiPHT1;9 and SiPHT1;11 in leaf and root samples of 2 month old foxtail millet AM or non-AM plants. Values are mean ± SE of 3 biological replicates each consisting of 3 technical replicates. The values were compared by one way ANOVA for the expression of genes. Values indicated by the same letter are not significantly different (p<0.05), based on a Bonferroni post-hoc test for the expression level of the same gene in different tissues.
Figure 7
Figure 7. Seed yield (dry weight) of AM or non-AM foxtail millet.
The seeds were harvested after 16 weeks of growth. Values are mean ± SD (n = 5). Data were tested using a t-test where *** = P<0.001.
Figure 8
Figure 8. Schematic diagram showing the locations of the P1BS and CTTC motifs in promoter regions of 8 SiPHT1s.
The P1BS and CTTC motifs are shown in green and red respectively and are located between −1 to −3000 bp upstream of the start codon ATG.

References

    1. Raghothama KG (1999) Phosphate acquisition. Annual Review of Plant Physiology and Plant Molecular Biology 50: 665–693. - PubMed
    1. Atkinson D (1973) Some general effects of phosphorus deficiency on growth and development. New Phytologist 72: 101–111.
    1. Sicher RC, Kremer DF (1988) Effects of phosphate deficiency on assimilate partitioning in barley seedlings. Plant Science 57: 9–17.
    1. Fredeen AL, Rao IM, Terry N (1989) Influence of phosphorus nutrition on growth and carbon partitioning in Glycine max . Plant Physiology 89: 225–230. - PMC - PubMed
    1. Hajabbasi MA, Schumacher TE (1994) Phosphorus effects on root-growth and development in 2 maize genotypes. Plant and Soil 158: 39–46.

Publication types

MeSH terms