

Comparison of brain gray and white matter macromolecule resonances at 3 and 7 Tesla
- PMID: 25252131
- PMCID: PMC4369478
- DOI: 10.1002/mrm.25468
Comparison of brain gray and white matter macromolecule resonances at 3 and 7 Tesla
Abstract
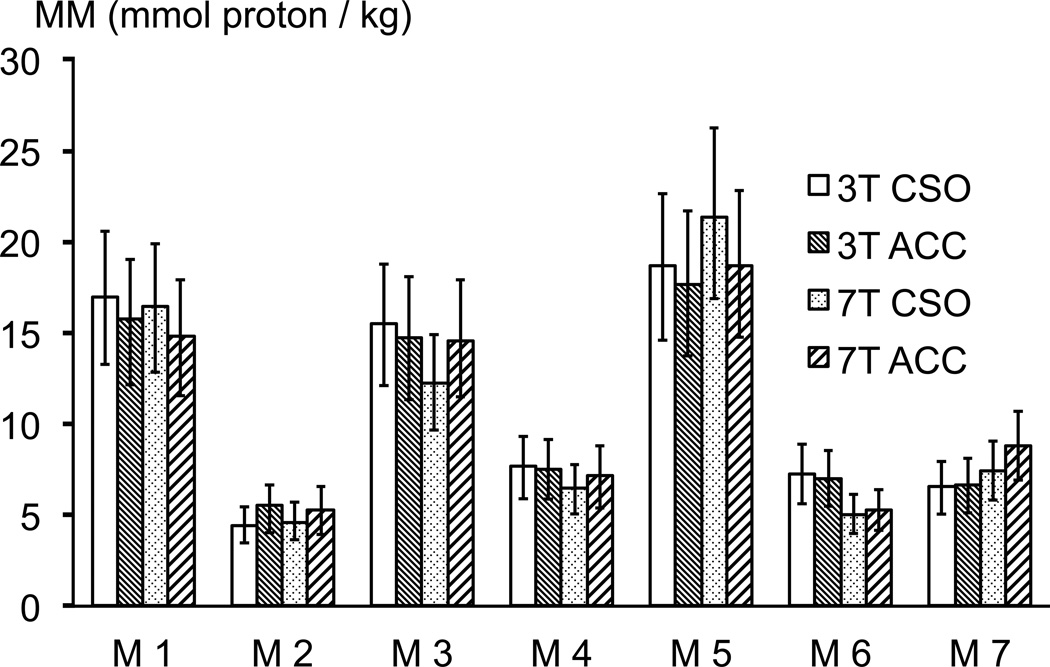
Purpose: In proton MR spectra of the human brain, relatively broad macromolecule (MM) resonances underlie the narrower signals from metabolites. The purpose of this study was to quantify the MM profile in healthy human brain at 3T and 7T, both in gray matter (anterior cingulate cortex [ACC]) and white matter (centrum semiovale [CSO]).
Methods: A water-suppressed, inversion-recovery pulse sequence was used to null metabolite signals and acquire MM spectra in 20 healthy volunteers using very similar methodology at both field strengths (n = 5 per region and field). The MM spectra were fitted with multiple Gaussian functions and quantified relative to the unsuppressed water signal from the same volume.
Results: MM proton concentration values were in the range of 5-20 mmol/kg. No significant differences were found between the MM proton concentration measurements by region (P ≈ 0.8) nor by field strength (P ≈ 0.5). Linewidths of the well-resolved M1 peak were slightly more than double at 7T (43.0 ± 4.7 Hz in ACC, 45.6 ± 4.1 Hz in CSO) compared with 3T (19.8 ± 3.5 Hz in ACC, 20.0 ± 4.3 Hz in CSO).
Conclusion: The absence of differences in MM concentrations between white and gray matter implies that a single MM "baseline" may be adequate for spectral fitting of multiple brain regions when determining metabolite concentrations. Visibility of MM signals is similar at 3T and 7T.
Keywords: 7 Tesla; brain; in vivo 1H MRS; macromolecular baseline; macromolecules.
© 2014 Wiley Periodicals, Inc.
Figures


References
-
- Behar KL, Rothman DL, Spencer DD, Petroff OA. Analysis of macromolecule resonances in 1H NMR spectra of human brain. Magn Reson Med. 1994;32(3):294–302. - PubMed
-
- Hofmann L, Slotboom J, Boesch C, Kreis R. Characterization of the macromolecule baseline in localized 1H-MR spectra of human brain. Magn Reson Med. 2001;46:855–863. - PubMed
-
- Mader I, Seeger U, Weissert R, Klose U, Naegele T, Melms A, Grodd W. Proton MR spectroscopy with metabolite-nulling reveals elevated macromolecules in acute multiple sclerosis. Brain. 2001;124(Pt 5):953–961. - PubMed
-
- Chong DG, Kreis R, Bolliger CS, Boesch C, Slotboom J. Two-dimensional linear-combination model fitting of magnetic resonance spectra to define the macromolecule baseline using FiTAID, a Fitting Tool for Arrays of Interrelated Datasets. MAGMA. 2011;24:147–164. - PubMed
-
- Schaller B, Lijing X, Gruetter R. Is the macromolecule signal tissue-specific in healthy human brain? A 1H MRS study at 7 Tesla in the occipital lobe. Magn Reson Med. 2013 - PubMed
Publication types
MeSH terms
Grants and funding
LinkOut - more resources
Full Text Sources
Other Literature Sources
