. 2014 Nov 15;74(22):6565-6577.
doi: 10.1158/0008-5472.CAN-14-1218. Epub 2014 Sep 24.

In vivo disruption of an Rb-E2F-Ezh2 signaling loop causes bladder cancer

Affiliations

In vivo disruption of an Rb-E2F-Ezh2 signaling loop causes bladder cancer

Mirentxu Santos et al. Cancer Res. .

Abstract

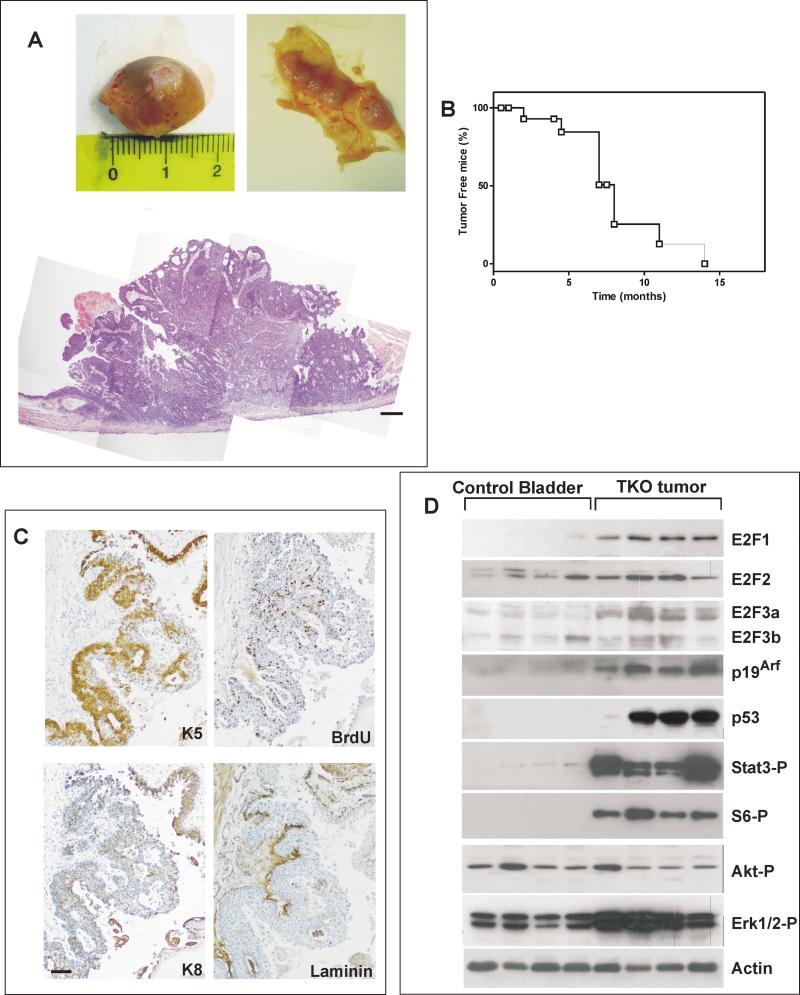
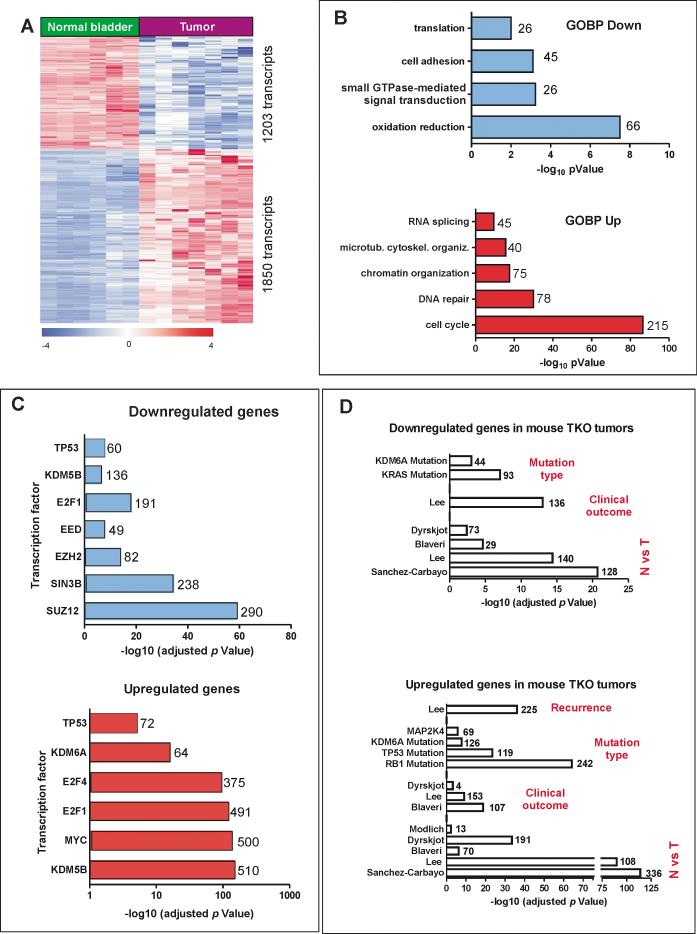
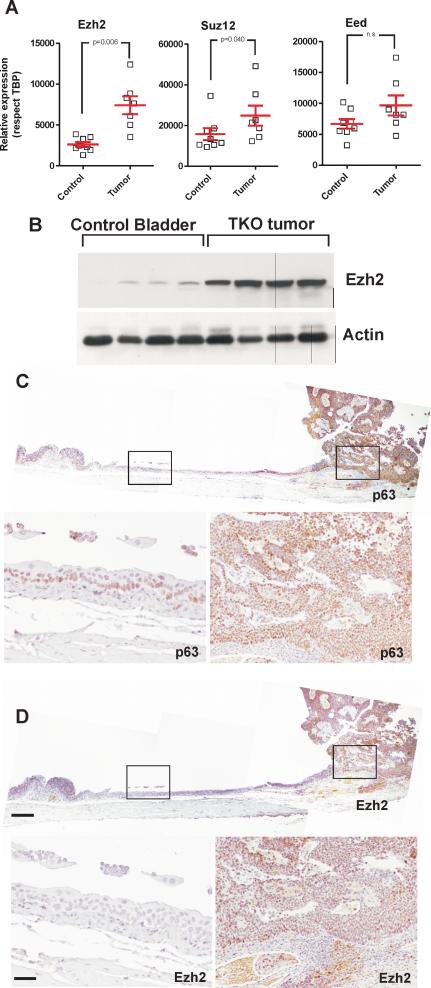
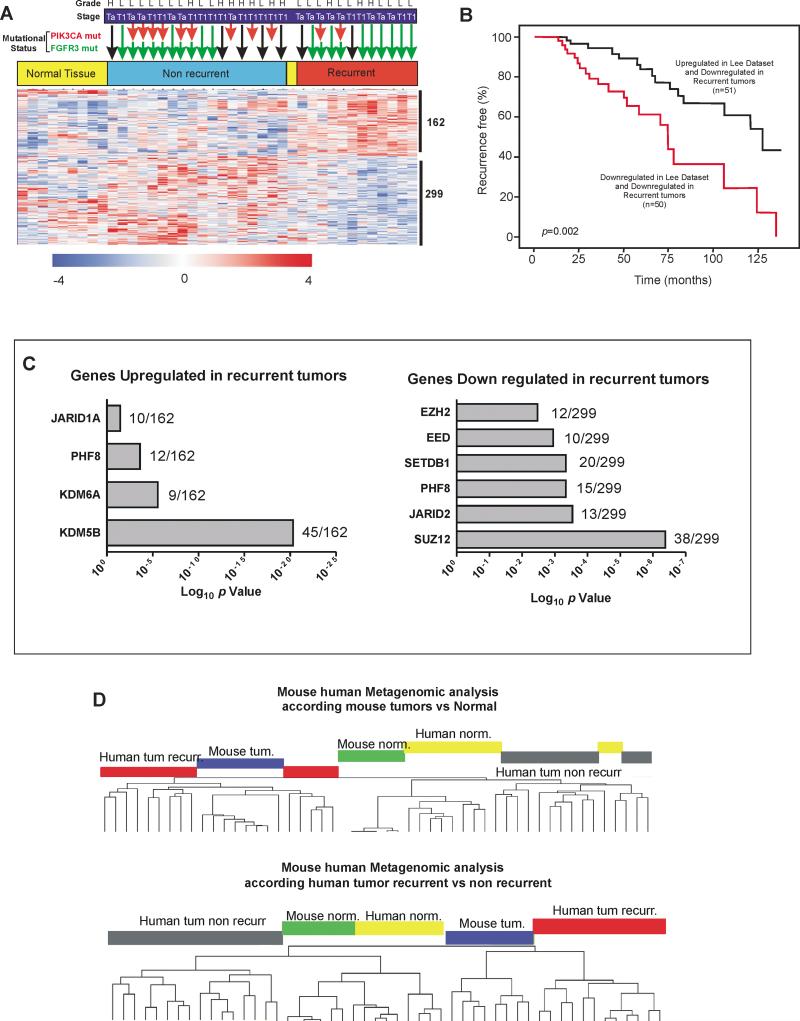
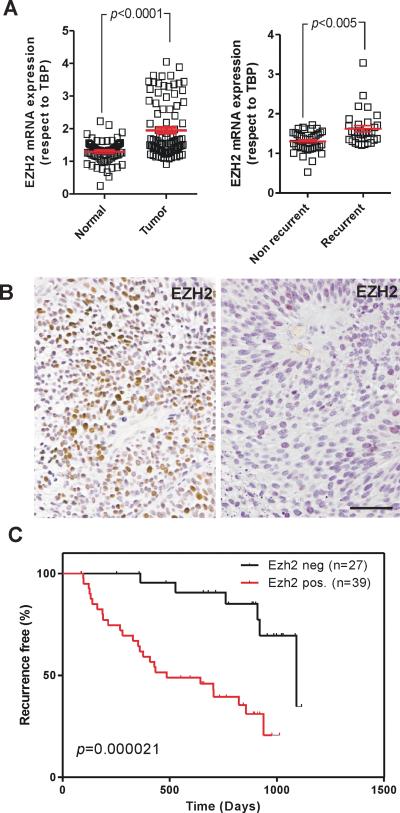
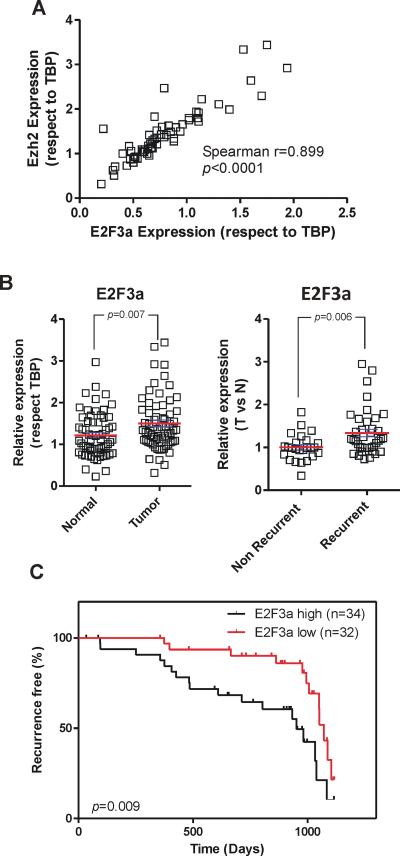
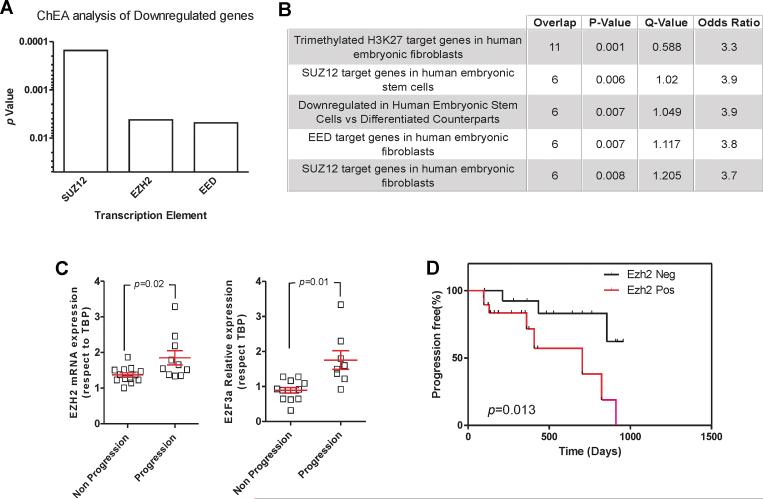
Bladder cancer is a highly prevalent human disease in which retinoblastoma (Rb) pathway inactivation and epigenetic alterations are common events. However, the connection between these two processes is still poorly understood. Here, we show that the in vivo inactivation of all Rb family genes in the mouse urothelium is sufficient to initiate bladder cancer development. The characterization of the mouse tumors revealed multiple molecular features of human bladder cancer, including the activation of E2F transcription factor and subsequent Ezh2 expression and the activation of several signaling pathways previously identified as highly relevant in urothelial tumors. These mice represent a genetically defined model for human high-grade superficial bladder cancer. Whole transcriptional characterizations of mouse and human bladder tumors revealed a significant overlap and confirmed the predominant role for Ezh2 in the downregulation of gene expression programs. Importantly, the increased tumor recurrence and progression in human patients with superficial bladder cancer is associated with increased E2F and Ezh2 expression and Ezh2-mediated gene expression repression. Collectively, our studies provide a genetically defined model for human high-grade superficial bladder cancer and demonstrate the existence of an Rb-E2F-Ezh2 axis in bladder whose disruption can promote tumor development.


Figures

Fig. 1
Fig. 1. In vivo Rb family ablation causes bladder cancer development in mice
A) Example of external (upper left panel) or internal (upper right panel) view of a bladder from an RbF/F;p130F/F;p107-/- mouse 11 months after inducing the gene recombination by AdenoCre infection. Lower panel depicts an example of H&E stained section of the lesions shown in upper panels. Bar =500μm B) Kaplan-Meier curve showing the kinetics of tumor development as assessed by CT scan in the adenoCre injected mice (n=18). C). Representative immunohistochemistry of a mouse tumor stained for Keratin K5, BrdU, Keratin K8 and Laminin as indicated. Bar=150μm D) Immunoblot analyses of control (uninfected littermates bladder samples) and mouse bladder tumors (denoted TKO: triple knock out) showing the expression of the quoted proteins, Actin was used to normalize protein loading.
Fig. 2
Fig. 2. Transcriptome analysis of mouse bladder tumors
A) Heatmap showing the distribution of genes (rows) identifying tumors and normal control uninfected mouse bladder samples. Each column represents a sample. A red (overexpressed) to blue (downregulated) scheme following the above scale limits (in log2 scale) is shown. Numbers on the right denote the number of transcripts of each group (upregulated or downregulated). B) Representative Gene Ontology biological processes categories affecting the functions of the downregulated (upper panel) or upregulated (lower panel) genes in mouse bladder tumors. Numbers on the right of each bar indicate the genes on COBP category: C) Relative relevance of transcription factors and histone modifying enzymes in the genes downregulated (upper panel) or upregulated (lower panel) in tumors as obtained by ChEA. The relevance of each factor is provided by the p-value (in –log10 scale). Numbers on the right of each bar represent genes bound by each transcription factor from the database. D) Summary of relevant overlap between downregulated (upper panel) or upregulated (lower panel) genes in mouse bladder TKO (triple knock out) tumors with human bladder tumors from the Oncomine database. The different comparison concepts (Tumor vs Normal, Mutation Type, Clinical Outcome and Recurrence) are provided for each group. p-values were obtained by exact F Fisher test. The number of overlapping genes is shown for each dataset.
Fig 3
Fig 3. Mouse bladder tumors display increased Ezh2 expression
A) Expression of Ezh2 Suz12 and Eed genes in control (uninfected bladder samples) and mouse bladder tumors as assessed by RTqPCR (respect to Tbp). p-value was obtained by the Mann Whitney t-test, mean and SEM are denoted in red. B) Immunoblot analyses of control (uninfected bladder samples) and mouse bladder TKO (triple knock out) tumors showing the expression of Ezh2 protein Actin was used to normalize protein loading. C) Representative examples of the immunohistochemistry analysis of mouse bladder tumor showing the expression of p63. Lower panels are higher magnification of the corresponding areas denoted in upper panel. D) Representative examples of the immunohistochemistry analysis of mouse bladder tumor showing the expression of Ezh2. Lower panels are higher magnification of the corresponding areas denoted in upper panel. Bar in upper panel=500μm, in lower panel =150μm
Fig. 4
Fig. 4. Transcriptome studies of human NMIBC (non-muscle invasive bladder cancer) recurrence
A) Heatmap showing the distribution of genes (rows) identifying recurrent tumor samples. Each column represents a sample, the mutation of PIK3CA or FGFR3 genes is denoted by red and green arrows, respectively. The stage (Ta and T1) and grade (high: H, low: L) for each tumor sample is also provided. A red (upregulated) to blue (downregulated) scheme following the scale limits (in log2 scale) is shown. Numbers on right side denote the number of transcripts characterizing each class. B) Kaplan-Meier distribution of patients in Lee Dataset (26) according the expression levels of the downregulated genes identified in our study. p-values were obtained by the Log rank test. n denotes the number of samples scored of each group. C) Relative relevance of the different histone modifying enzymes in the genes of each quoted group obtained by ChEA. The relevance of each enzyme is provided by the p-value. The number on the right of each bar represents the number of specific genes bearing this type of modification and the total number of transcripts on each group: upregulated (left panel) or downregulated (right panel) in recurrent tumors. D) Dendrograms of mouse-human transcriptome comparison upon unsupervised clustering (Pearson correlation and average linkage method) according the expression of genes differentiating mouse control and bladder tumor samples (upper panel) or genes discriminating human recurrent tumors (lower panel).
Fig. 5
Fig. 5. EZH2 Expression in human NMIBC (non-muscle invasive bladder cancer)
A) Expression of EZH2 gene as assessed by RTqPCR (respect to TBP) in normal vs. tumor samples, and in recurrent vs non-recurrent tumors. p-values were obtained by the Mann Whitney t-test, mean and SEM are shown. B) Representative examples of human tumors showing positive (left panel), and negative (right panel) staining for EZH2 protein. Bar= 100μm. C) Kaplan-Meier distribution of recurrence according the expression of EZH2 protein form tissue microarrays. p-values were obtained by the Log rank test (n denotes the number of samples in each group).
Fig. 6
Fig. 6. E2F3a expression in human NMIBC (non-muscle invasive bladder cancer)
A) Expression of EZH2 gene as a function of E2F3a gene expression as assessed by RTqPCR in NMIBC samples. The r and p values are provided according the Spearmann correlation method B) Expression of E2F3a gene in normal and tumor bladder samples (left panel) and in recurrent and non-recurrent bladder tumors (right panel). p-values were obtained by the Mann Whitney t-test, mean and SEM are denoted in red. C) Kaplan-Meier distribution of NMIBC recurrence according increased expression of E2F3a gene p-value was obtained by the Log rank test. n denotes the number of samples scored of each group.
Fig. 7
Fig. 7. EZH2-dependent signaling in tumor recurrence and progression
A) Relative relevance of the binding of the different PRC2 elements to the downregulated genes in tumors showing progression upon recurrence as assessed by ChEA. The relevance of each enzyme is provided by the p-value. B) Summary of relevant overlap of the downregulated genes in tumors showing progression upon recurrence and Oncomine database in the concept “literature defined” showing the relevance of PRC2 components. C) Expression of EZH2 and E2F3a genes as assessed by RTqPCR (respect to TBP) in tumors displaying or not progression upon recurrence. p-values were obtained by the Mann Whitney t-test, mean and SEM are denoted in red. D) Kaplan-Meier distribution of tumor progression in recurrences according increased expression of EZH2. p-values were obtained by the Log rank test.

References

    1. Wu X, Hildebrandt MA, Chang DW. Genome-wide association studies of bladder cancer risk: a field synopsis of progress and potential applications. Cancer metastasis reviews. 2009;28:269–80. - PubMed
    1. Gallagher DJ, Milowsky MI. Bladder cancer. Current treatment options in oncology. 2009;10:205–15. - PubMed
    1. Burger M, Oosterlinck W, Konety B, Chang S, Gudjonsson S, Pruthi R, et al. ICUD-EAU International Consultation on Bladder Cancer 2012: Non-muscle-invasive urothelial carcinoma of the bladder. European urology. 2013;63:36–44. - PubMed
    1. Knowles MA. Molecular subtypes of bladder cancer: Jekyll and Hyde or chalk and cheese? Carcinogenesis. 2006;27:361–73. - PubMed
    1. Iyer G, Al-Ahmadie H, Schultz N, Hanrahan AJ, Ostrovnaya I, Balar AV, et al. Prevalence and co-occurrence of actionable genomic alterations in high-grade bladder cancer. J Clin Oncol. 2013;31:3133–40. - PMC - PubMed

Publication types

MeSH terms

Substances