. 2014 Oct;141(20):4018-30.
doi: 10.1242/dev.115709. Epub 2014 Sep 24.

Single-cell analyses of regulatory network perturbations using enhancer-targeting TALEs suggest novel roles for PU.1 during haematopoietic specification

Affiliations

Single-cell analyses of regulatory network perturbations using enhancer-targeting TALEs suggest novel roles for PU.1 during haematopoietic specification

Adam C Wilkinson et al. Development. 2014 Oct.

Abstract

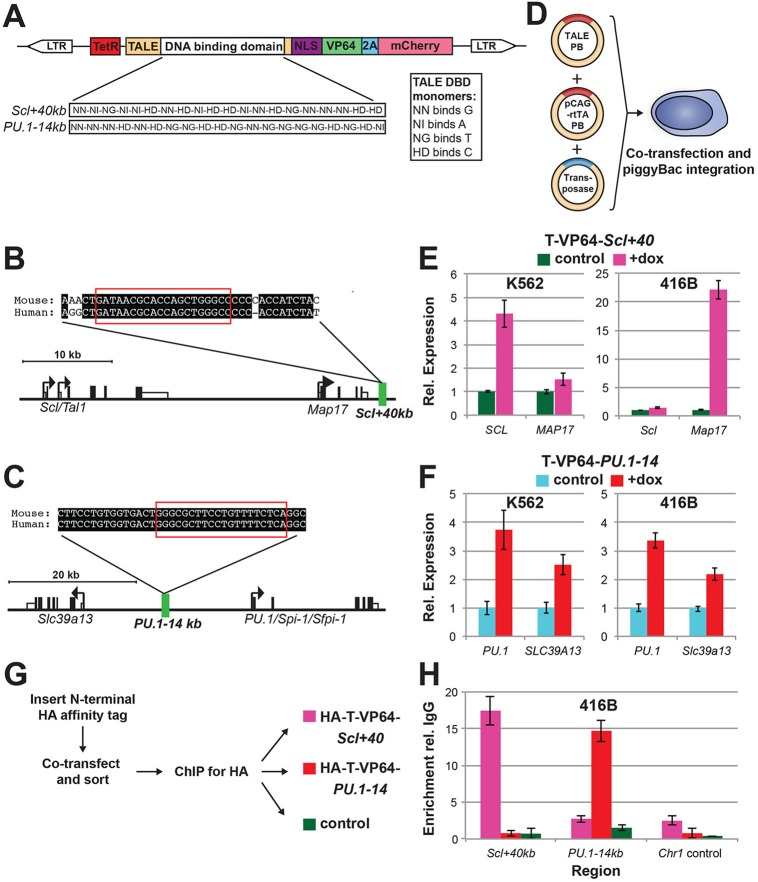
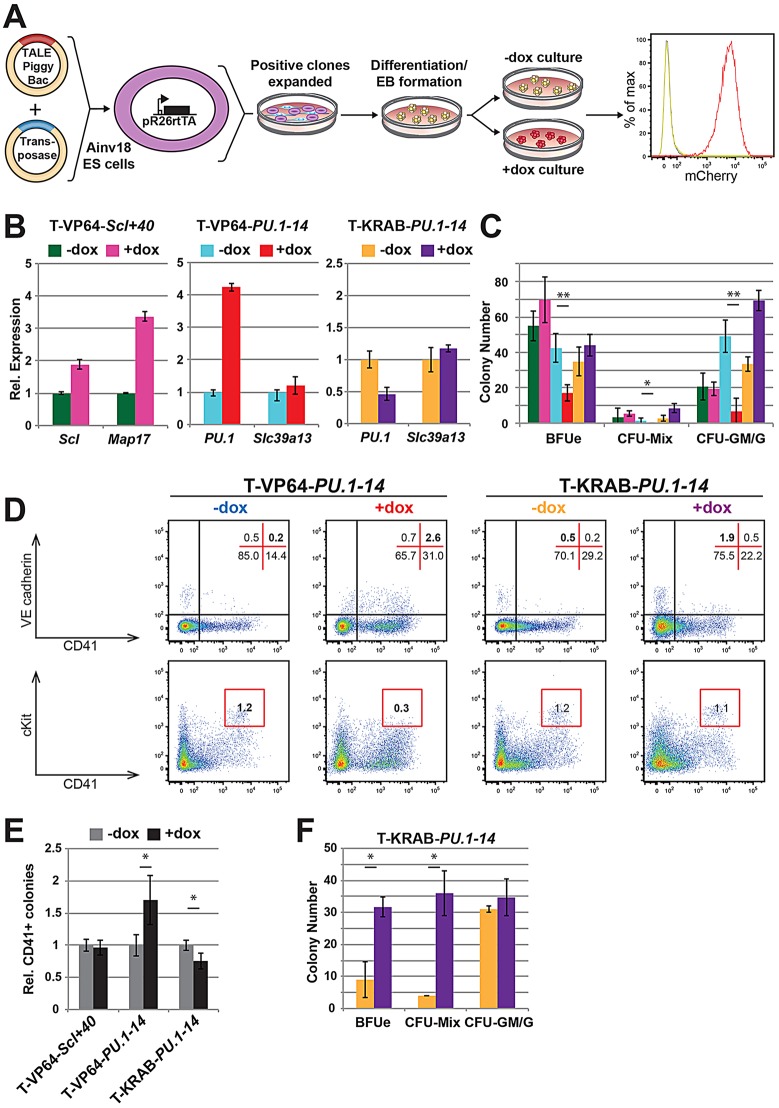
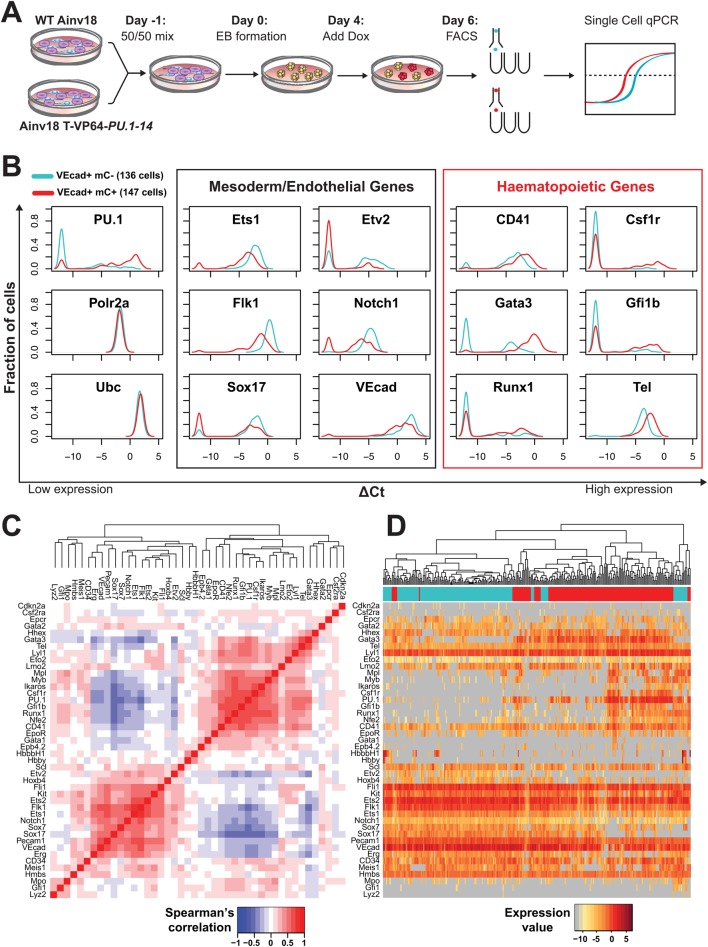
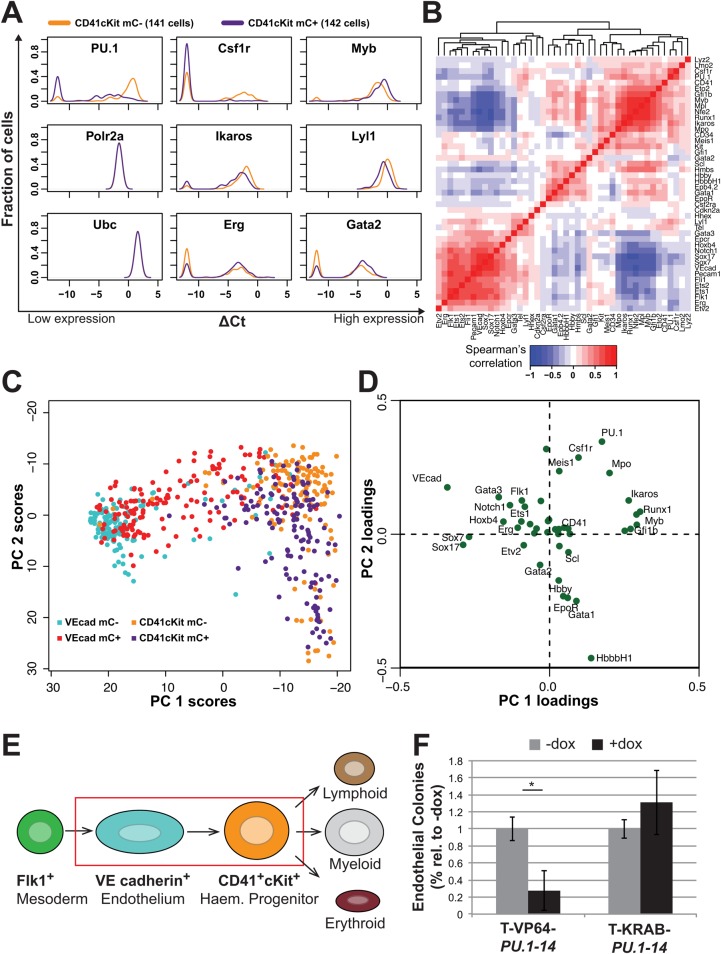
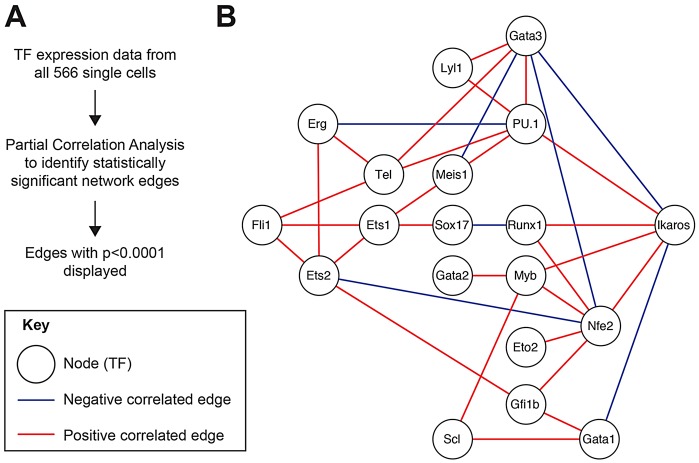
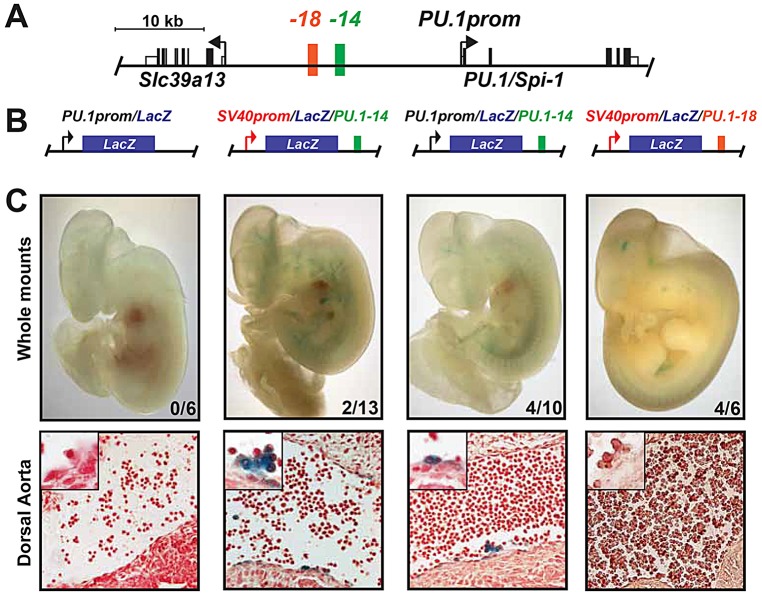
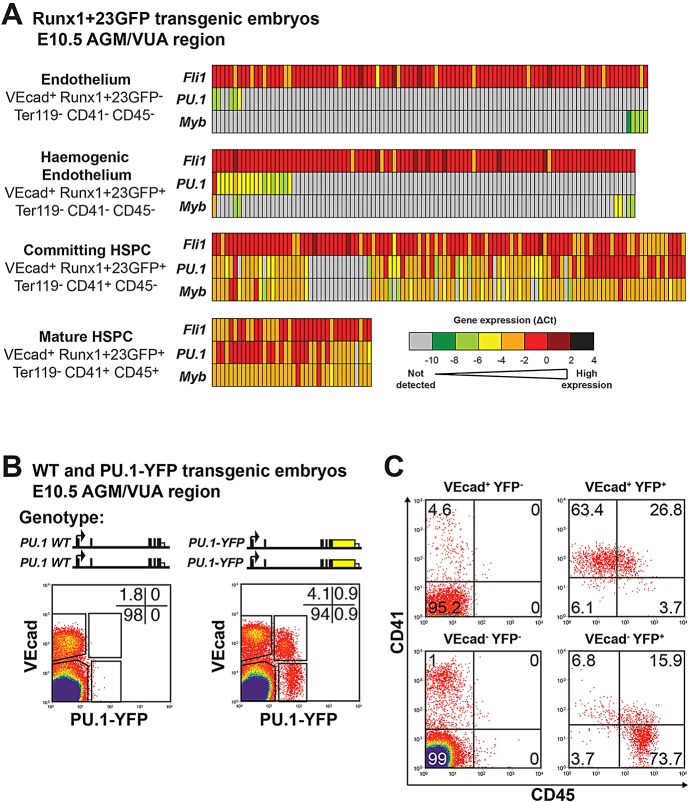
Transcription factors (TFs) act within wider regulatory networks to control cell identity and fate. Numerous TFs, including Scl (Tal1) and PU.1 (Spi1), are known regulators of developmental and adult haematopoiesis, but how they act within wider TF networks is still poorly understood. Transcription activator-like effectors (TALEs) are a novel class of genetic tool based on the modular DNA-binding domains of Xanthomonas TAL proteins, which enable DNA sequence-specific targeting and the manipulation of endogenous gene expression. Here, we report TALEs engineered to target the PU.1-14kb and Scl+40kb transcriptional enhancers as efficient new tools to perturb the expression of these key haematopoietic TFs. We confirmed the efficiency of these TALEs at the single-cell level using high-throughput RT-qPCR, which also allowed us to assess the consequences of both PU.1 activation and repression on wider TF networks during developmental haematopoiesis. Combined with comprehensive cellular assays, these experiments uncovered novel roles for PU.1 during early haematopoietic specification. Finally, transgenic mouse studies confirmed that the PU.1-14kb element is active at sites of definitive haematopoiesis in vivo and PU.1 is detectable in haemogenic endothelium and early committing blood cells. We therefore establish TALEs as powerful new tools to study the functionality of transcriptional networks that control developmental processes such as early haematopoiesis.

Keywords: Haematopoiesis; PU.1; Regulatory networks; Transcription activator-like effectors.


Figures

Fig. 1.
Fig. 1.
Experimental approach and validation. (A) Structure of the TALE-expressing piggyBac construct. TALE cDNA consists of the TALE sequence followed by a nuclear localisation domain (NLS), a VP64 domain, 2A (peptide sequence cleaved after translation) and mCherry fluorescent protein. TALE cDNA was cloned downstream of a tetracycline-responsive promoter (TetR), and within piggyBac long terminal repeats (LTRs) for stable transposase-mediated genomic integration. The DNA-binding domain (DBD) within the TALE sequence consists of twenty monomers. Monomers contain two hypervariable amino acids that determine nucleotide-binding specificity: NN, NI, NG or HD. (B,C) Schematics of the mouse Scl (Tal1) (B) and PU.1 (Spi1) (C) genomic loci, with the Scl+40kb and PU.1-14kb elements highlighted in green. TALE target sites within conserved (between human and mouse) sequences are highlighted in red. (D) Experimental approach to express TALEs in cell lines. K562 and 416B cells were co-transfected with the TALE-expressing piggyBac (TALE-PB) from A, a constitutively expressing rtTA piggyBac vector (pCAG-rtTA-PB) and a piggyBac transposase, to create inducible TALE-expressing cells. (E) Effect of expressing TALE-VP64 targeting Scl+40kb (T-VP64-Scl+40) in human K562 (left) and mouse 416B (right) cells on neighbouring gene expression. T-VP64-Scl+40 was expressed for 48 h by addition of doxycycline (dox) and gene expression in mCherry+ cells was determined relative to mCherry control cells. Error bars indicate s.d. of technical triplicates, and are representative of two biological replicates. (F) As in E, but for TALE-VP64 targeting PU.1-14kb (T-VP64-PU.1-14). (G) ChIP approach for TALE-VP64 proteins in H. An HA affinity tag was inserted at the N-terminus of the TALE-VP64 (HA-T-VP64); 416B cells were co-transfected as in D, sorted and ChIP performed 48 h after dox addition. (H) ChIP-qPCR enrichment of HA-tagged TALE-VP64 (HA-T-VP64) relative to IgG in HA-T-VP64-Scl+40 (pink), HA-T-VP64-PU.1-14 (red) and untransfected 416B control (green) cells at Scl+40kb, PU.1-14kb and a control region on chromosome 1 (Chr1). Error bars indicate s.d. of technical triplicates from one biological experiment.
Fig. 2.
Fig. 2.
Transient TALE expression affects haematopoietic cell fate decisions. (A) Experimental approach using Ainv18 ESC differentiation to study TALE-mediated gene expression perturbations in haematopoiesis. Mouse Ainv18 ESCs constitutively expressing rtTA from the Rosa26 locus (pR26-rtTA) were co-transfected with the inducible TALE-PB construct and transposase. Targeted ESCs were differentiated into embryoid bodies (EBs), and TALE expression induced at day 4 by addition of dox. Changes in gene expression, colony potential and surface marker phenotype were analysed at day 6 in the +dox EBs as compared with −dox controls. (B) Gene expression changes in day 6 EBs after induction of T-VP64-Scl+40 (left), T-VP64-PU.1-14 (middle) and T-KRAB-PU.1-14 (right). Error bars indicate s.e.m. of three biological replicates. (C) Representative haematopoietic colony numbers from 1×10⁵ day 6 EB cells (colour scheme as in B). Colonies were grown in methylcellulose supplemented with SCF, IL-3, IL-6 and Epo. See supplementary material Fig. S2A for images of representative colony forming units (CFUs) scored. Error bars indicate s.d. of technical triplicates. *P<0.05, **P<0.01 (Student's t-test), from three biological replicates. (D) Flow cytometry plots of day 6 EB cells showing Flk1 versus CD41 (top) and VEcad versus CD41 (bottom). Representative staining patterns are shown for T-VP64-PU.1-14 (left) and T-KRAB-PU.1-14 (right). The distribution of cells within quadrants/gates is shown by percentage. (E) Relative number of day 4 Flk1+ EB-derived colonies containing CD41+ haematopoietic cells, grown on OP9 stromal cells for 84 h (dox added after 36 h). See supplementary material Fig. S2G for representative image of scored colony. Error bars indicate s.e.m. from biological triplicates. *P<0.01 (Student's t-test), from three biological replicates. (F) Average numbers of haematopoietic colonies from 1×10⁵ day 6 EB T-KRAB-PU.1-14 cells plated onto confluent OP9 stromal cells for 24 h before CFU assay initiated by addition of methylcellulose supplemented with SCF, IL-3, IL-6 and Epo. Colour scheme as in B. Error bars indicate s.d. of three biological replicates. *P<0.05 (Student's t-test), from three biological replicates.
Fig. 3.
Fig. 3.
Single-cell analysis of TALE-mediated PU.1 expression in haematopoietic precursors. (A) Strategy for single-cell gene expression analysis of TALE-mediated perturbations. Wild-type (WT) Ainv18 and T-VP64-PU.1-14-targeted ESCs were passaged once as a 1:1 mix before EB formation. Dox was added at day 4 and EBs disaggregated at day 6. Single VEcad+ cells (mCherry+ and mCherry sorted as T-VP64-PU.1-14-expressing and WT, respectively) were sorted into lysis buffer. Single-tube reverse transcription and targeted pre-amplification were undertaken, followed by multiplexed qPCR gene expression analysis using the Fluidigm Biomark platform. (B) Density plots of gene expression in day 6 EB VEcad+ mCherry (136 WT Ainv18; cyan) and VEcad+ mCherry+ (147 T-VP64-PU.1-14 expressing; red) cells. The density indicates the fraction of cells at each expression level, relative to housekeeping genes (Polr2a and Ubc). Cells with non-detected gene expression were set to –12. See supplementary material Fig. S3 for density plots for all 48 genes analysed in these two populations. (C) Hierarchical clustering of Spearman rank correlations between all pairs of genes (excluding housekeepers) from all 283 VEcad+ cells (red, positive correlation; blue, negative correlation). (D) Hierarchical clustering of the 283 VEcad+ cells according to gene expression, with genes ordered according to C (dark red, highly expressed; grey, non-expressed). Top bar indicates cell type: cyan, mCherry; red, mCherry+.
Fig. 4.
Fig. 4.
TALE-mediated expression perturbations suggest transcriptional interactions during blood specification. (A) Density plots of gene expression in day 6 EB CD41+ cKithi (CD41cKit) mCherry (141 WT Ainv18; orange) and CD41cKit mCherry+ (142 Ainv18 expressing T-KRAB-PU.1-14; purple) cells. The density indicates the fraction of cells at each expression level, relative to housekeeping genes (Polr2a and Ubc). Cells with non-detected gene expression were set to –12. See supplementary material Fig. S4 for density plots for all 48 genes analysed in these two populations. (B) Hierarchical clustering of Spearman rank correlations between all pairs of genes (excluding housekeepers) using gene expression data from all 566 cells (VEcad+ and CD41cKit). (C) Principal component analysis (PCA) of the 566 VEcad+ and CD41cKit cells, in the first and second components, from the expression of all 44 genes (excluding the four housekeeping genes). (D) Principal component loadings indicate the extent to which each gene contributes to the separation of cells along each component in C. (E) Current model of definitive haematopoietic specification from Flk1+ mesoderm through a haemogenic endothelial precursor to a haematopoietic stem/progenitor that can differentiate into lymphoid, myeloid or erythroid lineages. (F) Endothelial potential of TALE-expressing VEcad+ cells, as a percentage of –dox control cells. *P<0.01 (Student's t-test), from three biological replicates.
Fig. 5.
Fig. 5.
Partial correlation analysis identifies a highly interconnected TF network that is active during the EHT. (A) Method used to build the TF network model in B. (B) TF network model showing highly statistically significant interactions (P<0.0001) as connections (edges) between TFs (nodes).
Fig. 6.
Fig. 6.
The PU.1-14kb element is active at sites of mouse definitive haematopoiesis in vivo. (A) Schematic of the PU.1 locus highlighting the relevant cis-regulatory elements. (B) Reporter constructs used for transient transgenic embryo generation. (C) Representative lacZ+ whole-mount images and section images (original magnification: 40×) of the dorsal aorta of E11.5 transgenic embryos carrying the reporters illustrated above in B. Insets (original magnification: 100×) show cell clusters budding from the ventral side of the dorsal aorta. The number of lacZ+ embryos/number of total PCR+ embryos analysed is indicated in each whole-mount image.
Fig. 7.
Fig. 7.
PU.1 expression is induced during the EHT in vivo. (A) Fli1, PU.1 and Myb single-cell RT-qPCR gene expression data from Swiers et al. (2013) in the AGM region and vitelline and umbilical artery (AGM+VUA) for VEcad+ cell populations from E10.5 embryos carrying a Runx1+23kb-GFP enhancer reporter. Gene expression levels are displayed as a heatmap of ΔCt relative to housekeeping genes (Ubc and Atp5a1). (B) Genotype schematics and flow cytometry plots displaying VEcad versus PU.1-YFP expression for the Ter119 (Ly76) cell population from the AGM+VUA of E10.5 WT (left) and homozygous PU.1-YFP transgenic (right) embryos. Data were collected from pooled embryos and are representative of two E10-10.5 embryo litters. (C) Flow cytometry plots displaying CD41 versus CD45 expression for the populations within the VEcad/PU.1-YFP gates in B for the homozygous PU.1-YFP transgenic embryos.

References

    1. Altschul, S. F., Gish, W., Miller, W., Myers, E. W. and Lipman, D. J. (1990). Basic local alignment search tool. J. Mol. Biol. 215, 403-410 10.1016/S0022-2836(05)80360-2 - DOI - PubMed
    1. Bailey, N. T. J. (1995). Statistical Methods in Biology. Cambridge, UK: Cambridge University Press.
    1. Beerli, R. R., Segal, D. J., Dreier, B. and Barbas, C. F., III (1998). Toward controlling gene expression at will: specific regulation of the erbB-2/HER-2 promoter by using polydactyl zinc finger proteins constructed from modular building blocks. Proc. Natl. Acad. Sci. USA 95, 14628-14633 10.1073/pnas.95.25.14628 - DOI - PMC - PubMed
    1. Boch, J. and Bonas, U. (2010). Xanthomonas AvrBs3 family-type III effectors: discovery and function. Annu. Rev. Phytopathol. 48, 419-436 10.1146/annurev-phyto-080508-081936 - DOI - PubMed
    1. Boch, J., Scholze, H., Schornack, S., Landgraf, A., Hahn, S., Kay, S., Lahaye, T., Nickstadt, A. and Bonas, U. (2009). Breaking the code of DNA binding specificity of TAL-type III effectors. Science 326, 1509-1512 10.1126/science.1178811 - DOI - PubMed

Publication types