. 2014 Oct 16;514(7522):385-8.
doi: 10.1038/nature13813. Epub 2014 Sep 24.

Rb suppresses human cone-precursor-derived retinoblastoma tumours

Affiliations

Rb suppresses human cone-precursor-derived retinoblastoma tumours

Xiaoliang L Xu et al. Nature. .

Abstract

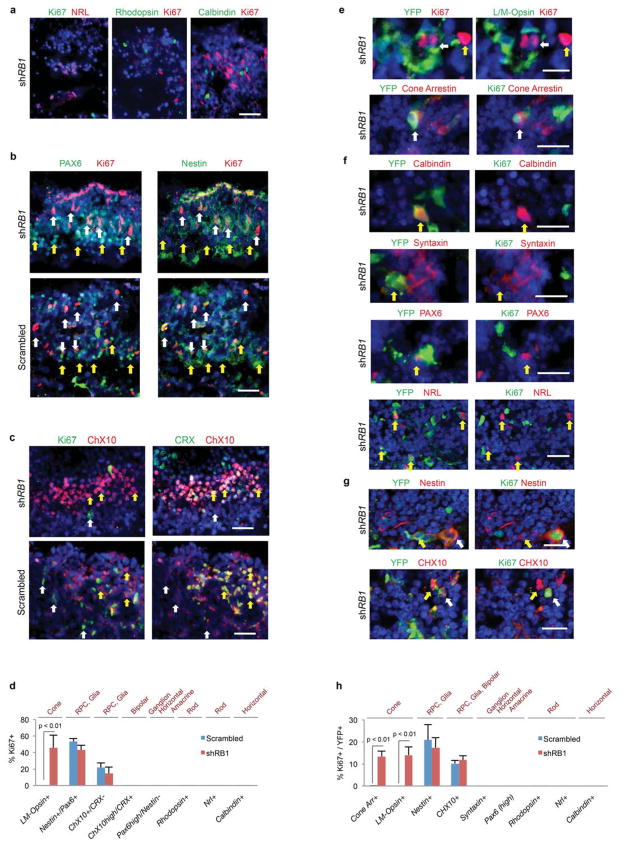
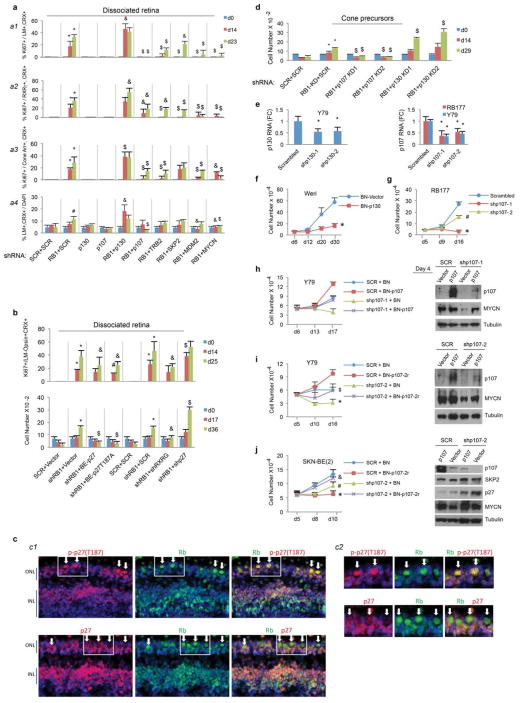
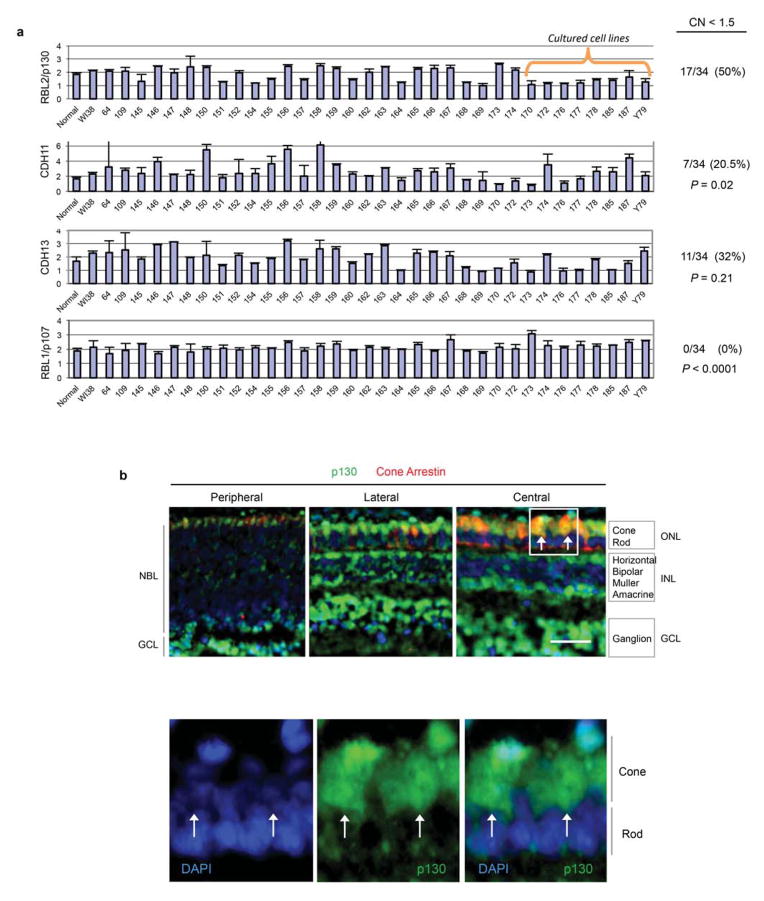
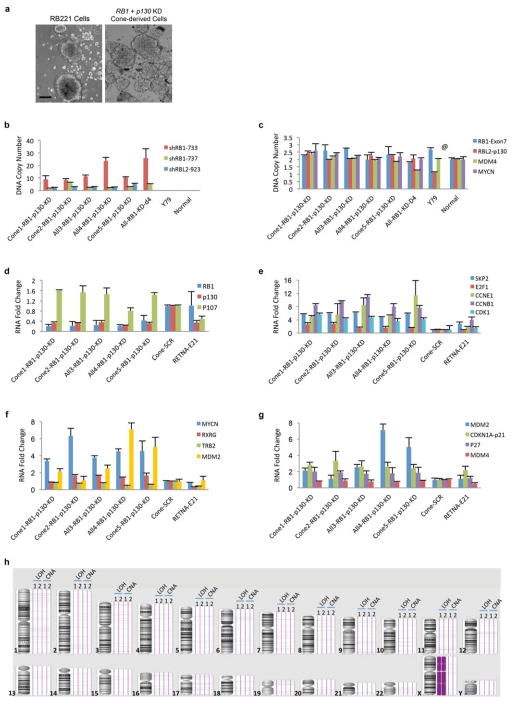
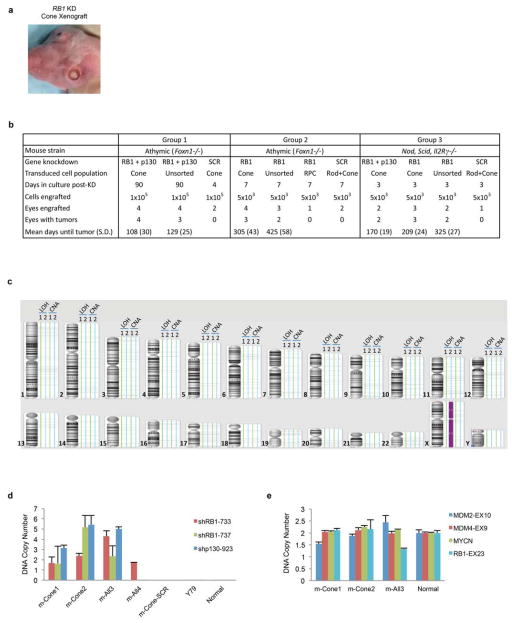
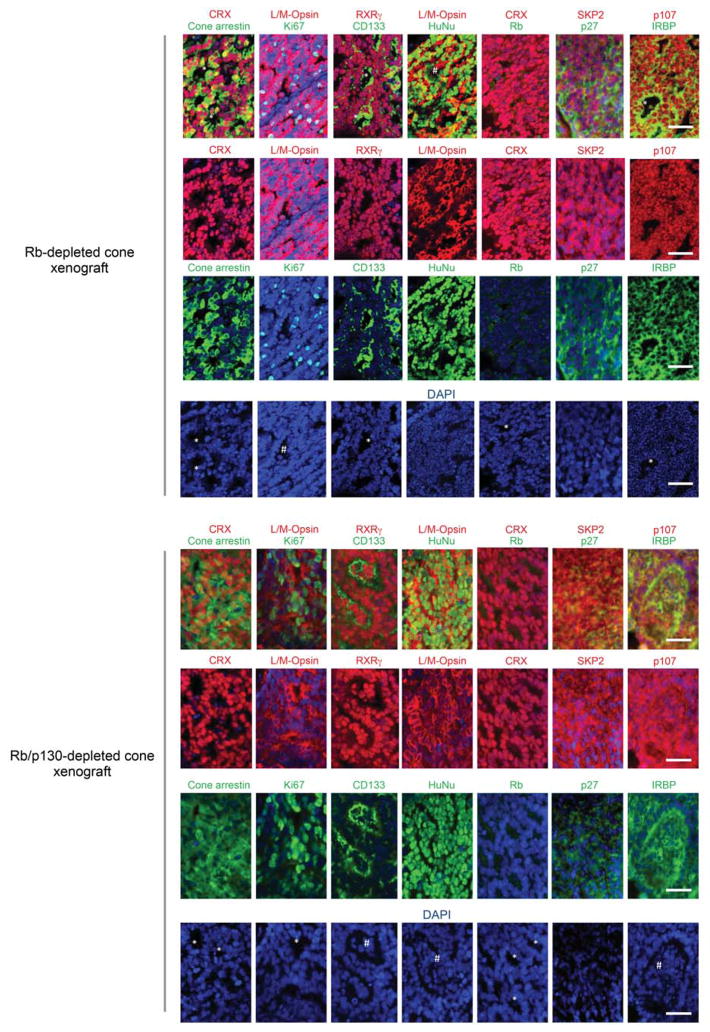
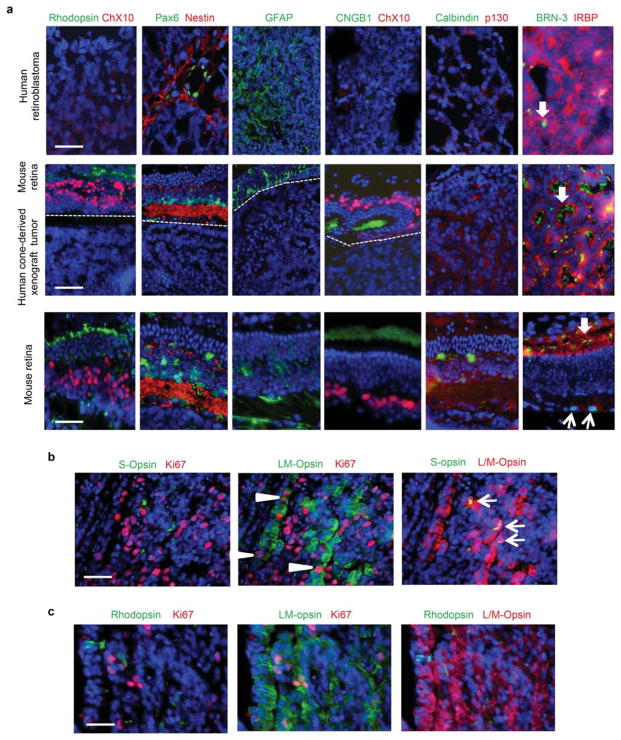
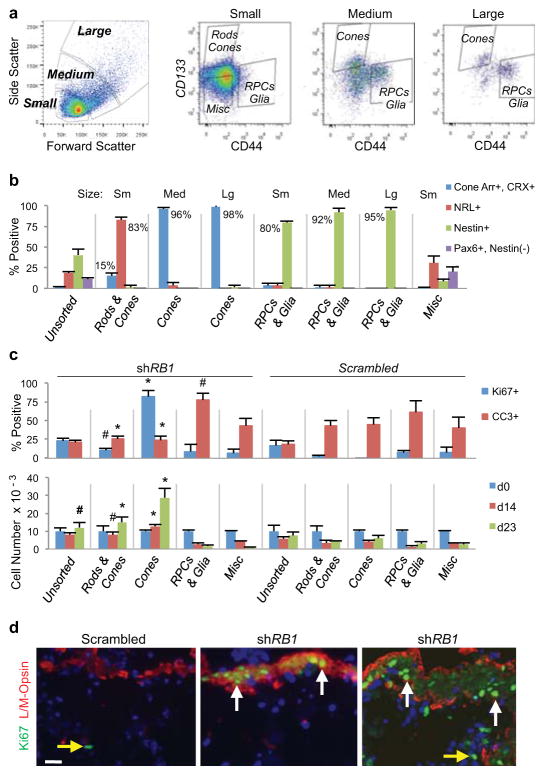
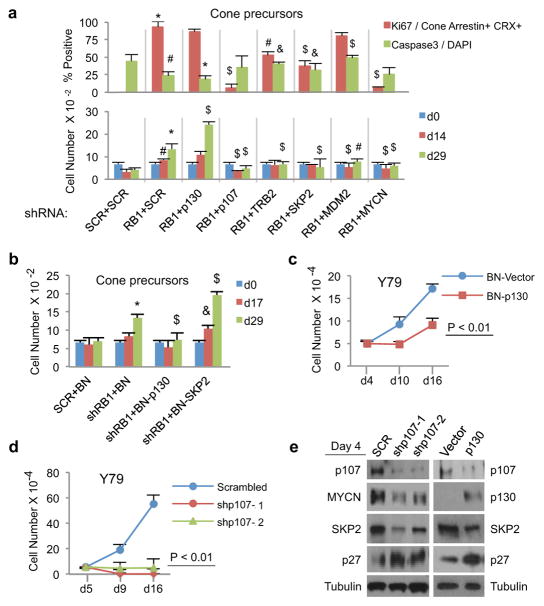
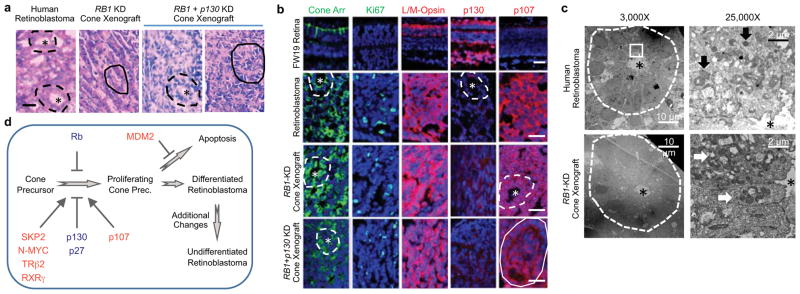
Retinoblastoma is a childhood retinal tumour that initiates in response to biallelic RB1 inactivation and loss of functional retinoblastoma (Rb) protein. Although Rb has diverse tumour-suppressor functions and is inactivated in many cancers, germline RB1 mutations predispose to retinoblastoma far more strongly than to other malignancies. This tropism suggests that retinal cell-type-specific circuitry sensitizes to Rb loss, yet the nature of the circuitry and the cell type in which it operates have been unclear. Here we show that post-mitotic human cone precursors are uniquely sensitive to Rb depletion. Rb knockdown induced cone precursor proliferation in prospectively isolated populations and in intact retina. Proliferation followed the induction of E2F-regulated genes, and depended on factors having strong expression in maturing cone precursors and crucial roles in retinoblastoma cell proliferation, including MYCN and MDM2. Proliferation of Rb-depleted cones and retinoblastoma cells also depended on the Rb-related protein p107, SKP2, and a p27 downregulation associated with cone precursor maturation. Moreover, Rb-depleted cone precursors formed tumours in orthotopic xenografts with histological features and protein expression typical of human retinoblastoma. These findings provide a compelling molecular rationale for a cone precursor origin of retinoblastoma. More generally, they demonstrate that cell-type-specific circuitry can collaborate with an initiating oncogenic mutation to enable tumorigenesis.


Conflict of interest statement

The authors declare no competing financial interests.

Figures

Extended Data Figure 1
Extended Data Figure 1. Proliferation of cone-like cells after Rb depletion in dissociated FW19 retina
a, Decreased Rb protein in L/M-opsin+ or TRβ2+ cells (arrows) on days 5 or 23, and decreased RB1 RNA or Rb protein on day 4 after shRB1-733 transduction. b, Cone arrestin+, CRX+ cells (arrows) with or without Ki67 co-expression. c, Ki67+, cone arrestin+ cells first detected 9 or 14 days post-transduction in two experiments. d–f Co-staining of Ki67 with RXRγ/CRX at 14 days, (d) with cone arrestin/CRX at 14 days (e), or with L/M-opsin/CRX at 23 days (f) after transduction with shRB1-733 or a scrambled control. g, Percentage of cells co-expressing Ki67 with L/M-opsin/CRX, RXRγ/CRX, or cone arrestin/CRX, 23 days post-transduction. h, Prevalence of cells co-staining for L/M-opsin/CRX, RXRγ/CRX, or cone arrestin/CRX 23 days post-transduction. i, Ki67 not detected in cells expressing markers of rods (NRL), ganglion cells (BRN-3), bipolar cells (strong CHX10), or horizontal cells (PROX1) 14 days post-transduction. j, Co-expression of Ki67 with markers of RPCs (nestin, white arrows) or Müller glia (CRALBP or SOX2), but not in PAX6+, nestin(−) ganglion, amacrine, or horizontal cells (yellow arrows) 14 days post-transduction. k–l, EdU incorporation in cells expressing markers of cones (cone arrestin/CRX or RXRγ/CRX, yellow arrows in l) but not in cells expressing markers of rods (CNGA1, CNGB1), bipolar cells (CHX10/CRX), or ganglion, horizontal, or amacrine cells (syntaxin) (white arrows in l) 14 days after transduction. Black lines above labels demarcate distinct fields. m, Co-staining of phosphohistone H3 (PH3) with cone arrestin/CRX 23 days post-transduction. n, Apoptosis marker CC3 in cells expressing RPC and glial marker nestin 14 days after transduction with RB1-directed shRNAs (yellow arrow) but not with scrambled control (white arrow). Values and error bars are means and standard deviation of triplicate assays for all Extended Data figures. Scale bars, 20 μm. Data are representative of at least two independent experiments.
Extended Data Figure 2
Extended Data Figure 2. FACS isolation of retinal cell populations
Retinal cells were isolated according to size, CD133, and CD44 staining. In Study 1, cell type compositions in each fraction (a) were determined by immunostaining with cone arrestin/CRX (b, e), NRL (c), and nestin/PAX6 (d, f). In study 2, cell type compositions (i) were determined by immunostaining with RXRγ/CRX, nestin/CHX10, nestin/PAX6, and CRALBP (j, k). The percentages of the predominant cell types in each population (a, i) and marker specificities (g) are indicated. h, Cone-specific co-staining of cone arrestin and GNAT2 (top) and cone-specific co-staining of RXRγ and CRX (bottom) in FW19 retina. l, Co-staining of cells for EdU and cone arrestin/CRX or RXRγ/CRX 14 days after transduction of the cone-enriched medium plus large CD133hi, CD44(−) population isolated as in (i–k) with two RB1 shRNAs (yellow arrows) but not with the scrambled control (white arrows). In both studies, CD133hi, CD44(−) medium and large size populations mainly consisted of cells expressing cone markers (CRX/cone arrestin or CRX/RXRγ). The CD133hi, CD44(−)small population mainly consisted of cells expressing a rod marker (NRL) with a variable proportion expressing cone markers. All CD133lo, CD44+ populations mainly consisted of cells co-expressing RPC and glial markers (nestin/PAX6, nestin/CHX10, or CRALBP). The CD133lo, CD44(−) small size population consisted of cells with diverse immunophenotypes. Scale bars, 30 μm.
Extended Data Figure 3
Extended Data Figure 3. Cone precursor gene expression response to Rb depletion
a–b, Fold change in RNA level relative to day 0 uninfected cells for (a) RB1, or (b) the indicated E2F-responsive genes, or (c) the indicated p53-regulated genes, 3 and 6 days after transduction of each population with a mixture of shRB1-733 and shRB1-737, or with scrambled control. Comparing shRB1 and scrambled control: *, p < 0.01; #, p < 0.05. Data are representative of two sets of qPCR analyses.
Extended Data Figure 4
Extended Data Figure 4. Proliferation status of retinal cells other than cones 15 days after shRB1 transduction of intact FW19 retinas
a–c, Combined transduction with pLKO-shRB1-733 and -737. a, Ki67 not detected in NRL+, or rhodopsin+ rod photoreceptors or in calbindin+ horizontal cells. b, Ki67 detected in PAX6lo, nestin+ RPCs (white arrows) but not in PAX6hi, nestin(−) horizontal, amacrine, or ganglion cells (yellow arrows). c, Ki67 detected in CHX10+, CRX(−) RPCs (white arrows) but not in CHX10+, CRX+ bipolar cells (yellow arrows). d, Percentage of cells co-expressing Ki67 and retinal cell markers. e–h, Transduction with yellow fluorescent protein-marked pLKO-YFP-shRB1-733. e, Ki67 detected in YFP+, L/M-opsin+ or YFP+, cone arrestin+ cone precursors (white arrows) and in undefined YFP(−) cell (yellow arrow). f, Ki67 not detected in YFP+, calbindin+ horizontal cells, YFP+, syntaxin+ or YFP+, PAX6+ amacrine cells, or in YFP+, NRL+ rod precursors. g, Ki67 detected (white arrows) or not detected (yellow arrows) in YFP+, nestin+ RPCs or glia, or in YFP+, CHX10+ RPCs or bipolar cells. h, Proportion of Ki67+ cells co-expressing YFP and retinal markers after transduction with pLKO-YFP-shRB1-733 or scrambled control. Scale bars, 20 μm. Analyses in a–d and in e–h represent two independent experiments. All Immunostaining was performed at least twice.
Extended Data Figure 5
Extended Data Figure 5. Effect of cone- and Rb-related circuitry on cone precursor response to Rb depletion
a, Percentage of Ki67+ cells among L/M-opsin+, CRX+ cells (a1), among RXRγ+, CRX+ cells (a2), or among cone arrestin+, CRX+ cells (a3); and percentage of L/M-opsin+, CRX+ cells among all cells with DAPI+ nuclei (a4) after transduction of dissociated FW18 retina with shRB1-733 and shRNAs against p130, p107, TRβ2, SKP2, MDM2, and MYCN. b, Percentage of Ki67+ cells among L/M-opsin+, CRX+ cone-like cells (top) and proliferative response (bottom) after transduction of dissociated FW18 retina with shRB1-733 and with shRNAs against RXRγ and p27 (shRNAs 856+930), or with overexpression of p27 and p27-T187A. c, High-level Thr187 phosphorylated p27 (p27-T187-Ph, top) coinciding with down-regulation of total p27 (bottom) and prominent Rb during cone precursor maturation. c1, Perifoveal region of FW18 retina. c2, Enlarged view of boxed regions in c1. Arrows, cone precursors identified by large, strongly Rb+ nuclei and lack of p27 signal in characteristic outer nuclear layer (ONL) position,. d, Effect of two RBL1-p107 or two RBL2-p130 shRNAs on proliferation of Rb-depleted isolated cone precursors. e, Knockdown efficacy of two RBL1-p107 or two RBL2-p130 shRNAs in Y79 and RB177 retinoblastoma cells. f, Impaired proliferation of Weri-RB1 retinoblastoma cells after transduction with BN-p130 compared to vector control. g, Impaired proliferation of RB177 retinoblastoma cells following transduction with two p107 shRNAs. h, i, Impaired proliferation and MYCN expression in Y79 cells following p107 knockdown with two p107-directed shRNAs, and rescue by shRNA-resistant BN-p107 constructs. j, p27 accumulation and growth suppression following p107 knockdown with shp107-2 rescued by BN-p107-2r in RB1-wild type SKN-BE(2) neuroblastoma cells. p107 overexpression impaired SKN-BE(2) growth, contrary to its effects in Y79. Compared to SCR or Vector control: *, P < 0.01. #, P < 0.05. Compared to RB1-KD+SCR or RB1-KD+BN-Vector: $, P < 0.01; &, P < 0.05. Compared to shp107-2+BN-Vector: $, P < 0.01; &, P<0.05 (h and i). Data are representative of more than two independent experiments except for SKN-BE(2) analyses.
Extended Data Figure 6
Extended Data Figure 6. p130 copy number in retinoblastomas and cone precursor expression
a, DNA copy number of RBL2/p130, other 16q genes implicated in retinoblastoma (CDH11, CDH13), and RBL1/p107 determined by qPCR (n=6). The percentage of retinoblastomas with copy number (CN) < 1.5 was higher for RBL2/p130 than for other 16q genes (summarized at right, P values relative to RBL2/p130 using Fisher’s exact test). b, p130 in peripheral, lateral, and central FW19 retina. Boxed region in maturing central retina (top) and enlarged view (bottom) show prominent p130 in weakly DAPI-stained cone precursor nuclei (arrows). Scale bars, 40 μm. Data are representative of at least two independent experiments.
Extended Data Figure 7
Extended Data Figure 7. Characterization of Rb/p130-depleted retinoblastoma-like cells
a, Similar appearance of Rb/p130-depleted cones and early passage retinoblastoma cells. Scale bars, 40 μm. b–c, DNA copy number of shRNA vectors (b) or selected genes (c) in cell lines derived from Rb/p130-depleted cone precursors (Cone1, Cone2, Cone5) or from Rb/p130-depleted unsorted retinal cells (All3, All4), in Rb-depleted unsorted retinal cells four days post-transduction (All-RB1-KD-d4), in Y79 cells, or in FW21 retina (Normal) (n=6). All cell lines retained RB1 and RBL2/p130 shRNA vectors and lacked RB1 or RBL2/p130 copy number alterations. @, Y79 MYCN copy number (~78) not shown. d–g, RT-qPCR gene expression analyses in the indicated cell lines relative to cones transduced with scrambled control or FW21 retina (n=6). d, All cell lines had diminished RB1 and RBL2/p130 expression. e–g, Altered expression of cell cycle related (e), cone-related (f), and apoptosis related (g) genes. h, SNP-array analysis of two Rb/p130-depleted cone precursor cell lines (1, 2), revealing no megabase-size loss of heterozygosity (LOH) or copy number alterations (CNAs). Data are representative of at least two analyses (b–g) or analyses of two cell lines (h).
Extended Data Figure 8
Extended Data Figure 8. Characterization of Rb- and Rb/p130-depleted cone precursor tumors
a, Intraocular tumor four months after Rb-depleted cone precursor xenograft. b, Summary of subretinal xenograft Groups 1, 2, 3. Sample size was as needed to assess tumor phenotypes. Mice were randomly assigned to different xenograft regimens and the investigator blinded to the assignment until the tumor analyses. Two mice with early death were excluded from the analyses. c, SNP-array analysis of one Rb/p130-depleted (tumor 1) or one Rb-depleted (tumor 2) cone precursor-derived tumors from xenograft Group 3, revealing no megabase-size LOH or CNAs. d, qPCR analysis of pLKO shRNA vector copy number in tumors derived from Rb/p130-depleted cone precursors (m-Cone1, m-Cone2) or from Rb/p130-depleted unsorted retinal cells (m-All3, m-All4), or in mouse ocular tissue (m-Cone-SCR), Y79 cells, or FW19 retina (Normal). All tumors retained shRB1 and/or shp130 vector sequences, confirming their engineered cone precursor origin. e, qPCR analysis of MDM2, MDM4, RB1, and MYCN copy number in three cone-derived tumors and normal retina (n=6). DNA copy number data (d, e) are representative of two analyses.
Extended Data Figure 9
Extended Data Figure 9. Cone and cell cycle related proteins in Rb- or Rb/p130-depleted cone precursor tumors engrafted three days post-transduction
The vast majority of tumor cells expressed human nuclear antigen (HuNU), confirming their xenograft origin. They also expressed cone-related proteins (CRX, cone arrestin, L/M-opsin, RXRγ, CD133, and IRBP) and proliferation-related proteins (Ki67, SKP2, p107, and cytoplasmic p27) but lacked Rb. Tumors had elements resembling Flexner-Wintersteiner rosettes (*) and fleurettes (#). Scale bars, 40 μm. Data are representative of three independent experiments.
Extended Data Figure 10
Extended Data Figure 10. Analysis of non-cone cell markers in cone precursor-derived tumors and retinoblastomas
a, Proteins detected in normal retina but not in cone-derived tumor or human retinoblastoma cells included markers of rods (rhodopsin, CNGB1), RPCs and Müller glia (nestin, GFAP, PAX6), bipolar cells (CHX10), ganglion, amacrine, and horizontal cells (calbindin, PAX6), and ganglion cells (nuclear BRN-3, thin arrows in mouse retina). PAX6+, nestin+ cells detected in human retinoblastoma were previously found to be Rb+ non-tumor cells from tumor-associated retina. An uncharacterized cytoplasmic BRN-3 signal (bold arrows) was detected in mouse photoreceptor outer segments and in cone-derived tumor and retinoblastoma rosettes. b, L/M-opsin was detected in most cone-derived tumor cells. However, rare cells co-expressed S-opsin and L/M-opsin (arrows), as in immature L/M-cone precursors and human retinoblastomas. c, One tumor had rare rhodopsin+, Ki67(−) cells but no detected rhodopsin+, Ki67+ cells, as in a previously characterized retinoma-like regions. Scale bars, 40 μm. Data are representative of three independent xenograft experiments.
Figure 1
Figure 1. Proliferation of cone-like cells after Rb depletion in dissociated FW19 retina
a–b, Responses to shRB1-733. a, Percentage Ki67+ among cells expressing the indicated retinal cell type-specific markers. b, Prevalence of DAPI+ cells expressing cone (L/M-opsin, CRX), RPC (nestin), or Müller glia (CRALBP) markers. c–d, Responses to shRB1-733 and -737. c, Proliferation of cells, of which >90% were cone marker+ at day 60. d, Percentage CC3+ among cells expressing the indicated markers. For all figures, values and error bars represent means plus standard deviations of triplicate assays; P-values are from unpaired Student’s t-test. All results replicated at least twice.
Figure 2
Figure 2. Cone precursor response to Rb depletion
a, FW18 retinal cells sorted by size, CD133, and CD44, with major populations designated. b, Percentage of cone arrestin+, CRX+ cones, NRL+ rods, nestin+ RPCs and glia, and PAX6+, nestin(−) horizontal, amacrine, or ganglion cells in each population. c, Responses to shRB1-733. Percentage of Ki67+ or CC3+ cells at 14 days (top) and cell numbers at days 14 and 23 (bottom). Compared to scrambled control, *, p < 0.01. #, p < 0.05. Results representative of three independent experiments. d, Ki67+, L/M-opsin+ cone precursors (white arrows) in FW19 fovea 15 days post-transduction with shRB1-733 and -737; and Ki67+, L/M-opsin(−) cells likely representing RPCs or glia (yellow arrows) after shRB1 or scrambled control. Scale bars, 20 μm.
Figure 3
Figure 3. Effects of cone precursor circuitry on response to Rb depletion
a, Prevalence of Ki67+ or CC3+ cells (top) and cell numbers (bottom) after shRNA transduction of isolated cone precursors. b, Isolated cone precursor response to co-transduction with shRB1 and BN vector, BN-p130, or BN-SKP2. c–e, Effect of p130 overexpression or p107 knockdown on Y79 proliferation (c, d) and protein expression (e). Compared to scrambled and vector controls: *, p < 0.01. #, p < 0.05. Compared to shRB1 + SCR (a) or to shRB1 + BN (b): $, p < 0.01. &, p < 0.05. Results represent at least two independent experiments.
Figure 4
Figure 4. Rb- or Rb/p130-depleted cone precursor tumors
a, Hematoxylin and eosin-stained Rb- and Rb/p130-depleted cone xenograft tumors and human retinoblastoma (n=4). Dashed lines, Flexner-Wintersteiner rosettes. Solid lines, fleurettes. *, rosette cavity. b, Cone and cell cycle related protein expression in human retinoblastoma and cone xenografts (n=6). Scale bars, 40 μm (a,b). c, Transmission electron microscopy of Flexner-Wintersteiner rosettes in human retinoblastoma and a cone-derived tumor, with mitochondria (arrows) between nuclei and rosette cavity (n=2). 25,000X image from boxed area (top). Results are representative of at least two experiments. d, Model of cone-precursor retinoblastoma origin highlighting proteins that suppressed (blue) or promoted (red) the proliferative response.

Comment in

References

    1. Weinberg RA. The retinoblastoma protein and cell cycle control. Cell. 1995;81:323–330. - PubMed
    1. Cobrinik D. Pocket proteins and cell cycle control. Oncogene. 2005;24:2796–2809. - PubMed
    1. Gordon GM, Du W. Conserved RB functions in development and tumor suppression. Protein Cell. 2011;2:864–878. - PMC - PubMed
    1. Viatour P, Sage J. Newly identified aspects of tumor suppression by RB. Dis Model Mech. 2011;4:581–585. - PMC - PubMed
    1. Manning AL, Dyson NJ. RB: mitotic implications of a tumour suppressor. Nat Rev Cancer. 2012;12:220–226. - PMC - PubMed

Publication types

MeSH terms

Associated data