. 2014 Sep 25;15(1):812.
doi: 10.1186/1471-2164-15-812.

Plant protein peptidase inhibitors: an evolutionary overview based on comparative genomics

Affiliations

Plant protein peptidase inhibitors: an evolutionary overview based on comparative genomics

María Estrella Santamaría et al. BMC Genomics. .

Abstract

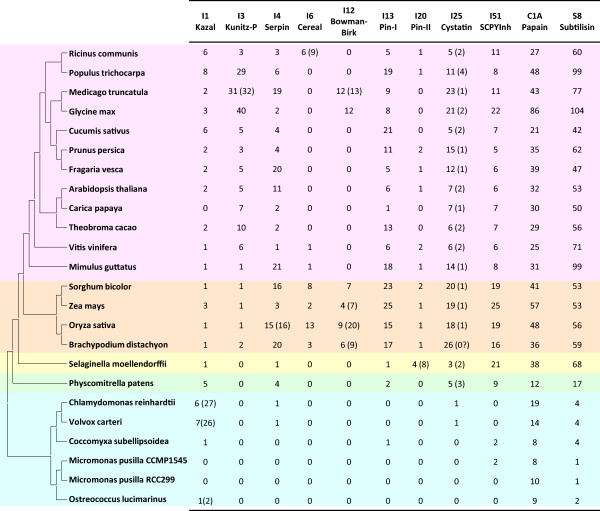
Background: Peptidases are key proteins involved in essential plant physiological processes. Although protein peptidase inhibitors are essential molecules that modulate peptidase activity, their global presence in different plant species remains still unknown. Comparative genomic analyses are powerful tools to get advanced knowledge into the presence and evolution of both, peptidases and their inhibitors across the Viridiplantae kingdom.

Results: A genomic comparative analysis of peptidase inhibitors and several groups of peptidases in representative species of different plant taxonomic groups has been performed. The results point out: i) clade-specific presence is common to many families of peptidase inhibitors, being some families present in most land plants; ii) variability is a widespread feature for peptidase inhibitory families, with abundant species-specific (or clade-specific) gene family proliferations; iii) peptidases are more conserved in different plant clades, being C1A papain and S8 subtilisin families present in all species analyzed; and iv) a moderate correlation among peptidases and their inhibitors suggests that inhibitors proliferated to control both endogenous and exogenous peptidases.

Conclusions: Comparative genomics has provided valuable insights on plant peptidase inhibitor families and could explain the evolutionary reasons that lead to the current variable repertoire of peptidase inhibitors in specific plant clades.


Figures

Figure 1
Figure 1
Number of peptidases and their inhibitors in selected plant species. Schematic evolutionary tree of fully sequenced plants including for each species the number of peptidase (C1A Papain and S8 Subtilisin) and peptidase inhibitory sequences (I plus number and name). In brackets the number of inhibitory domains for families I1, I3, I4, I6, I12 and I20; or the number of sequences with an additional cystatin-like domain for I25 family. Algae species are coloured in blue, moss in green, pseudofern in yellow, monocots in orange and eudicots in pink.
Figure 2
Figure 2
Features of I1 Kazal peptidase inhibitors. (A) Three-dimensional structure of a typical I1 inhibitor (2KCX). Cysteines are highlighted as balls and sticks and coloured in CPK. Red, α-helix; yellow, β-sheets. (B) Schematic PhyML phylogenetic tree using the selected Kazal sequences from the different plant species. Coloured triangles show clade-specific gene proliferations.
Figure 3
Figure 3
Features of I3 Kunitz-P peptidase inhibitors. (A) Three-dimensional structure of a typical I3 inhibitor (1AVU). Cysteines are highlighted as balls and sticks and coloured in CPK. Yellow, β-sheets. (B) Schematic PhyML phylogenetic tree using the selected Kunitz-P sequences from the different plant species. Coloured triangles show clade-specific gene proliferations.
Figure 4
Figure 4
Features of I4 Serpin peptidase inhibitors. (A) Three-dimensional structure of a typical I4 inhibitor (3LE2). Red, α-helices; yellow, β-sheets. (B) Schematic PhyML phylogenetic tree using the selected Serpin sequences from the different plant species. Coloured triangles show clade-specific gene proliferations.
Figure 5
Figure 5
Features of I6 Cereal peptidase inhibitors. (A) Three-dimensional structure of a typical I1 inhibitor (1B1U). Cysteines are highlighted as balls and sticks and coloured in CPK. Red, α-helices; yellow, β-sheets. (B) Schematic PhyML phylogenetic tree using the selected Cereal sequences from the different plant species. Coloured triangles show clade-specific gene proliferations.
Figure 6
Figure 6
Features of I12 Bowman-Birk peptidase inhibitors. (A) Three-dimensional structure of typical I12 inhibitors with one domain (1BBI) or two domains (2FJ8). Cysteines are highlighted as balls and sticks and coloured in CPK. Yellow, β-sheets. (B) Schematic PhyML phylogenetic tree using the selected Bowman-Birk sequences from the different plant species. Coloured triangles show clade-specific gene proliferations.
Figure 7
Figure 7
Features of I13 Pin-I peptidase inhibitors. (A) Three-dimensional structure of a typical I1 inhibitor (2CI2). Red, α-helix; yellow, β-sheets. (B) Schematic PhyML phylogenetic tree using the selected Pin-I sequences from the different plant species. Coloured triangles show clade-specific gene proliferations.
Figure 8
Figure 8
Features of I20 Pin-II peptidase inhibitors. (A) Three-dimensional structure of a typical I20 inhibitor (4SGB). Cysteines are highlighted as balls and sticks and coloured in CPK. Yellow, β-sheets. (B) Schematic PhyML phylogenetic tree using the selected Pin-II sequences from the different plant species. Coloured triangles show clade-specific gene proliferations.
Figure 9
Figure 9
Features of I25 Cystatin peptidase inhibitors. (A) Three-dimensional structure of a typical I25 inhibitor (1EQK). Red, α-helix; yellow, β-sheets. (B) Schematic PhyML phylogenetic tree using the selected Cystatin sequences from the different plant species. Coloured triangles show clade-specific gene proliferations.
Figure 10
Figure 10
Features of I51 SCPYInh peptidase inhibitors. (A) Three-dimensional structure of a typical I51 inhibitor (1KN3). Red, α-helices; yellow, β-sheets. (B) Schematic PhyML phylogenetic tree using the selected SCPYInh sequences from the different plant species. Coloured triangles show clade-specific gene proliferations.
Figure 11
Figure 11
Evolutionary correlations between peptidases and their inhibitors. Dispersion graphs showing the linear trend of the two variables represented, the correlation coefficient of the line (R2) and the statistical result of the correlation statistical analysis (ρ; p < 0.05). Variables represented: (A) Number of S8 Subtilisins and their inhibitors. (B) Number of C1A Papains and their inhibitors. (C) Number of C1A Papains and S8 Subtilisins. (D) Number of S8 inhibitors and C1A inhibitors.

References

    1. van der Hoorn RA. Plant proteases: from phenotypes to molecular mechanisms. Annu Rev Plant Biol. 2008;59:191–223. doi: 10.1146/annurev.arplant.59.032607.092835. - DOI - PubMed
    1. Pesquet E. Plant proteases - from detection to function. Physiol Plant. 2012;145(1):1–4. doi: 10.1111/j.1399-3054.2012.01614.x. - DOI - PubMed
    1. Schaller A. A cut above the rest: the regulatory function of plant proteases. Planta. 2004;220(2):183–197. doi: 10.1007/s00425-004-1407-2. - DOI - PubMed
    1. Roberts IN, Caputo C, Criado MV, Funk C. Senescence-associated proteases in plants. Physiol Plant. 2012;145(1):130–139. doi: 10.1111/j.1399-3054.2012.01574.x. - DOI - PubMed
    1. Tan-Wilson AL, Wilson KA. Mobilization of seed protein reserves. Physiol Plant. 2012;145(1):140–153. doi: 10.1111/j.1399-3054.2011.01535.x. - DOI - PubMed

Publication types

LinkOut - more resources