. 2014 Sep 24;6(255):255ra132.
doi: 10.1126/scitranslmed.3008810.

Treatment of heterotopic ossification through remote ATP hydrolysis

Affiliations

Treatment of heterotopic ossification through remote ATP hydrolysis

Jonathan R Peterson et al. Sci Transl Med. .

Abstract

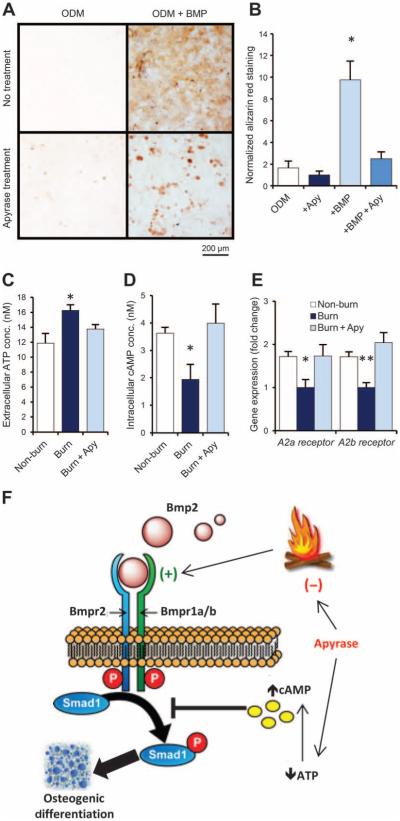
Heterotopic ossification (HO) is the pathologic development of ectopic bone in soft tissues because of a local or systemic inflammatory insult, such as burn injury or trauma. In HO, mesenchymal stem cells (MSCs) are inappropriately activated to undergo osteogenic differentiation. Through the correlation of in vitro assays and in vivo studies (dorsal scald burn with Achilles tenotomy), we have shown that burn injury enhances the osteogenic potential of MSCs and causes ectopic endochondral heterotopic bone formation and functional contractures through bone morphogenetic protein-mediated canonical SMAD signaling. We further demonstrated a prevention strategy for HO through adenosine triphosphate (ATP) hydrolysis at the burn site using apyrase. Burn site apyrase treatment decreased ATP, increased adenosine 3',5'-monophosphate, and decreased phosphorylation of SMAD1/5/8 in MSCs in vitro. This ATP hydrolysis also decreased HO formation and mitigated functional impairment in vivo. Similarly, selective inhibition of SMAD1/5/8 phosphorylation with LDN-193189 decreased HO formation and increased range of motion at the injury site in our burn model in vivo. Our results suggest that burn injury-exacerbated HO formation can be treated through therapeutics that target burn site ATP hydrolysis and modulation of SMAD1/5/8 phosphorylation.


Figures

Fig. 1
Fig. 1. Burn injury alters gene expression in adipose tissue
Schematic shows regulation and expression relationships between genes related to canonical SMAD signaling after burn injury. Within adipose tissue, 28 of 75 genes within the BMP-mediated SMAD canonical signaling pathway were up-regulated after burn injury (n = 244 burn patients, n = 35 control patients). Genes that were up-regulated at least twofold compared to controls are noted by red, whereas down-regulation of at least twofold compared to controls is indicated by green, with the actual ratio of up- or down-regulation indicated by the numbers below the gene names.
Fig. 2
Fig. 2. Burn injury promotes the osteogenic differentiation of hMSCs
(A) Gene expression in hMSCs was assessed with quantitative reverse transcription polymerase chain reaction (qRT-PCR) of mRNA collected from human adipose-derived MSCs. Cells were derived from burn patients within the first 3 days of their burn injury (n = 3) and from age- and sex-matched control patients (n = 3). mRNA was harvested from the cells after 7 days of exposure to ODM and assessed for relative expression of osteogenic genes RUNX2, OCN, and BMP-2. Data are means ± SD. RUNX2, P = 0.008; OCN, P = 0.017; BMP-2, P = 0.005 (t test). (B) Micrographs of ALP and alizarin red staining of hMSCs after 7 and 14 days of exposure to ODM, respectively. Scale bar, 200 mm. (C) Quantification of ALP enzyme activity in burn and control hMSCs after 7 days of exposure to ODM. ALP activity was measured colorimetrically and normalized to total protein content for each group. Data are means ± SD (n =3 per group). P = 0.002 (t test). (D) Quantification of osteoid with alizarin red stain. Deposits were solubilized with cetylpyridinium chloride and analyzed colorimetrically. Data are means ± SD (n =3 per group). P = 0.001 (t test). (E and F) Western blot image (E) and analysis (F) of protein content in hMSCs after 7 days of exposure to ODM. Images were analyzed by densitometry and normalized to loading controls (α-tubulin). The ratio of phosphorylated (activated) SMAD protein (pSMAD1/5/8) to non-activated SMAD5 protein was increased in hMSCs from burn patients. Data are means ± SD (n = 3 per group). pSMAD1/5/8, P = 0.024; SMAD5, P = 0.490 (t test). *P < 0.05, **P < 0.01.
Fig. 3
Fig. 3. Apyrase application at the burn site abrogates the osteogenic potential of mMSCs
(A) Gene expression in mMSCs was assessed by qRT-PCR of mRNA collected from mMSCs harvested 2 hours after burn injury, burn injury with immediate application of topical apyrase (Apy) solution, or exposure to room temperature water (non-burn control). mRNA was harvested from the cells after 7 days of exposure to ODM and assessed for the relative expression of osteogenic genes Ocn and Runx2. Data are means ± SD (n = 3 per group). Ocn, P = 0.037; Runx2, P = 0.042 [analysis of variance (ANOVA)]. (B) Micrographs of ALP and alizarin red staining of mMSCs after 7 and 14 days of exposure to ODM, respectively. Scale bar, 200 μm. (C) Quantification of ALP enzyme activity in burn, burn + apyrase, and non-burn control mMSCs after 7 days of exposure to ODM. ALP activity was measured colorimetrically and normalized to total protein content for each group. Data are means ± SD (n = 3 per group). P = 0.018 (ANOVA). (D) Quantification of osteoid deposition with alizarin red stain. Data are means ± SD (n = 3 per group). P = 0.001 (ANOVA). (E and F) Western blot image (E) and analysis (F) of protein content in mMSCs after 7 days of exposure to ODM. Images were analyzed by densitometry and normalized to loading controls (α-tubulin). Data are means ± SD (n = 3 per group). pSMAD1/5/8, P = 0.047; SMAD5, P = 0.682 (ANOVA). (G and H) Alizarin red stain (G) and quantification of osteoid deposition (H) of burn and non-burn mMSCs exposed to ODM for 2 weeks with or without supplementation with LDN-193189. Scale bar, 200 mm. Data are means ± SD (n = 3 per group). P = 0.001 (ANOVA). *P < 0.05, **P < 0.01.
Fig. 4
Fig. 4. Apyrase mitigates burn injury–induced osteogenic differentiation of MSCs by modulating ATP signaling
(A and B) Alizarin red stain (A) and quantification of osteoid deposition (B) of mMSCs collected from adipose tissue of untreated C57BL/6 mice and exposed to ODM with or without supplementation with recombinant BMP-2 ligand (200 ng/ml) and/or apyrase (4 U/ml). Scale bar, 200 μm. Data are means ± SD (n = 3 per group). P = 0.030 (ANOVA). (C) ATP assay for extracellular ATP concentrations in mMSC cultures harvested from the adipose tissue of mice 2 hours after burn injury, burn injury + topical apyrase treatment, or non-burn control (exposure to room temperature water). Data are means ± SD (n = 3 per group). P = 0.038 (ANOVA). (D) cAMP assay for intracellular cAMP from the same cells, showing that intracellular cAMP is reduced in MSCs from burn mice and up-regulated with apyrase treatment. Data are means ± SD (n = 3 per group). P = 0.018 (ANOVA). (E) Gene expression for the adenosine receptors A2a and A2b in the same mMSCs, assessed by qRT-PCR of mRNA collected after 7 days of exposure to ODM. Both adenosine receptors were down-regulated after burn injury, but this effect was absent in mice that received apyrase treatment or no burn. Data are means ± SD (n = 3 per group). A2a receptor, P = 0.011; A2b receptor, P = 0.004 (ANOVA). (F) Schematic showing BMP and ATP signaling interactions in HO formation after burn injury. Apyrase application after burn injury limits ATP and BMP signaling, thereby reducing the otherwise up-regulated osteogenicity of MSCs. *P < 0.05, **P < 0.01.
Fig. 5
Fig. 5. Trauma-induced HO develops through an endochondral pathway and requires BMP signaling
(A) Photomicrographs of transverse sections of the tenotomy site 3 weeks after injury in mice with or without concurrent burn. Pentachrome (top) stains cartilage tissue in blue. Immunohisto-chemistry for SOX9 (middle) and collagen-2 (bottom) demonstrates positively staining cells in brown. Scale bar, 100 μm. (B) Pentachrome stain (top) of transverse sections through HO at the tenotomy site 9 weeks after injury from burn, burn + apyrase treatment, and non-burn control demonstrates mature bone (bright yellow), with cortical bone morphology most evident in burn mice. Cartilage appears blue. Scale bar, 100 μm. Hematoxylin and eosin (H&E) stain of transverse sections through HO (middle) at 9 weeks after injury demonstrates the development of mature bone marrow cavity (white arrowheads), suggesting its development from a multipotent precursor lineage. Scale bar, 100 μm. Vasculogenic signaling was assessed with CD31 (PECAM) immunohistochemistry on tangential sections through the tenotomy site before HO formation at 5 days after injury (bottom). Positively staining cells are brown (black arrowheads). Increased CD31 staining corresponded with the location of increased future HO development. Scale bar, 200 μm. (C) CD31 staining was quantified with Adobe Photoshop on five sequential tangential sections through the tenotomy site 5 days after injury. Data are mean CD31+-stained pixels normalized between groups to show fold change ± SD (n = 3 per group). P = 0.001 (ANOVA). (D) Representative, reconstructed micro–computed tomography (μCT) scan images of the tenotomized legs of burn and non-burn mice, which received LDN-193189 (6 mg/kg, daily intraperitoneal injections) or vehicle control. Serial scans were completed at 5 days and 3, 5, 7, and 9 weeks after injury. Reconstructed images show new, ectopic bone formation in blue. (E) Quantification of non-native heterotopic bone in the lower extremity was performed at each scan time point. Data are means ± SD (n = 6 per group). P = 0.001 at 7 and 9 weeks (ANOVA). *P < 0.05, **P < 0.01.
Fig. 6
Fig. 6. Apyrase treatment decreases SMAD signaling and burn-induced ectopic bone mineral deposition
(A) Immunohistochemical staining in tissue sections harvested 5 days after injury from the region where μCT showed the most robust HO development at later time points. Arrows indicate positively staining cells for OCN (left), RUNX2 (middle), and pSMAD1/5/8 (right). Scale bar, 100 μm. (B) Representative, reconstructed μCT scan images of the tenotomized legs of burn, burn + apyrase (topical), burn + apyrase (local application at tenotomy), and non-burn mice shown at 5 days and 3, 5, 7, and 9 weeks after injury. Gray areas indicate regions of new, ectopic bone development; red circle indicates nidus of HO development. (C) Quantification of non-native heterotopic bone in the lower extremity was performed at each scan time point. Data are means ± SD (n = 6 per group, except for local apyrase group, for which n = 3). P = 0.037 at 5 weeks, P = 0.001 at 7 and9 weeks (ANOVA). (D and E) Images (D) and quantification (E) of the ROM, defined as maximum angle of extension, for the tenotomized leg 9 weeks after injury. Data are means ± SD (n =6 per group). P = 0.004 (ANOVA). (F and G) Representative transverse micrographs stained with aniline blue (F) of the tenotomy site 9 weeks after injury. Images were recolored to show gray pixels representing native bone and black pixels designating HO, which was quantified (G) at every 75 sections along the longitudinal axis of the tenotomized limb. Data are means ± SD (n =3 per group). P = 0.038 (ANOVA). (H and I) Ex vivo Raman spectroscopic analysis of cross-sections of the tenotomy site 9 weeks after injury. Blue curve indicates cortical bone, red curve indicates areas of predicted HO formation based on μCT scan images, and black curve indicates areas of soft tissue from mice receiving Achilles tenotomy + burn injury (H) or tenotomy + burn with apyrase treatment at the burn site (I). Black arrows indicate intensity of the signal at the 958 cm−1 phosphate band. (J and K) Crystallinity (J) and mineral to matrix ratios (MTMR) (K) were significantly higher in the region of HO formation in untreated burn mice compared to burn mice receiving apyrase treatment. Data are means ± SD (n = 6 measurements, each measurement consisting of 10 spectra averaged over a 100-μm area of interest on cross-sections). Crystallinity, P = 0.015; MTMR, P = 0.021 (t test). *P < 0.05, **P < 0.01.

Comment in

  • Burned to the bone.
    Forsberg JA, Davis TA, Elster EA, Gimble JM. Forsberg JA, et al. Sci Transl Med. 2014 Sep 24;6(255):255fs37. doi: 10.1126/scitranslmed.3010168. Sci Transl Med. 2014. PMID: 25253672

References

    1. Forsberg JA, Potter BK. Heterotopic ossification in wartime wounds. J. Surg. Orthop. Adv. 2010;19:54–61. - PubMed
    1. Potter BK, Forsberg JA, Davis TA, Evans KN, Hawksworth JS, Tadaki D, Brown TS, Crane NJ, Burns TC, O’Brien FP, Elster EA. Heterotopic ossification following combat-related trauma. J. Bone Joint Surg. Am. 2010;92(Suppl. 2):74–89. - PubMed
    1. Hunt JL, Arnoldo BD, Kowalske K, Helm P, Purdue GF. Heterotopic ossification revisited: A 21-year surgical experience. J. Burn Care Res. 2006;27:535–540. - PubMed
    1. Tsionos I, Leclercq C, Rochet JM. Heterotopic ossification of the elbow in patients with burns. Results after early excision. J. Bone Joint Surg. Br. 2004;86:396–403. - PubMed
    1. Chakkalakal SA, Zhang D, Culbert AL, Convente MR, Caron RJ, Wright AC, Maidment AD, Kaplan FS, Shore EM. An Acvr1 R206H knock-in mouse has fibrodysplasia ossificans progressiva. J. Bone Miner. Res. 2012;27:1746–1756. - PMC - PubMed

Publication types

MeSH terms

Associated data