. 2014 Nov 7;289(45):30977-89.
doi: 10.1074/jbc.M114.599027. Epub 2014 Sep 24.

The Alzheimer disease protective mutation A2T modulates kinetic and thermodynamic properties of amyloid-β (Aβ) aggregation

Affiliations

The Alzheimer disease protective mutation A2T modulates kinetic and thermodynamic properties of amyloid-β (Aβ) aggregation

Iryna Benilova et al. J Biol Chem. .

Abstract

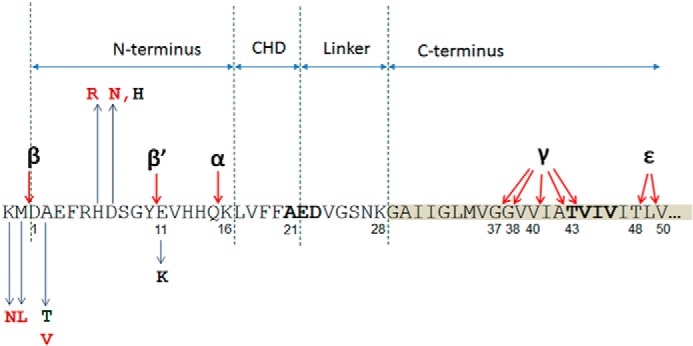
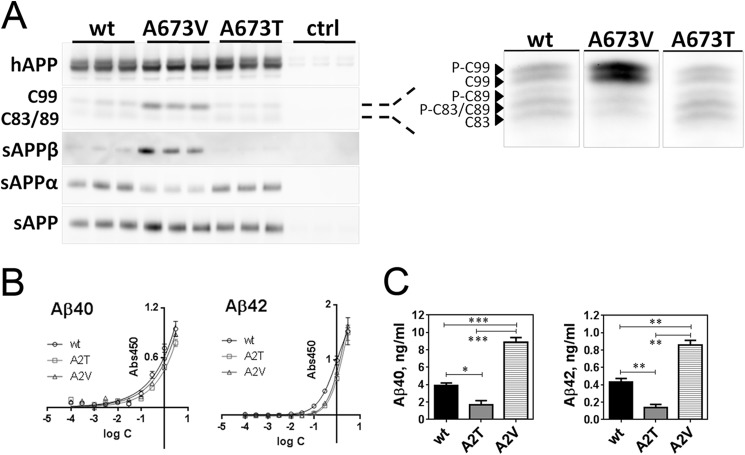
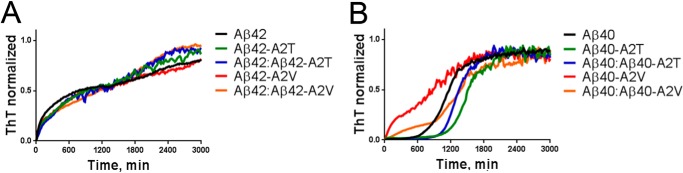
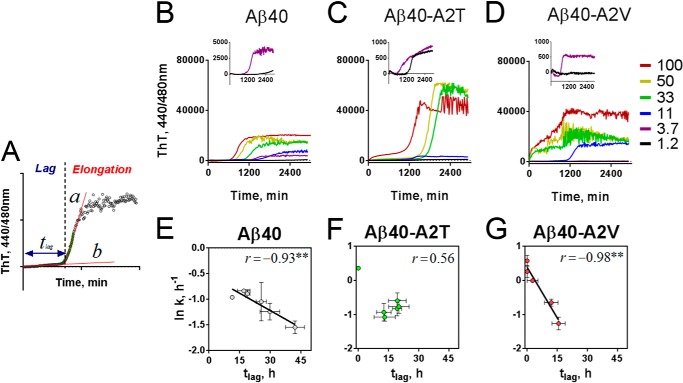
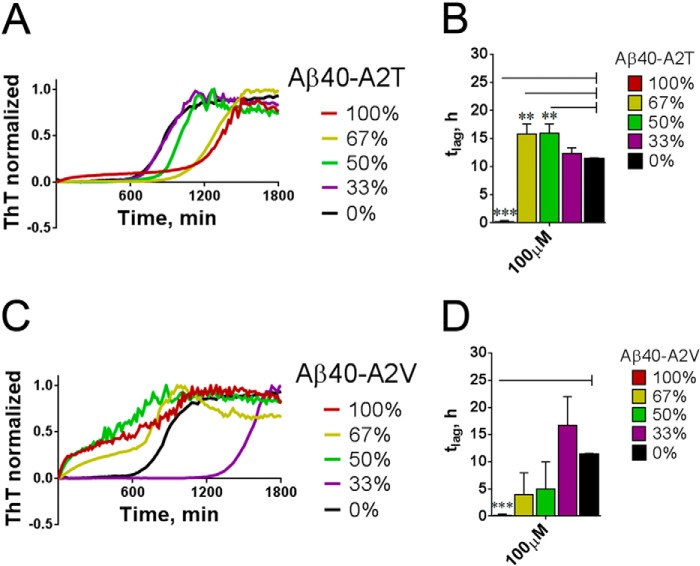
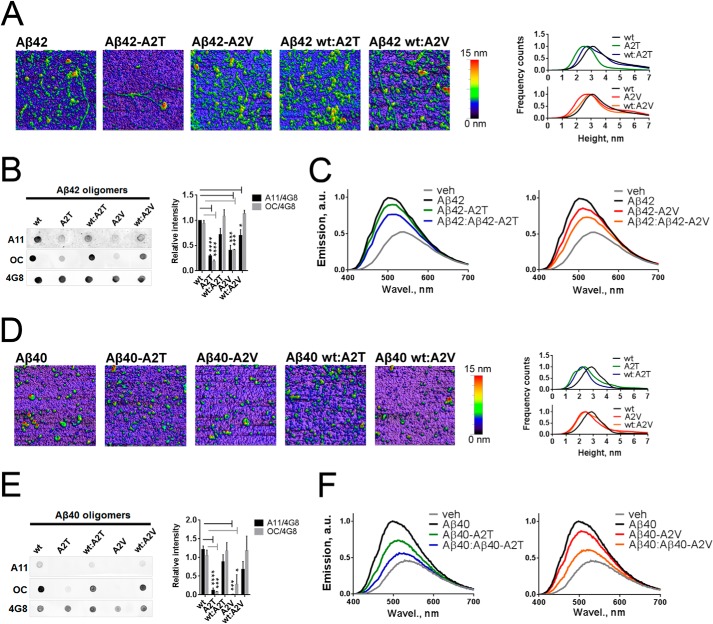
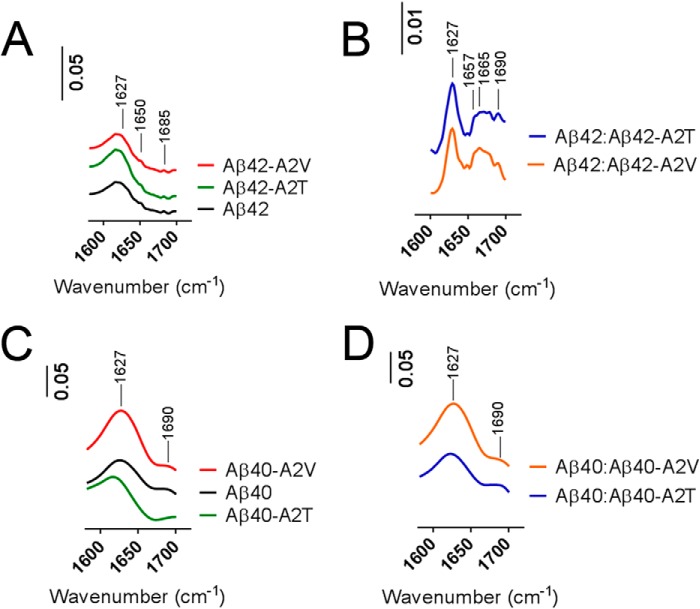
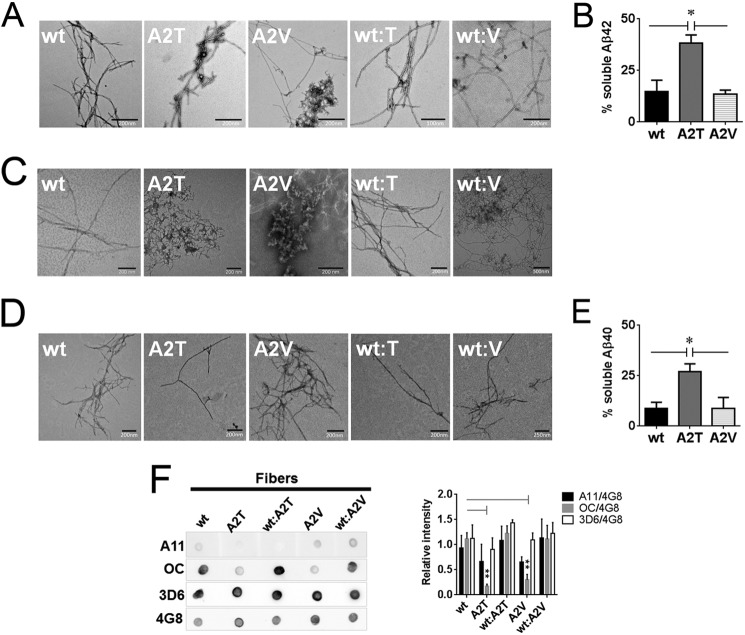
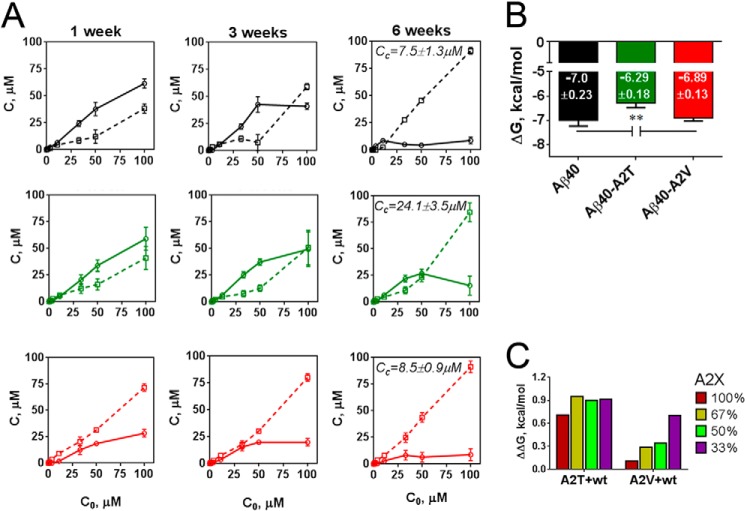
Missense mutations in alanine 673 of the amyloid precursor protein (APP), which corresponds to the second alanine of the amyloid β (Aβ) sequence, have dramatic impact on the risk for Alzheimer disease; A2V is causative, and A2T is protective. Assuming a crucial role of amyloid-Aβ in neurodegeneration, we hypothesized that both A2V and A2T mutations cause distinct changes in Aβ properties that may at least partially explain these completely different phenotypes. Using human APP-overexpressing primary neurons, we observed significantly decreased Aβ production in the A2T mutant along with an enhanced Aβ generation in the A2V mutant confirming earlier data from non-neuronal cell lines. More importantly, thioflavin T fluorescence assays revealed that the mutations, while having little effect on Aβ42 peptide aggregation, dramatically change the properties of the Aβ40 pool with A2V accelerating and A2T delaying aggregation of the Aβ peptides. In line with the kinetic data, Aβ A2T demonstrated an increase in the solubility at equilibrium, an effect that was also observed in all mixtures of the A2T mutant with the wild type Aβ40. We propose that in addition to the reduced β-secretase cleavage of APP, the impaired propensity to aggregate may be part of the protective effect conferred by A2T substitution. The interpretation of the protective effect of this mutation is thus much more complicated than proposed previously.

Keywords: Aggregation; Alzheimer Disease; Amyloid-β (Aβ); Kinetics; Thermodynamics.


Figures

FIGURE 1.
FIGURE 1.
Aβ sequence of amyloid precursor protein. N-terminal part of Aβ fragment (amino acids 1–16) is followed by a central hydrophobic domain (CHD, amino acids 17–21), which is separated from the hydrophobic C-terminal part by a hydrophilic linker (amino acids 22–28). Main secretase cleavage sites (α, β, β′, γ, and ϵ) are indicated with arrows. Pathogenic N-terminal substitutions in or next to the Aβ sequence are shown in red and include KM670/671NL (Swedish), A2V and H6R (English), and D7N (Tottori). Green, the protective mutation A2T. Black, putative pathogenic mutations E11K and D7H. Familial forms of Alzheimer disease mutation-prone amino acid clusters in central hydrophobic domain and at the C terminus are shown in bold.
FIGURE 2.
FIGURE 2.
Mutations in Ala-673 affect human APP processing in SFV-transduced primary neurons. A, fragments of human (h)APP(695) generated during β-, β′-, and γ-secretase-mediated cleavage in mouse primary neuronal culture. On the right, C-terminal fragments generated during APP proteolysis, resolved in 16% Tris/Tricine gel, and probed with B63 antibody against the C terminus of APP. C99 is CTFβ; C89 is CTFβ′; C83 is CTFα; and pCTFs are phosphorylated C-terminal fragments. Semi-quantification of band intensities is presented in Table 1. Note that A673T/A673V refers to the position of mutation in the longest APP isoform (APP(770)), and in APP(695) this corresponds to A598T/A598V and in the Aβ sequence to A2T/A2V. B, calibration curves for ELISA detection of Aβ mutants by using JRFAbN/25 antibody against N-terminal amino acids 1–7 of human Aβ, means ± S.D. C, ELISA quantification of soluble Aβ40 and Aβ42 released by mutant human APP(695)-overexpressing neurons, means + S.E. Statistical significance (unpaired two-tailed t test) is indicated by *, p < 0.05; **, p < 0.01; and ***, p < 0.001; n = 3.
FIGURE 3.
FIGURE 3.
Effect of the A2T and A2V mutations on the aggregation course of Aβ peptides. A, aggregation kinetics of Aβ42 variants monitored in the ThT incorporation assay in Tris/EDTA buffer, pH 7.4. Peptide concentration is 25 μm. Data were normalized to the maximal ThT signal, averaged from four experiments with two independent preparations from two independently produced batches, and a mean value was plotted. B, aggregation kinetics of Aβ40 variants monitored in the ThT incorporation assay in Tris/EDTA buffer, pH 7.4. Peptide concentration is 25 μm. Data were normalized to the maximal ThT signal and averaged from four experiments with two independent preparations from two independently produced batches, and a mean value was plotted.
FIGURE 4.
FIGURE 4.
A2T and A2V mutations affect the kinetic parameters of Aβ40 aggregation. A, kinetic analysis of the aggregation curves. Straight line (b) was fitted to the baseline, and duration of nucleation or lag phase (tlag) was determined as the time point where line b intersected straight line a, a tangent to the steepest region of the elongation curve (32). Growth rate k was determined as the slope of the exponential part of the elongation curve (green). B–D, concentration-dependent aggregation of Aβ40 variants (B, wild type Aβ40; C, Aβ40-A2T; and D, Aβ40-A2V) in Tris/EDTA buffer, pH 7.4, monitored in the thioflavin T incorporation assay. Inset, aggregation of correspondent mutants at 1.2 and 3.7 μm. E–G, correlation between kinetic parameters of wild type Aβ40 (E), Aβ40-A2T (F), and Aβ40-A2V (G). Note that A2T mutation disrupts the inverse correlation between k and tlag. Significance of correlation was evaluated from the Pearson coefficients shown on the plots and is indicated by **, p < 0.01, means ± S.E., n = 3.
FIGURE 5.
FIGURE 5.
Aβ40-A2T and Aβ40-A2V mutants alter the nucleation of wild type Aβ40. A, shift of the lag phase duration in the mixes of wild type Aβ40 with Aβ40-A2T mutant. Maximum concentration of Aβ peptide is 100 μm. B, change in the nucleation phase duration (tlag) in the mixtures of the wild type Aβ40 with different percentage (0–100%) of Aβ40-A2T. M+S.E., n = 3. Note a change of the pure A2T kinetics indicative of the lag phase abrogation at a very high concentration. Significance of difference from the wild type peptide (black bars) was evaluated in unpaired t test and is indicated by **, p < 0.01, ***, p < 0.001. C, shift of the lag phase duration in the mixes of the wild type Aβ40 with Aβ40-A2V mutant. Maximum concentration of Aβ peptide is 100 μm. Note an increase in the lag phase at 33% of A2V in the mixture, not observable at a higher proportion of the mutant. D, change in the nucleation phase duration (tlag) in the mixtures of the wild type Aβ40 with different percentage (0–100%) of Aβ40-A2V. Means + S.E., n = 3. Significance of difference from the wild type peptide (black bars) was evaluated in the unpaired two-tailed t test and is indicated by ***, p < 0.001.
FIGURE 6.
FIGURE 6.
Effect of the A2T and A2V mutations on morphology, immune reactivity, and hydrophobic exposure of Aβ42 and Aβ40 oligomers. A, atomic force micrographs of pre-aggregated Aβ42 mutants and their equimolar mixes with the wild type Aβ42. Images are obtained in the tapping mode under ambient conditions. On the right, Aβ42 oligomer size histograms obtained via the multiple Gaussian distribution fit of particle height. The peak height is 3.1 nm for WT Aβ42, 2.49 nm for Aβ40-A2T, 2.76 nm for Aβ40-A2V, 2.72 nm for Aβ40/Aβ40-A2T, and 2.9 nm for Aβ40/Aβ40-A2V. B, immune dot blot of Aβ42. Aβ was incubated in Tris/EDTA buffer, pH 7.4, for 2 h, blotted on a nitrocellulose membrane, and probed with conformation-specific antibodies A11 and OC. 4G8 antibody, which reacts with all Aβ forms, was used as a loading control. Right panel, densitometric analysis of Aβ42 dot blots. A11 and OC reactivity of mutant aggregates are significantly diminished compared with WT aggregates (unpaired two-tailed t test; *, p < 0.05; ***, p < 0.001; ****, p < 0.0001, means+ S.E., n = 4). C, normalized fluorescent spectra of 8-anilinonaphthalene-1-sulfonate (ANS) dye upon its binding to pre-aggregated Aβ42 mutants and their 1:1 mixes with the wild type peptide. A mean value from n = 2 in duplicate is plotted. Increased magnitude and blue shifting of ANS spectra are indicative of increased hydrophobicity of the ANS-bound entities. D, atomic force micrographs of pre-aggregated Aβ40 mutants and their equimolar mixes with the wild type Aβ40. Images are obtained in the tapping mode under ambient conditions. On the right: Aβ40 oligomer size histograms obtained via the multiple Gaussian distribution fit of particle height. The peak height is as follows: 2.87 nm for WT Aβ40, 2.38 nm for Aβ40-A2T, 2.43 nm for Aβ40-A2V, 2.19 nm for Aβ40/Aβ40-A2T, and 2.47 nm for Aβ40/Aβ40-A2V. E, immune dot blot of Aβ40. Aβ was incubated in Tris/EDTA buffer, pH 7.4, for 2 h, blotted on a nitrocellulose membrane, and probed with A11 and OC antibodies. 4G8 antibody was used as a loading control. Right panel: densitometric analysis of Aβ40 dot blots. A11 and OC reactivities of mutant aggregates are significantly diminished compared with WT aggregates (unpaired two-tailed t test; *, p < 0.05; ***, p < 0.001; ****, p < 0.0001, means + S.E., n = 4). F, normalized fluorescent spectra of the ANS dye upon its binding to pre-aggregated Aβ40 mutants and their 1:1 mixes with the wild type peptide. A mean value from n = 2 in duplicate is plotted. veh, vehicle; a.u., arbitrary units; Wavel, wave length.
FIGURE 7.
FIGURE 7.
Secondary structure of Aβ mutants and their mixtures with the wild type peptide. A and B, Fourier transform infrared absorbance spectra of Aβ42 variants and their 1:1 mixes (B) with the wild type peptide aggregated for 2 weeks. Spectra are recorded in concentrated peptides (2 mg/ml) in Tris/EDTA buffer, pH 7.4. Nonconcentrated samples of Aβ42 (0.2 mg/ml) were used as a background. Peaks at 1627 cm−1 correspond to the β-sheet content; the peak at 1650 cm−1 is indicative of a mixed structure (α-helix plus random coil), and absorbance between 1657 and 1665 cm−1 (B) includes structures different from β-sheet (disordered or helical). A peak at 1690 cm−1 is assigned to antiparallel β-sheet structures. C and D, FTIR spectra of Aβ40 variants and their 1:1 mixes with the wild type peptide aggregated for 2 weeks. Spectra are recorded in concentrated peptides (2 mg/ml) in Tris/EDTA buffer, pH 7.4. IR absorbance at 1627 and 1690 cm−1 corresponds to the β-sheet content. The β-sheet peak of Aβ40 A2T is shifted to 1617 cm−1 (C).
FIGURE 8.
FIGURE 8.
Impact of the A2T and A2V mutations on the morphology and residual soluble peptide content in aggregated Aβ variants. A, transmission electron micrographs of the fibers obtained after 2 weeks of quiescent incubation of Aβ42 variants and their equimolar mixes with the wild type Aβ42. B, residual soluble peptide content in Aβ42 variants incubated at concentrations above 50 μm for 2 weeks. Significance (unpaired two-tailed t test) is indicated by *, p < 0.05, means + S.E., n = 3. C, transmission electron micrographs of the fibers formed by Aβ40 variants and their equimolar mixes with the wild type Aβ40 after 2 weeks and 6 weeks (D) of quiescent incubation. E, residual soluble peptide content in Aβ40 mutants incubated at 100 μm for 6 weeks. Significance (unpaired two-tailed t test) is indicated by *, p < 0.05, means + S.E., n = 3. F, immune dot blot of Aβ42 fibers. Aβ was incubated in Tris/EDTA buffer, pH 7.4, for 2 weeks, blotted on a nitrocellulose membrane, and probed with conformation-specific antibodies A11 and OC. 4G8 antibody was used as a loading control. 3D6 antibody recognizing the first five amino acids of Aβ was used to probe N-terminal accessibility in mutant aggregates. Immune reactivity of Aβ40 fibers did not change between 2 and 6 weeks of aggregation and was identical to the one of Aβ42. Right panel: densitometric analysis of Aβ fiber dot blots. OC reactivity of the mutant fibers is significantly diminished compared with the WT fibers (unpaired two-tailed t test; **, p < 0.01, means + S.E., n = 3–4). A11 signal intensities of fibers can be considered negligible.
FIGURE 9.
FIGURE 9.
Impact of the A2T and A2V mutations on the critical concentration and the Gibbs free energy of aggregation. A, soluble (solid lines) and insoluble (dashed lines) peptide fractions in Aβ40 variants (black, wild type; green, A2T mutant; red, A2Vmutant) measured by means of the Bio-Rad protein assay after 1, 3, and 6 weeks of incubation. Data are presented as means ± S.E., n = 3. Critical concentration (Cc) values are indicated at corresponding plots and refer to the concentration of soluble peptide above which the soluble content does not change and below which there is <10% of detectable insoluble material. Cc of Aβ40-A2T is significantly different (**, p < 0.01, unpaired two-tailed t test) from Cc of WT Aβ40 and Cc of Aβ40-A2V. B, Gibbs free energy (ΔG) of mutant and WT Aβ40 peptide estimated from the critical concentration values as described under “Experimental Procedures,” significance versus the wild type peptide and A2V mutant is indicated as **, p < 0.01, unpaired two-tailed t test; means + S.D., n = 3. C, changes in the Gibbs free energy (ΔΔG) in the mixtures of Aβ40 with either A2T or A2V mutants estimated according to the equation ΔΔG = ΔG(X) − ΔG(Ala), where X is A2T or A2V mutant present in a given mixture at indicated proportion (0–100%). ΔG values for each mixture are shown in Table 3.

Similar articles

Cited by

References

    1. Karran E., Mercken M., De Strooper B. (2011) The amyloid cascade hypothesis for Alzheimer's disease: an appraisal for the development of therapeutics. Nat. Rev. Drug Discov. 10, 698–712 - PubMed
    1. Golde T. E., Streit W. J., Chakrabarty P. (2013) Alzheimer's disease risk alleles in TREM2 illuminate innate immunity in Alzheimer's disease. Alzheimers Res. Ther. 5, 24. - PMC - PubMed
    1. Hardy J., Bogdanovic N., Winblad B., Portelius E., Andreasen N., Cedazo-Minguez A., Zetterberg H. (2014) Pathways to Alzheimer's disease. J. Int. Med. 275, 296–303 - PubMed
    1. Mullan M., Crawford F., Axelman K., Houlden H., Lilius L., Winblad B., Lannfelt L. (1992) A pathogenic mutation for probable Alzheimer's disease in the APP gene at the N terminus of β-amyloid. Nat. Genet. 1, 345–347 - PubMed
    1. Di Fede G., Catania M., Morbin M., Rossi G., Suardi S., Mazzoleni G., Merlin M., Giovagnoli A. R., Prioni S., Erbetta A., Falcone C., Gobbi M., Colombo L., Bastone A., Beeg M., Manzoni C., Francescucci B., Spagnoli A., Cantù L., Del Favero E., Levy E., Salmona M., Tagliavini F. (2009) A recessive mutation in the APP gene with dominant-negative effect on amyloidogenesis. Science 323, 1473–1477 - PMC - PubMed

Publication types

MeSH terms