. 2014 Nov 5;25(22):3643-53.
doi: 10.1091/mbc.E14-06-1065. Epub 2014 Sep 24.

An agent-based model for mRNA export through the nuclear pore complex

Affiliations

An agent-based model for mRNA export through the nuclear pore complex

Mohammad Azimi et al. Mol Biol Cell. .

Abstract

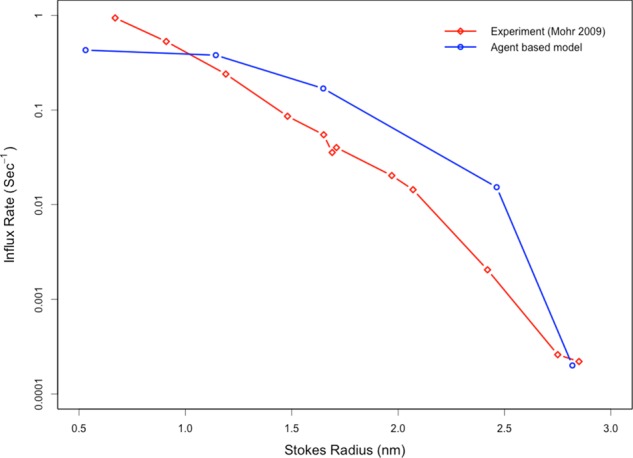
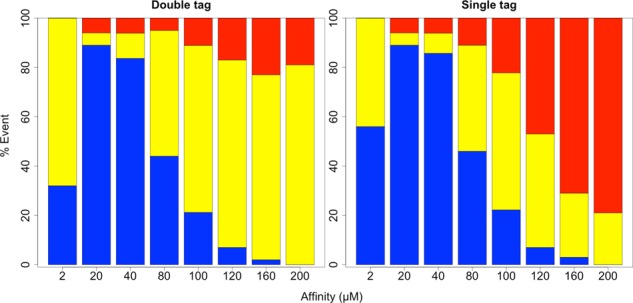
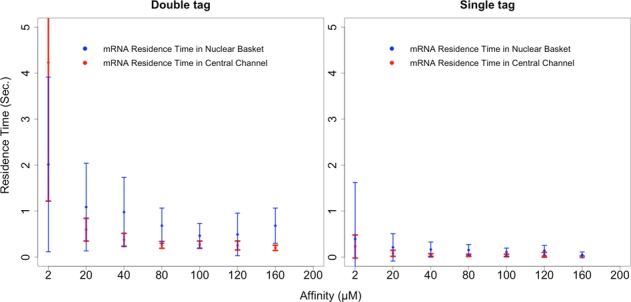
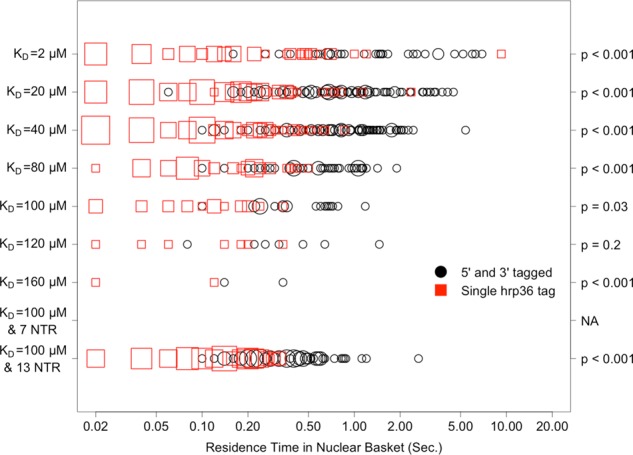
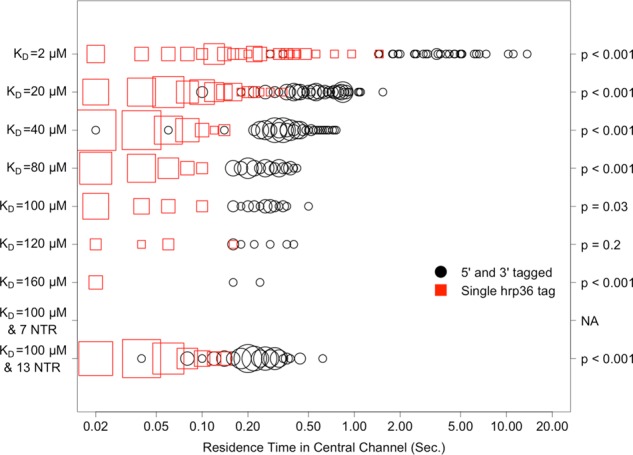
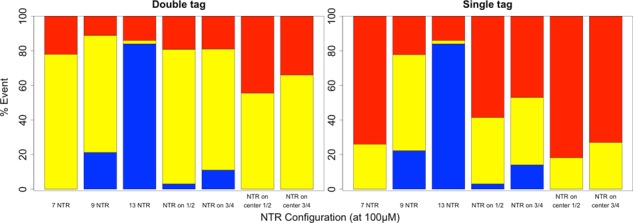
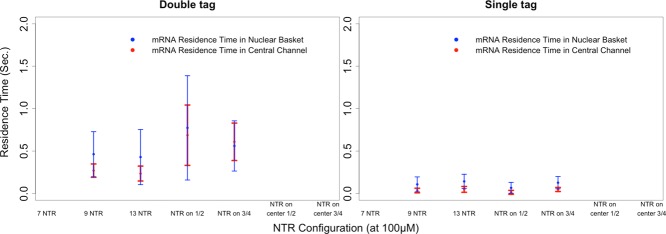
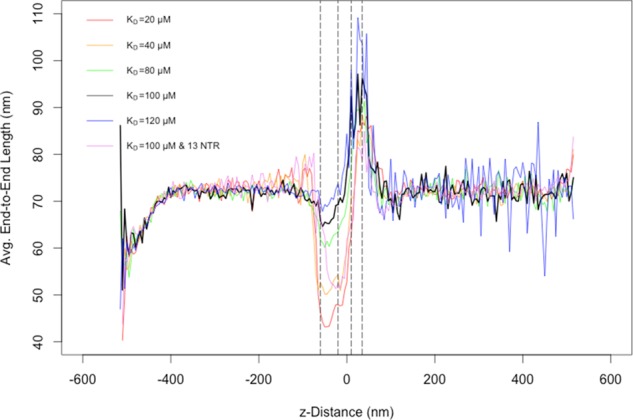
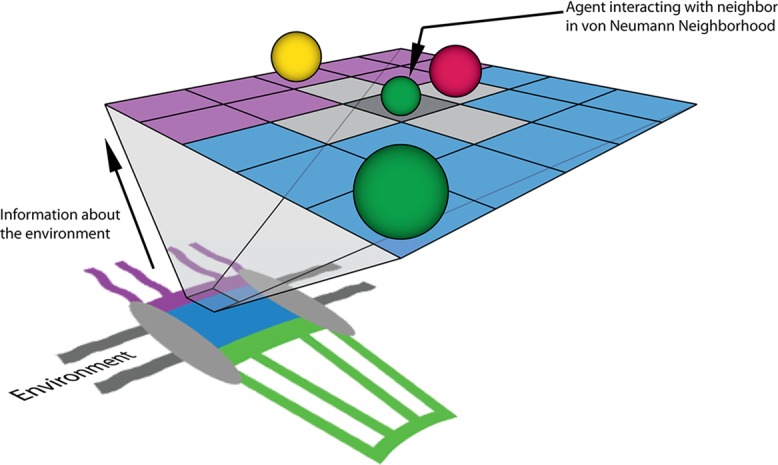
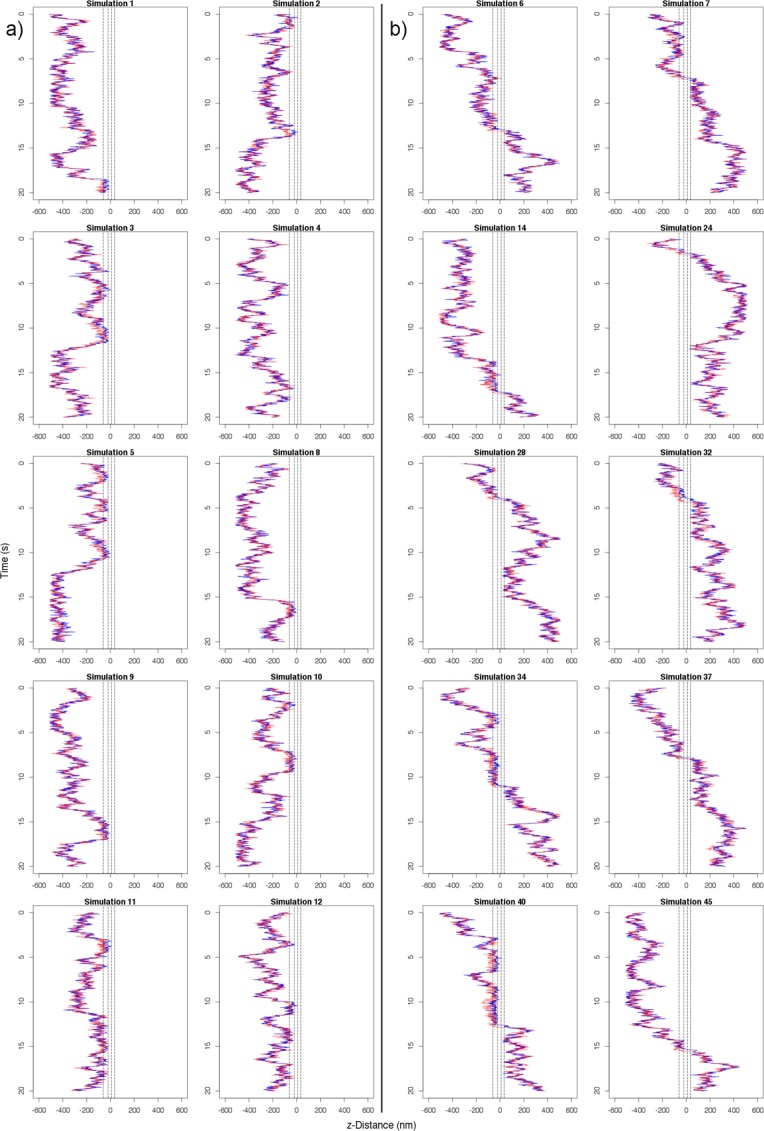
mRNA export from the nucleus is an essential step in the expression of every protein- coding gene in eukaryotes, but many aspects of this process remain poorly understood. The density of export receptors that must bind an mRNA to ensure export, as well as how receptor distribution affects transport dynamics, is not known. It is also unclear whether the rate-limiting step for transport occurs at the nuclear basket, in the central channel, or on the cytoplasmic face of the nuclear pore complex. Using previously published biophysical and biochemical parameters of mRNA export, we implemented a three-dimensional, coarse-grained, agent-based model of mRNA export in the nanosecond regime to gain insight into these issues. On running the model, we observed that mRNA export is sensitive to the number and distribution of transport receptors coating the mRNA and that there is a rate-limiting step in the nuclear basket that is potentially associated with the mRNA reconfiguring itself to thread into the central channel. Of note, our results also suggest that using a single location-monitoring mRNA label may be insufficient to correctly capture the time regime of mRNA threading through the pore and subsequent transport. This has implications for future experimental design to study mRNA transport dynamics.


Figures

FIGURE 1:
FIGURE 1:
The ABM recapitulates the experimentally observed, size-dependent permeabilities of passive cargo3s through the nuclear pore. After a simulated microinjection of noninteracting species in the cytoplasm, the in silico pore is observed to inhibit the influx of larger species while allowing smaller species to diffuse through the pore. This is in agreement with previous experimental observations.
FIGURE 2:
FIGURE 2:
Bar graphs showing the cumulative percentage of successful (blue), partial (yellow), and unsuccessful (red) transport events observed for an mRNA with nine NTRs across different binding affinities between NXF1 and FG Nups. The bar graph on the left corresponds to observations captured by monitoring both the 5′ and 3′ ends, and that on the right corresponds to observations captured by monitoring a single, randomly placed probe.
FIGURE 3:
FIGURE 3:
Two graphs that capture the effect of NXF1/FG Nup affinity on the mRNA's nuclear basket and central channel residence times during successful export events. The graph on the left corresponds to what is observed through probes placed at 5′ and 3′ ends of the mRNA, and the graph on the right corresponds to what is observed through a single probe located randomly along the length of the mRNA. Error bars represent 1 SD.
FIGURE 4:
FIGURE 4:
Distribution, by affinity, of mRNA residence times in the nuclear basket for successful export events as calculated using a single, randomly placed hrp36 probe, compared with using two probes that are placed at both 5′ and 3′ ends of the mRNA. The x-axis is on a log10 scale. Larger points indicate higher frequency of the specified measurement. The p values on the right correspond to a nonparametric (Wilcoxon rank sum) test of significance in the difference between the residence-time distributions obtained with each probe method.
FIGURE 5:
FIGURE 5:
Distribution, by affinity, of mRNA residence times in the central channel for successful export events as calculated using a single, randomly placed hrp36 probe, compared with using two probes that are placed at both 5′ and 3′ ends of the mRNA. The x-axis is on a log10 scale. Larger points indicate higher frequency of the specified measurement. The p values on the right correspond to a nonparametric (Wilcoxon rank sum) test of significance in the difference between the residence-time distributions obtained with each probe method.
FIGURE 6:
FIGURE 6:
Bar graphs showing the relative percentage of successful (blue), partial (yellow), and unsuccessful (red) transport events observed for different distributions of NTRs on an export-competent mRNA. Note that all configurations used the baseline NXF1 to FG Nup affinity of 100 μM. “NTR on ½” and “NTR on ¾” represent configurations where transport receptors were placed on the terminal one-half and three-fourths length of the mRNA, respectively, with the same spacing as was used in the baseline configuration for a total of five transport receptors in the one-half configuration and seven transport receptors in the three-fourths configuration. “NTR on center ½” and “NTR on center ¾” represent configurations where transport receptors were placed in the center one-half and three-fourths length of the mRNA, respectively, with the same spacing as used in the baseline configuration for a total of five transport receptors in the one-half configuration and seven transport receptors in the three-fourths configuration (i.e., these configurations lacked transport receptors near the 5′ and 3′ termini). The graph on the left captures observations recorded with a double tag (5′ and 3′ end) system, and the graph on the right captures those recorded with a single tag.
FIGURE 7:
FIGURE 7:
Graphs showing the effect of varying NTR distribution along the length of an mRNA on nuclear basket and central channel residence times for successful export events (error bars represent 1 SD). Note that all configurations used the baseline NXF1 to FG Nup affinity of 100 μM. “NTR on ½” and “NTR on ¾” represent configurations where transport receptors were placed on the terminal one-half and three-fourths length of the mRNA, respectively, with the same spacing as used in the baseline configuration for a total of five transport receptors in the one-half configuration and seven transport receptors in the three-fourths configuration. The graph on the left captures observations recorded with a double tag (5′ and 3′ end) system, and the graph on the right captures those recorded with a single tag.
FIGURE 8:
FIGURE 8:
A combined plot of end-to-end length averaged over 100 simulations for multiple affinity and nuclear transport receptor configurations in the ABM. Note that, where unspecified, the number of transport receptors was set to the baseline value of nine, distributed uniformly along the length of the mRNA. The x-axis represents the position along the axis perpendicular to the nuclear envelope (z-distance), with x = 0 set at the center of the central channel of the NPC. Left to right, the dashed lines represent the distal edge of the nuclear basket, the nuclear edge of the central channel, the cytoplasmic edge of the central channel, and the distal edge of the cytoplasmic filaments, respectively. Note that low sampling of successful transport events accounts for the increased observed variability in average end-to-end lengths of low Nup-NXF1– affinity transports on the cytoplasmic side.
FIGURE 9:
FIGURE 9:
A cartoon representation of the NPC's environment (not to scale) projected onto a two-dimensional, on-lattice ABM with agents (spheres) representing protein factors. These agents move within the system and interact with other agents within their von Neumann neighborhood. One such neighborhood of cells is highlighted in gray for the smaller green agent that is pointed to by an arrow. The actual model consists of a 3D representation of the NPC structure and physiologically relevant concentrations of biochemical factors and channel dimensions. In our model, the purple region representing the cytoplasmic periphery is treated as a compartmentalized volume containing both noninteracting Nup and transport receptor–interacting FG Nup agents. The central channel (blue) and nuclear basket (green) regions are analogously represented by compartmentalized volumes and functionalized with Nup and FG Nup agents. Gray regions of the NPC diagram represent the scaffold and nuclear envelope regions of the model that are impermeable to diffusing species.
FIGURE 10:
FIGURE 10:
Kymographs of 20 replicate simulations of mRNA export using the default configuration of transport receptor/FG Nup affinity of 100 μM and nine transport receptors along the length of the mRNA. The blue lines represent the position of the 5′ end, and the red lines represent the position of the 3′ end. The NPC central channel is centered at z = 0 nm in each plot. Plots are distributed to show (A) 10 failed exports and (B) 10 successful exports.

References

    1. Adam SA. The nuclear pore complex. Genome Biol. 2001;2:REVIEWS0007. - PMC - PubMed
    1. Azimi M, Jamali Y, Mofrad MR. Accounting for diffusion in agent based models of reaction-diffusion systems with application to cytoskeletal diffusion. PLoS One. 2011;6:e25306. - PMC - PubMed
    1. Azimi M, Mofrad MR. Higher nucleoporin-Importinbeta affinity at the nuclear basket increases nucleocytoplasmic import. PLoS One. 2013;8:e81741. - PMC - PubMed
    1. Bonchev D, Thomas S, Apte A, Kier LB. Cellular automata modelling of biomolecular networks dynamics. SAR QSAR Environ Res. 2010;21:77–102. - PubMed
    1. Cheng H, Dufu K, Lee CS, Hsu JL, Dias A, Reed R. Human mRNA export machinery recruited to the 5' end of mRNA. Cell. 2006;127:1389–1400. - PubMed

Substances