. 2014 Sep 24;34(39):13110-26.
doi: 10.1523/JNEUROSCI.1014-14.2014.

Postnatal expression of neurotrophic factors accessible to spiral ganglion neurons in the auditory system of adult hearing and deafened rats

Affiliations

Postnatal expression of neurotrophic factors accessible to spiral ganglion neurons in the auditory system of adult hearing and deafened rats

Erin M Bailey et al. J Neurosci. .

Abstract

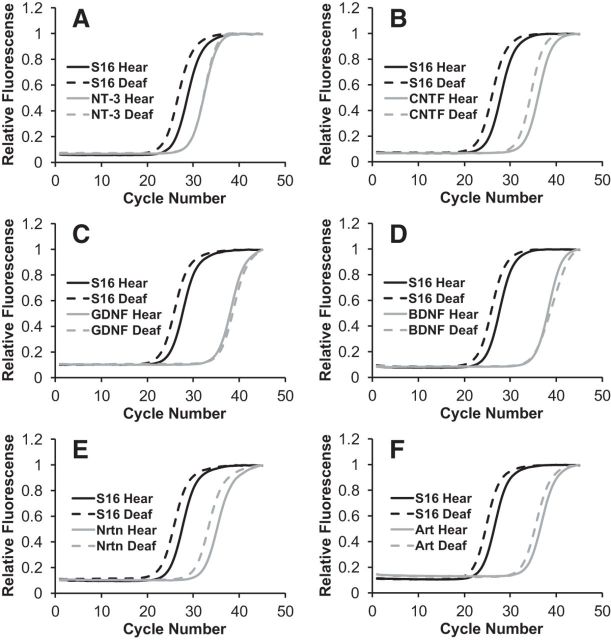
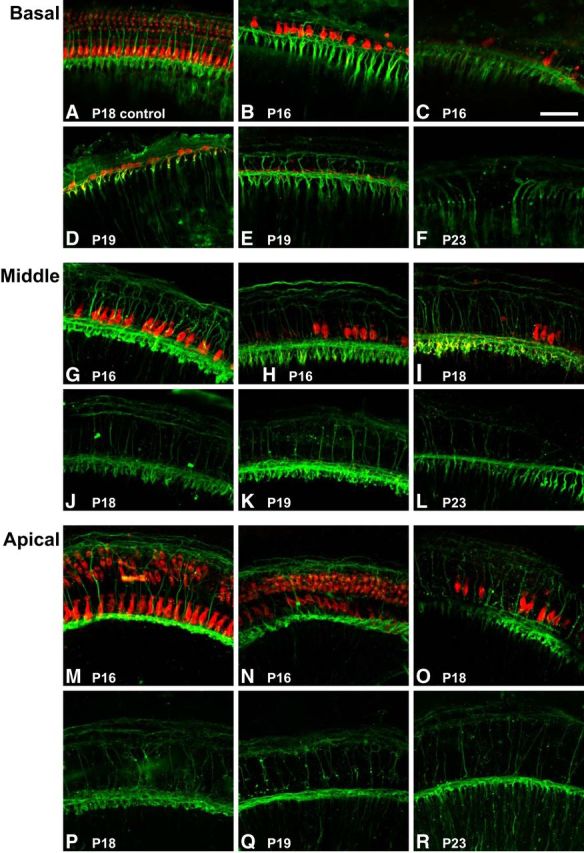
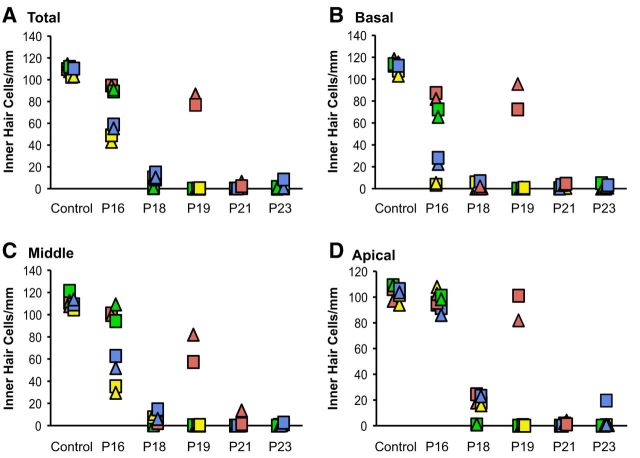
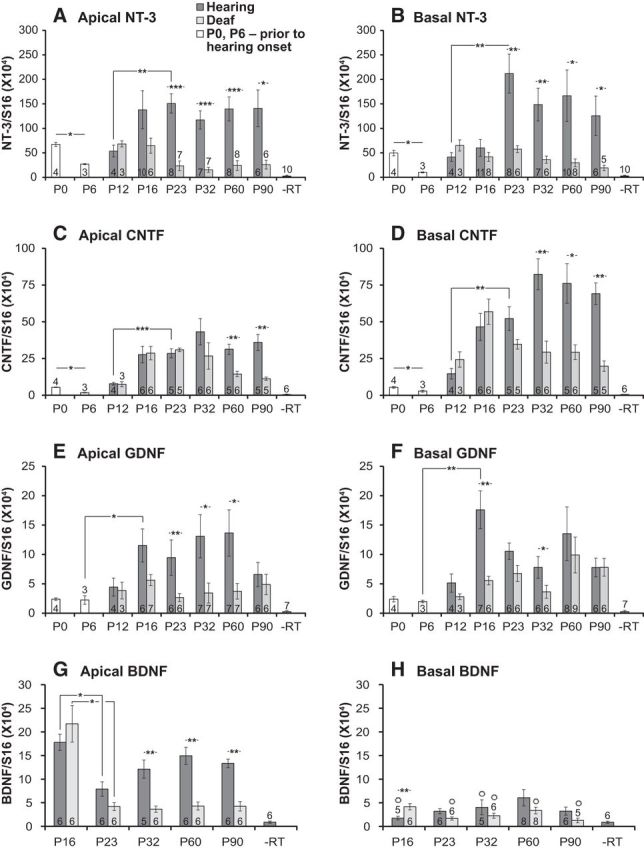
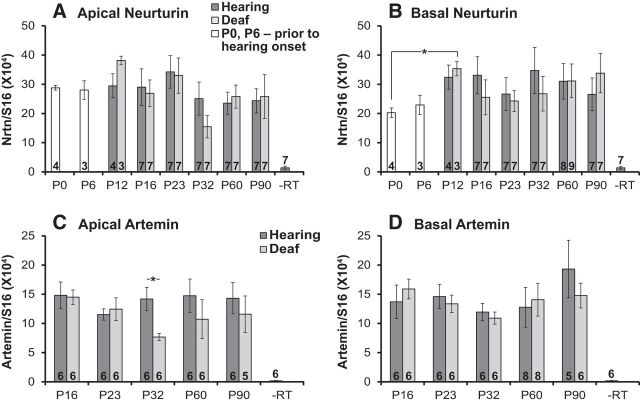
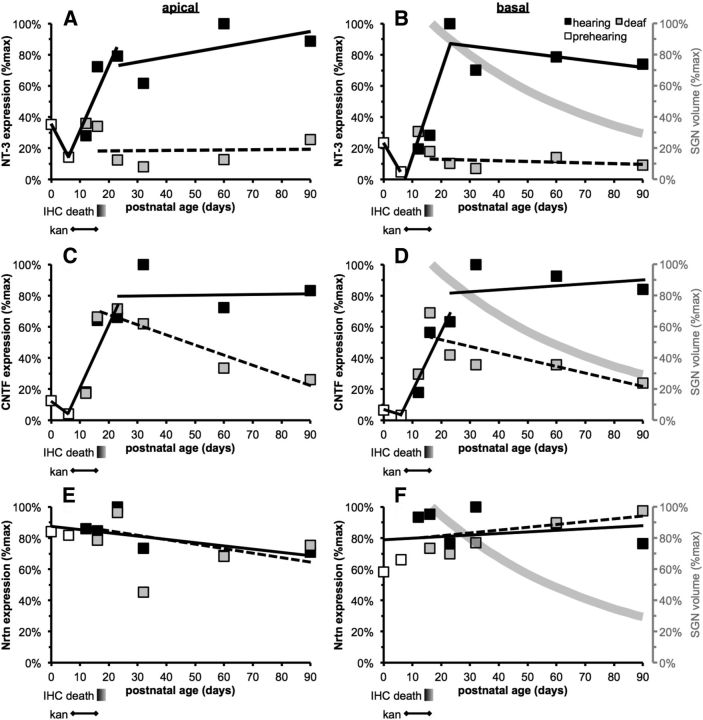
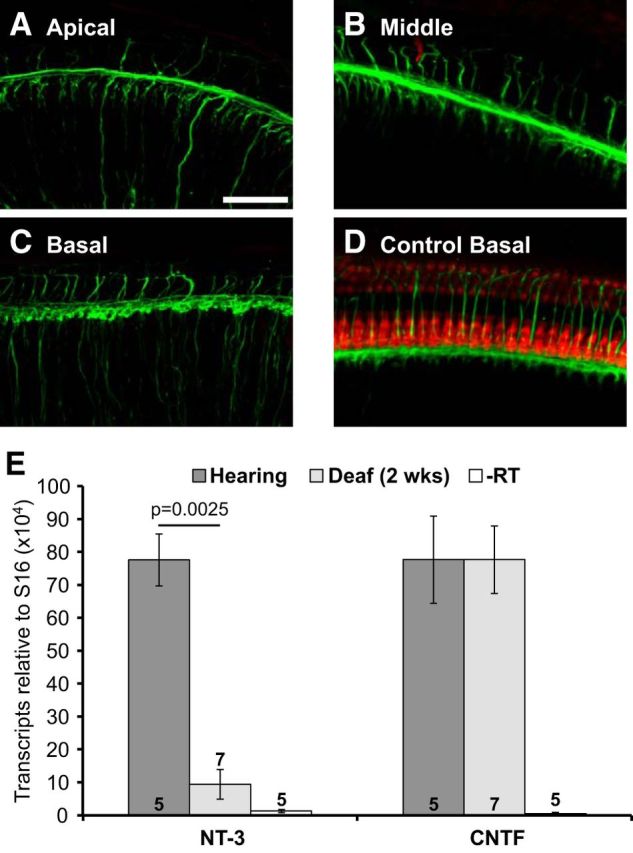
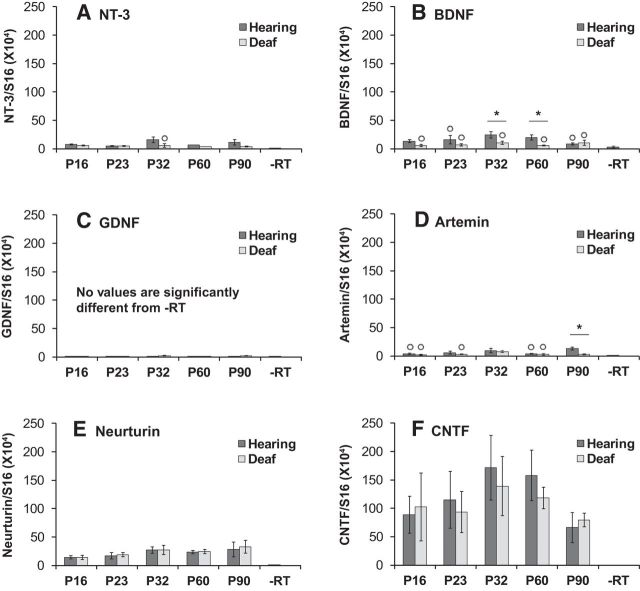
Spiral ganglion neurons (SGNs) receive input from cochlear hair cells and project from the cochlea to the cochlear nucleus. After destruction of hair cells with aminoglycoside antibiotics or noise, SGNs gradually die. It has been assumed that SGN death is attributable to loss of neurotrophic factors (NTFs) derived from hair cells or supporting cells in the organ of Corti (OC). We used quantitative PCR (qPCR) to assay NTF expression-neurotrophin-3 (NT-3), BDNF, GDNF, neurturin, artemin, and CNTF-in the OC and cochlear nucleus at various ages from postnatal day 0 (P0) to P90 in control hearing and neonatally deafened rats. NT-3, neurturin, and CNTF were most abundant in the postnatal hearing OC; CNTF and neurturin most abundant in the cochlear nucleus. In the OC, NT-3 and CNTF showed a postnatal increase in expression approximately concomitant with hearing onset. In rats deafened by daily kanamycin injections (from P8 to P16), surviving inner hair cells were evident at P16 but absent by P19, with most postsynaptic boutons lost before P16. NT-3 and CNTF, which normally increase postnatally, had significantly reduced expression in the OC of deafened rats, although CNTF was expressed throughout the time that SGNs were dying. In contrast, neurturin expression was constant, unaffected by deafening or by age. CNTF and neurturin expression in the cochlear nucleus was unaffected by deafening or age. Thus, NTFs other than NT-3 are available to SGNs even as they are dying after deafening, apparently conflicting with the hypothesis that SGN death is attributable to lack of NTFs.

Keywords: cochlea; deafness; neuronal survival; neurotrophic factor; organ of Corti; spiral ganglion.


Figures

Figure 1.
Figure 1.
Examples of real-time qPCR amplification curves of all six NTF transcripts assayed, paired with parallel measurements of the reference gene S16 transcripts, in OCs from P23 control hearing (Hear) and kanamycin-treated deafened (Deaf) P23 rats. A, NT-3; B, CNTF; C, GDNF; D, BDNF; E, neurturin; F, artemin.
Figure 2.
Figure 2.
Representative examples of OCs from control hearing and deafened rats at P16, P18, P19, P21, and P23 showing hair cells and their innervation. As described in Materials and Methods, portions of the OC, with spiral ganglion attached, were removed and immunolabeled with combined rabbit anti-myosin VI, anti-myosin VIIa, and anti-calretinin (red) antibodies, and SGNs were immunolabeled with chicken anti-NF200 (green) antibody. Shown are z-projections of confocal microscope z-stacks of entire whole mounts. Scale bar, 50 μm. A, P18 hearing control whole-mount preparation showing the one IHC row and three outer hair cell rows and the characteristic dense innervation of the hair cells. B–F, Whole mounts of the basal cochlear region of kanamycin-treated rats at the indicated time points showing examples of P16 cochleae from different rats in which basal hair cells remain present (B) or are mostly lost (C) and P19 cochleae in which basal hair cells remain (D) or are lost (E). By P23, no hair cells are detectable in the base (F). G–L, Preparations of the middle cochlear region of kanamycin-treated rats at the indicated time points showing examples of P16 cochleae from different rats in which most (G) or only some (H) hair cells remain present and P18/P19 cochleae in which some hair cells remain (I) or in which no middle region hair cells remain (J, K). By P23, no hair cells are detectable in the middle region (L). M–R, Preparations taken from the apical region of kanamycin-treated rats at the indicated time points showing examples of P16 cochleae from different rats in which all (M) or most (N) apical hair cells remain and P18/P19 cochleae in which some hair cells remain (O) or in which no apical hair cells remain (P, Q). By P23, no hair cells are detectable in the cochlear apex (R).
Figure 3.
Figure 3.
Quantification of inner hair cell loss after kanamycin treatment. Four kanamycin-treated rats were killed at each time point (P16, P18, P19, P21, and P23) to provide eight cochleae. Control undeafened rats were killed at P16. At each time point, each of the four rats is represented by a different color, and the two cochleae from the same rat are distinguished by different shapes (squares or triangles). Some symbols are deliberately horizontally offset slightly so that overlapping symbols may be easily viewed. Values are graphed as hair cells per millimeter. A, Quantification of total hair cell loss after kanamycin treatment. B–D, Quantification of hair cell loss in the basal, middle, and apical regions of the cochlea, respectively. IHCs are lost in all turns by P21.
Figure 4.
Figure 4.
Representative examples of whole-mount preparations taken from hearing and deafened rats and quantification of synaptic structures. As described in Material and Methods, rats were killed at P12 or P16, and their OCs, along with the attached spiral ganglion, were removed. Hair cells were immunolabeled with combined anti-myosin VI and myosin VIIa antibodies (blue), SGNs were immunolabeled with chicken NF200 antibody (red), and synaptic structures were immunolabeled with either CTBP2 (ribbons) or PSD-95 (PSDs) antibodies (green). All images are presented as a projection image of a confocal series. A–C, Preparations taken from the apical, middle, and basal regions of P16 hearing control cochleae. Presynaptic ribbons are labeled with CTBP2. Scale bar, 20 μm. D–F, Preparations taken from the apical, middle, and basal regions of kanamycin-treated P16 cochleae. Presynaptic ribbons are labeled with CTBP2. G–I, Preparations taken from the apical, middle, and basal regions of P16 hearing control cochleae. PSDs are labeled with PSD-95. J–L, Preparations taken from the apical, middle, and basal regions of P16 kanamycin-treated cochleae. PSDs are labeled with PSD-95. M, Quantification of synapse loss after kanamycin treatment. Values are represented as synaptic puncta per hair cell. The number in each column is the number of rats used for the counts. Error bars show SEM. Lines show significant differences (Kruskal–Wallis test, Dunn's post hoc for multiple comparisons, *p < 0.05, **p < 0.01, ***p < 0.001). Differences between P12 hearing control and P12 deafened rats are not significant. All differences between P16 hearing control and P16 deafened rats are statistically significant. Differences between P12 and P16 deafened rats are significant at the indicated levels for all turns. Differences between ribbons and PSDs after deafening at P16 are significant at the indicated level in the middle and basal regions but not in the apical region.
Figure 5.
Figure 5.
Mean relative myosin VIIa expression, normalized to S16, in the apical (A) and basal (B) halves of the OC assayed by qPCR. Error bars show SEM. Myosin VIIa declines significantly by P16 and continues to decline to levels not significantly different from −RT (indicated by °) at most time points. Significance was determined by pairwise comparisons by a Mann-Whitney U test. Significant differences are indicated by *p < 0.05. n = 3 for all columns.
Figure 6.
Figure 6.
Mean NTF transcript levels, relative to S16, in the apical (A, C, E, G) and basal (B, D, F, H) halves of the OC, assayed by qPCR. For all of the ages indicated (postnatal days), dark gray columns are data from control (Hearing) rats, light gray columns are data from kanamycin-treated (Deaf) rats, and white columns are data from P0 and P6 rats before initiation of kanamycin treatment and before hearing onset. A, B, NT-3; C, D, CNTF; E, F, GDNF; G, H, BDNF. Error bars show SEM. Significance was determined for indicated pairwise comparisons by a Mann–Whitney U test and for multiple comparisons by a Kruskal–Wallis/Dunn's post hoc test. Significant differences are indicated by *p < 0.05, **p < 0.01, and ***p < 0.001 for all graphs. Note the difference in y-axis scale for these factors. Transcript levels are significantly reduced after deafening at multiple later time points for all of these factors. Values not significantly different from −RT are indicated by °.
Figure 7.
Figure 7.
Mean NTF transcript levels, relative to S16, in the apical (A, C) and basal (B, D) halves of the OC, assayed by qPCR. For all of the ages indicated (postnatal days), dark gray columns are data from control (Hearing) rats, light gray columns are data from kanamycin-treated (Deaf) rats, and white columns are data from P0 and P6 rats before initiation of kanamycin treatment and before hearing onset. A, B, Neurturin; C, D, artemin. Error bars show SEM. Significance was tested for all pairwise comparisons of hearing versus deaf at each age (Mann–Whitney U test) and for multiple comparisons across time points (Kruskal–Wallis/Dunn's post hoc test). Significant differences are indicated by *p < 0.05.
Figure 8.
Figure 8.
Temporal expression pattern for representative NTFs. Data from Figures 6 (A–D here) and 7 (E, F here) are replotted to better show expression of NT-3 (A, B), CNTF (C, D), and neurturin (Nrtn; E, F) in hearing (filled squares) and deafened (open squares) rats, as a function of postnatal age, in the apical (A, C, E) and basal (B, D, F) halves of the OC. The horizontal axis shows postnatal age in days, to scale. Below this axis are shown the approximate period over which IHCs die in the apex and base (from Figs. 2, 3), depicted as a shaded bar, and the period over which kanamycin (kan) is administered. For illustrative purposes, expression trends over time are indicated on the graphs by heavy black lines, solid for hearing rats, and dashed for deaf rats. For control hearing rats, trends in NT-3 and CNTF expression are shown separately for three time periods: (1) immediately postnatally, expression declines, illustrated by the line from P0 to P6; (2) during hearing onset, expression increases, illustrated by a best-fit line computed by linear regression from P6 to P23; and (3) after hearing onset, expression is stable, illustrated by a best-fit line computed by linear regression from P23 to P90. For deafened rats, trends are illustrated differently for NT-3 and CNTF expression. For NT-3, the trend is illustrated by a best-fit line computed by linear regression from P12 to P90 and, for CNTF, by a line connecting P12 to P16 and a best-fit line computed by linear regression from P23 to P90. The trends in neurturin expression for hearing and deafened rats are separately illustrated by best-fit lines computed by linear regression from P23 to P90. The gray curve in B, D, and F approximates the loss of SGNs in the cochlear base over the time period of these experiments based on data published by Alam et al. (2007).
Figure 9.
Figure 9.
NT-3 and CNTF expression in rats deafened as adults. A–D, Representative examples of OCs from adult deafened and control hearing rats 2 weeks after gentamicin/furosemide injections showing hair cells and their innervation. As described in Materials and Methods, portions of the OCs, with spiral ganglion attached, were removed and immunolabeled with combined rabbit anti-myosin VI and anti-myosin VIIa (red) antibodies, and SGNs were immunolabeled with mouse anti-neuronal mix (green). Shown are z-projections of confocal microscope z-stacks of entire whole mounts. Scale bar, 50 μm. A–C, Deafened rat cochlear apical region (A), middle region (B), and basal region (C). D, Basal region from control undeafened rat. E, Mean NT-3 and CNTF expression normalized to S16 in the OC, assayed by qPCR, 2 weeks after gentamicin/furosemide injections and in control hearing rats. Error bar shows SEM. The number in each column is the number of biological replicates. As shown, NT-3 expression is significantly lower after deafening relative to the hearing control (Mann–Whitney U test).
Figure 10.
Figure 10.
Expression of NTFs in the cochlear nucleus. A, NT-3; B, BDNF; C, GDNF; D, artemin; E, neurturin; F, CNTF. Expression of NT-3, BDNF, GDNF, and artemin is very low. Error bars show SEM. Values not significantly different from the −RT control are indicated by °. Significant differences between hearing and deaf rats at particular time points are indicated by *p < 0.05 (Mann–Whitney U test). n = 4 for NT-3 and BDNF; n = 3 for GDNF, artemin, neurturin, and CNTF.

References

    1. Adamson CL, Reid MA, Davis RL. Opposite actions of brain-derived neurotrophic factor and neurotrophin-3 on firing features and ion channel composition of murine spiral ganglion neurons. J Neurosci. 2002;22:1385–1396. - PMC - PubMed
    1. Airaksinen MS, Saarma M. The GDNF family: signalling, biological functions and therapeutic value. Nature Rev Neurosci. 2002;3:383–394. doi: 10.1038/nrn812. - DOI - PubMed
    1. Alam SA, Robinson BK, Huang J, Green SH. Prosurvival and proapoptotic intracellular signaling in rat spiral ganglion neurons in vivo after the loss of hair cells. J Comp Neurol. 2007;503:832–852. doi: 10.1002/cne.21430. - DOI - PubMed
    1. Almeida RD, Manadas BJ, Melo CV, Gomes JR, Mendes CS, Grãos MM, Carvalho RF, Carvalho AP, Duarte CB. Neuroprotection by BDNF against glutamate-induced apoptotic cell death is mediated by ERK and PI3-kinase pathways. Cell Death Differ. 2005;12:1329–1343. doi: 10.1038/sj.cdd.4401662. - DOI - PubMed
    1. Bao J, Lin H, Ouyang Y, Lei D, Osman A, Kim TW, Mei L, Dai P, Ohlemiller KK, Ambron RT. Activity-dependent transcription regulation of PSD-95 by neuregulin-1 and Eos. Nat Neurosci. 2004;7:1250–1258. doi: 10.1038/nn1342. - DOI - PubMed

Publication types

MeSH terms