. 2014 Sep 24;34(39):13139-50.
doi: 10.1523/JNEUROSCI.2591-14.2014.

Astrocytic Gq-GPCR-linked IP3R-dependent Ca2+ signaling does not mediate neurovascular coupling in mouse visual cortex in vivo

Affiliations

Astrocytic Gq-GPCR-linked IP3R-dependent Ca2+ signaling does not mediate neurovascular coupling in mouse visual cortex in vivo

Daniel E Bonder et al. J Neurosci. .

Abstract

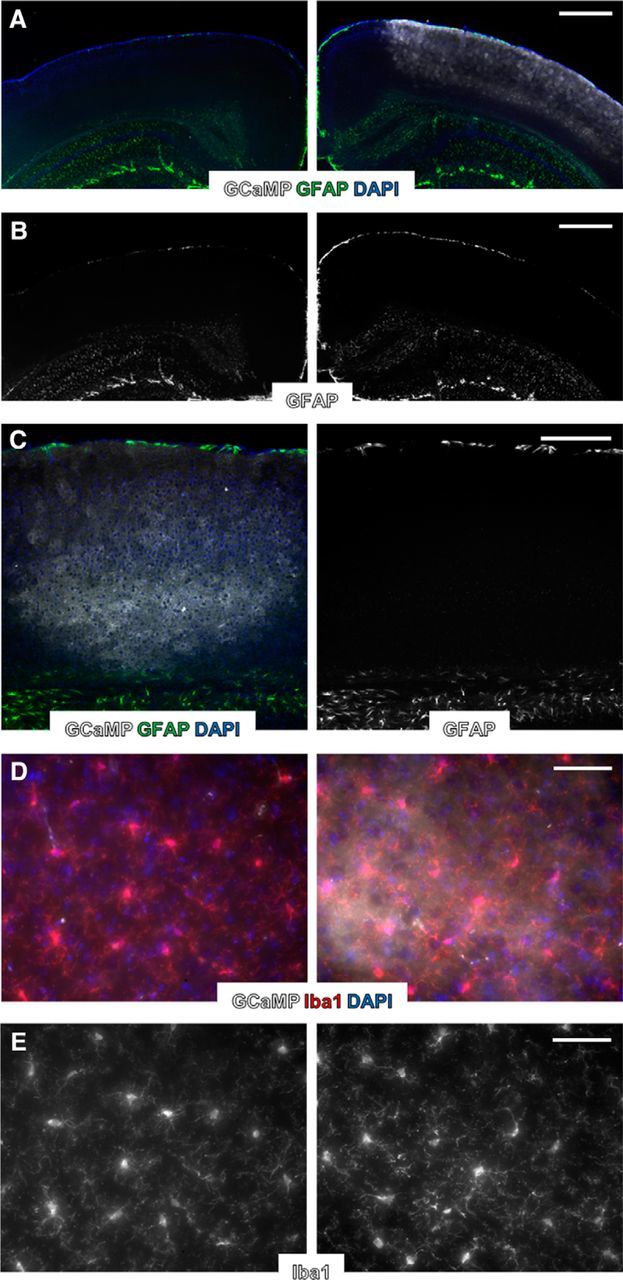
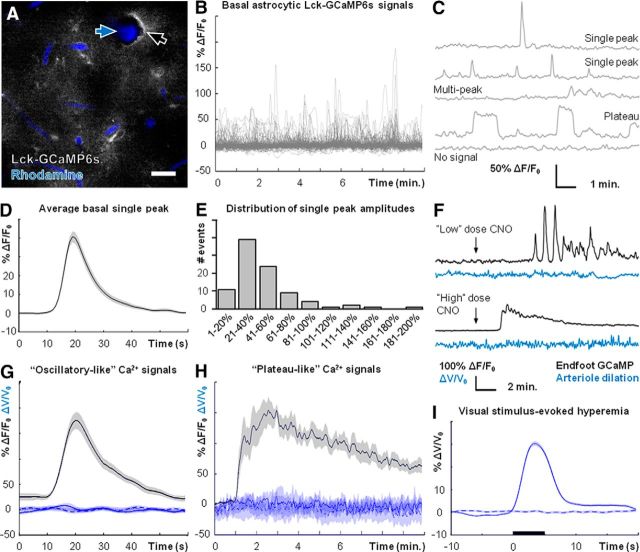
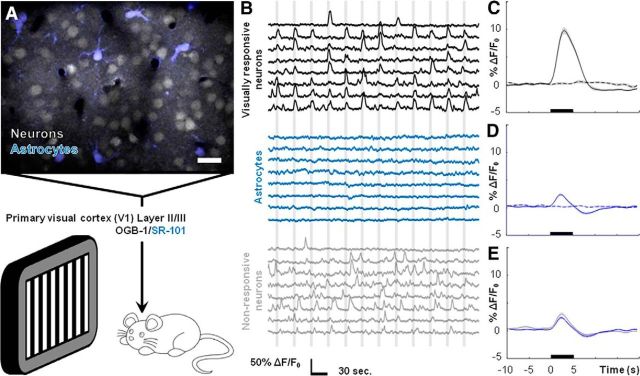
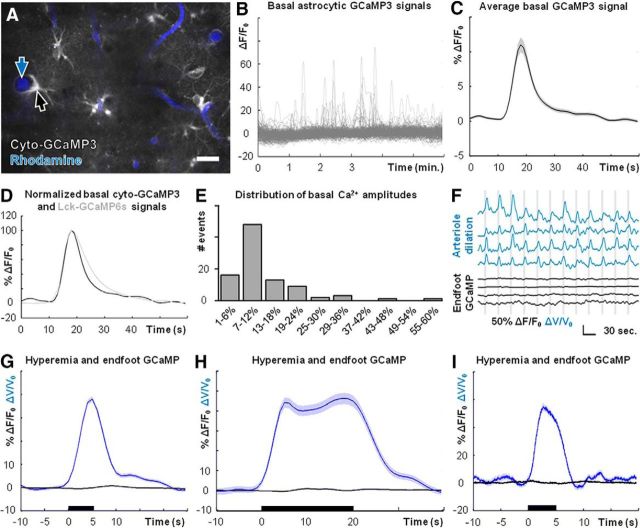
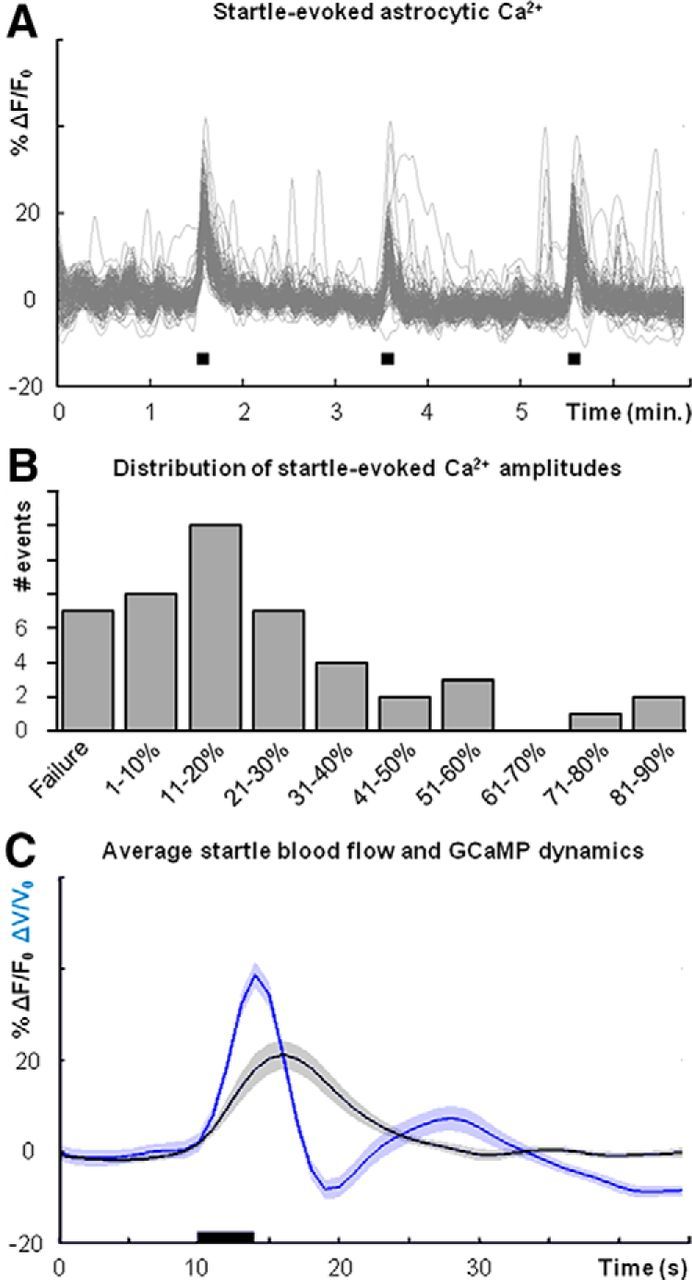
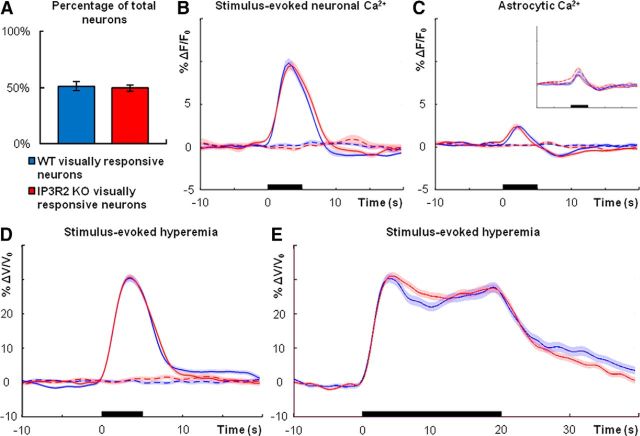
Local blood flow is modulated in response to changing patterns of neuronal activity (Roy and Sherrington, 1890), a process termed neurovascular coupling. It has been proposed that the central cellular pathway driving this process is astrocytic Gq-GPCR-linked IP3R-dependent Ca(2+) signaling, though in vivo tests of this hypothesis are largely lacking. We examined the impact of astrocytic Gq-GPCR and IP3R-dependent Ca(2+) signaling on cortical blood flow in awake, lightly sedated, responsive mice using multiphoton laser-scanning microscopy and novel genetic tools that enable the selective manipulation of astrocytic signaling pathways in vivo. Selective stimulation of astrocytic Gq-GPCR cascades and downstream Ca(2+) signaling with the hM3Dq DREADD (designer receptors exclusively activated by designer drugs) designer receptor system was insufficient to modulate basal cortical blood flow. We found no evidence of observable astrocyte endfeet Ca(2+) elevations following physiological visual stimulation despite robust dilations of adjacent arterioles using cyto-GCaMP3 and Lck-GCaMP6s, the most sensitive Ca(2+) indicator available. Astrocytic Ca(2+) elevations could be evoked when inducing the startle response with unexpected air puffs. However, startle-induced astrocytic Ca(2+) signals did not precede corresponding startle-induced hemodynamic changes. Further, neurovascular coupling was intact in lightly sedated, responsive mice genetically lacking astrocytic IP3R-dependent Ca(2+) signaling (IP3R2 KO). These data demonstrate that astrocytic Gq-GPCR-linked IP3R-dependent Ca(2+) signaling does not mediate neurovascular coupling in visual cortex of awake, lightly sedated, responsive mice.

Keywords: DREADD; IP3; astrocyte; blood flow; calcium; in vivo.


Figures

Figure 1.
Figure 1.
Expression of transgenes using AAV vectors does not lead to lasting astrocytic reactivity or microglial activation. A, Fluorescence immunolabeling of nuclei (DAPI, blue), astrocytic GFAP (green), and Lck-GCaMP6s (gray) in visual cortex. Right, AAV-injected cortex. Left, Noninjected cortex from same animal. B, Same images as in A but with GFAP only, more clearly displaying similarly sparse labeling in AAV-injected and noninjected cortices. C, Fluorescence immunolabeling of nuclei (DAPI, blue), astrocytic GFAP (green), and Lck-GCaMP6s (gray) in visual cortex near the center of AAV injection and needle penetration. Right, GFAP only. D, Fluorescence immunolabeling of nuclei (DAPI, blue), microglia (Iba1, red), and Lck-GCaMP6s (gray) in visual cortex. Right, AAV-injected cortex. Left, Noninjected cortex from same animal. E, Same images as in D but with Iba1 only, more clearly displaying similar gross microglial morphology in AAV-injected and noninjected cortices. Scale bars: A, B, 500 μm; C, 250 μm; D, E, 50 μm.
Figure 2.
Figure 2.
Basal cortical blood flow is unaffected by stimulation of astrocytic hM3Dq. A, Field image of astrocytic Lck-GCaMP6s (gray) and intravascular rhodamine (blue), showing astrocyte endfeet (black arrow) and a cortical arteriole (blue arrow). B, Nonbiased sampling of Lck-GCaMP6s using a grid analysis (see Materials and Methods) reveals robust basal astrocytic Ca2+ dynamics. C, Representative examples of diverse basal astrocytic Ca2+ signals detected by Lck-GCaMP6s (n = 3 mice, 132 ROIs). D, Average basal astrocytic single-peak Ca2+ elevation detected by Lck-GCaMP6s (n = 3 mice, 92 Ca2+ signals). E, Histogram of basal astrocytic single-peak Ca2+ elevations detected by Lck-GCaMP6s (n = 3 mice, 92 Ca2+ signals). F, Representative traces of different types of astrocytic Ca2+ responses (black traces) that can be evoked by adjusting CNO dose, and basal blood flow during same CNO trials (blue traces). G, Average blood flow (solid blue line; n = 6 mice, 37 trials) during CNO-induced astrocytic oscillatory-like Ca2+ signals (black line; n = 6 mice, 37 Ca2+ elevations). Dashed and dotted blue lines are averages from vehicle-injection and baseline (no injection) trials respectively. H, Same information as D but during CNO-induced astrocytic plateau-like Ca2+ signals (n = 7 mice, 7 trials). Dashed and dotted blue lines are averages from vehicle-injection and baseline (no injection) trials respectively. I, Average cortical blood flow increase (n = 7 mice, 379 stimulus trials) following visual stimulation (black bar). Dashed trace is during no-stimulus trials (n = 7 mice, 384 trials). Scale bar: A, 20 μm. Shaded regions in D, G–I represent SEM.
Figure 3.
Figure 3.
Mouse visual cortical astrocytes do not display observable somatic Ca2+ elevations following visual stimulation. A, Field image showing Layer II/III neurons and astrocytes loaded with OGB-1 (gray)/SR-101 (blue) dye. Drifting grating visual stimuli were presented to lightly sedated, responsive mice. B, Representative traces of fluorescence signals from ROIs drawn around the cell bodies of visually responsive neurons (black traces), astrocytes (blue traces), and visually nonresponsive neurons (gray traces) during stimulus presentations (vertical gray bars). C, Average neuronal Ca2+ increase to visual stimuli (n = 4 mice, 87 cells, 3132 stimulus trials). D, Average astrocytic Ca2+ dynamics during visual stimuli (n = 4 mice, 35 cells, 1152 stimulus trials). E, Average astrocytic (blue) and nonresponsive neuronal (gray, n = 4 mice, 82 cells, 3132 stimulus trials) Ca2+ dynamics during visual stimuli, indicating contamination from neuropil signal. Scale bar: A, 20 μm. For C–E, stimuli were presented during time frame indicated by black bars, dashed lines indicate no-stimulus trials, and shaded regions represent SEM.
Figure 4.
Figure 4.
Cortical arterioles dilate in the absence of observable Ca2+ elevations in perivascular astrocyte endfeet. A, Field image of cyto-GCaMP3 (gray) and intravascular rhodamine (blue), showing astrocyte endfeet (black arrow) and cortical arterioles (blue arrow). B, Nonbiased sampling of cyto-GCaMP3 using a grid analysis (see Materials and Methods) reveals robust basal astrocytic Ca2+ dynamics. C, Average basal astrocytic single-peak Ca2+ elevation detected by cyto-GCaMP3 (n = 3 mice, 94 Ca2+ signals). D, Average basal astrocytic single-peak Ca2+ elevations detected by cyto-GCaMP3 (black trace) and Lck-GCaMP6s (gray trace; Fig. 2D), normalized to respective maxima. E, Histogram of basal single-peak amplitudes detected by cyto-GCaMP3 (n = 3 mice, 94 Ca2+ signals). F, Representative simultaneous measures of blood flow changes based on arteriole dilations (blue traces) and astrocyte endfoot Ca2+ dynamics (black traces) during visual stimulation (vertical gray bars). The top three traces for each are from experiments using cyto-GCaMP3. The bottom trace is from an experiment using Lck-GCaMP6s. G, Average blood flow (blue trace, n = 9 mice, 464 stimulus trials) and astrocyte endfoot Ca2+ (black trace, n = 9 mice, 464 stimulus trials, pooled from cyto-GCaMP3 and Lck-GCaMP6s experiments) dynamics following 5-s-long visual stimuli (black bar). H, Average blood flow (blue trace; n = 5 mice, 187 stimulus trials) and astrocyte endfoot Ca2+ (black trace; n = 5 mice, 187 stimulus trials, pooled from cyto-GCaMP3 and Lck-GCaMP6s experiments) dynamics following 20-s-long visual stimuli (black bar). I, Average blood flow (blue trace) and astrocyte endfoot Ca2+ (black trace, Lck-GCaMP6s) dynamics assessed by high-speed multiphoton line scanning (n = 3 mice, 183 stimulus trials) following 5-s-long visual stimuli (black bar). Scale bar: A, 20 μm. Shaded regions in C, G–I represent SEM.
Figure 5.
Figure 5.
Air puff startle elicits widespread astrocytic Ca2+ elevation and cortical blood flow changes. A, Nonbiased sampling of air puff (black boxes) startle-evoked astrocytic Ca2+ (Lck-GCaMP6s) signals using a field-wide grid analysis (see Materials and Methods). B, Histogram of astrocytic Ca2+ elevation amplitudes following air puff startle (n = 5 mice, 46 stimulus trials). C, Average blood flow changes (blue trace) and astrocyte endfoot Ca2+ signals (black trace, Lck-GCaMP6s) following air puff startle, indicated by black bar (n = 5 mice, 46 stimulus trials). Shaded regions in C represent SEM.
Figure 6.
Figure 6.
Neurovascular coupling is intact in visual cortex of lightly sedated, responsive IP3R2 KO mice. A, Percentage of neurons (OGB-1 positive/SR-101 negative) that are responsive to visual stimuli (n = 4 mice each genotype; wild type, n = 169 total cells; KO, n = 177 total cells; Student's t test, p = 0.7328). B, Average neuronal Ca2+ increases in wild type (blue; n = 4 mice, 87 cells, 3132 stimulus trials) and IP3R2 KO (red; n = 4 mice, 88 cells, 3168 stimulus trials) following 5-s-long visual stimulation (black bar). Dashed traces are averages from trials in which no stimuli were presented. C, Average astrocytic Ca2+ dynamics following 5-s-long visual stimulation (black bar) in wild type (blue; n = 4 mice, 35 cells, 1152 stimulus trials) and IP3R2 KO (red; n = 4 mice, 30 cells, 1080 stimulus trials). Dashed traces are averages from trials in which no stimuli were presented. Inset additionally displays wild-type (dashed blue trace) and IP3R2 KO (dashed red trace) nonresponsive neuron Ca2+ signals during visual stimuli, indicating contamination from neuropil signal. D, Average blood flow increase following 5-s-long visual stimulus (black bar) in wild type (blue; n = 7 mice, 379 stimulus trials) and IP3R2 KO (red; n = 8 mice, 414 stimulus trials). Dashed traces are averages from trials in which no stimuli were presented. E, Average blood flow increase to 20-s-long visual stimulus (black bar) in wild type (blue; n = 7 mice, 189 stimulus trials) and IP3R2 KO (red; n = 6 mice, 227 stimulus trials). Dashed traces are averages from trials in which no stimuli were presented. Error bars in A and shaded regions in B–E represent SEM.

Comment in

References

    1. Agulhon C, Fiacco TA, McCarthy KD. Hippocampal short- and long-term plasticity are not modulated by astrocyte Ca2+ signaling. Science. 2010;327:1250–1254. doi: 10.1126/science.1184821. - DOI - PubMed
    1. Agulhon C, Boyt KM, Xie AX, Friocourt F, Roth BL, McCarthy KD. Modulation of the autonomic nervous system and behaviour by acute glial cell Gq protein-coupled receptor activation in vivo. J Physiol. 2013;591:5599–5609. doi: 10.1113/jphysiol.2013.261289. - DOI - PMC - PubMed
    1. Araque A, Martín ED, Perea G, Arellano JI, Buño W. Synaptically released acetylcholine evokes Ca2+ elevations in astrocytes in hippocampal slices. J Neurosci. 2002;22:2443–2450. - PMC - PubMed
    1. Armbruster BN, Li X, Pausch MH, Herlitze S, Roth BL. Evolving the lock to fit the key to create a family of G protein-coupled receptors potently activated by an inert ligand. Proc Natl Acad Sci U S A. 2007;104:5163–5168. doi: 10.1073/pnas.0700293104. - DOI - PMC - PubMed
    1. Attwell D, Buchan AM, Charpak S, Lauritzen M, Macvicar BA, Newman EA. Glial and neuronal control of brain blood flow. Nature. 2010;468:232–243. doi: 10.1038/nature09613. - DOI - PMC - PubMed

Publication types

Substances

LinkOut - more resources