. 2014 Oct 1;10(5):920-937.
doi: 10.1007/s11306-014-0639-9.

Role of the tumor suppressor IQGAP2 in metabolic homeostasis: Possible link between diabetes and cancer

Affiliations

Role of the tumor suppressor IQGAP2 in metabolic homeostasis: Possible link between diabetes and cancer

B Vaitheesvaran et al. Metabolomics. .

Abstract

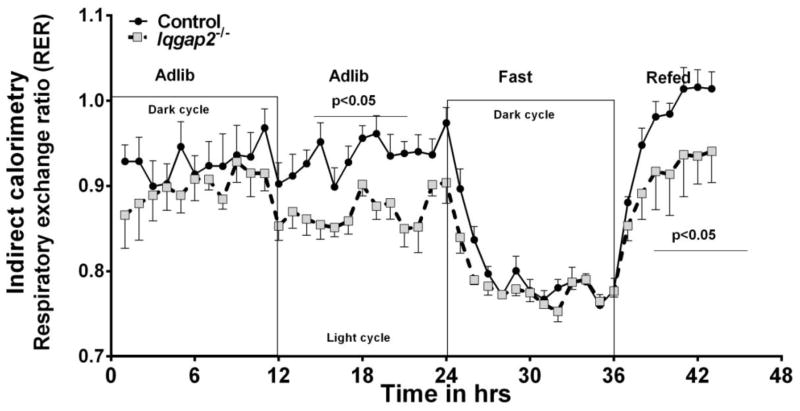
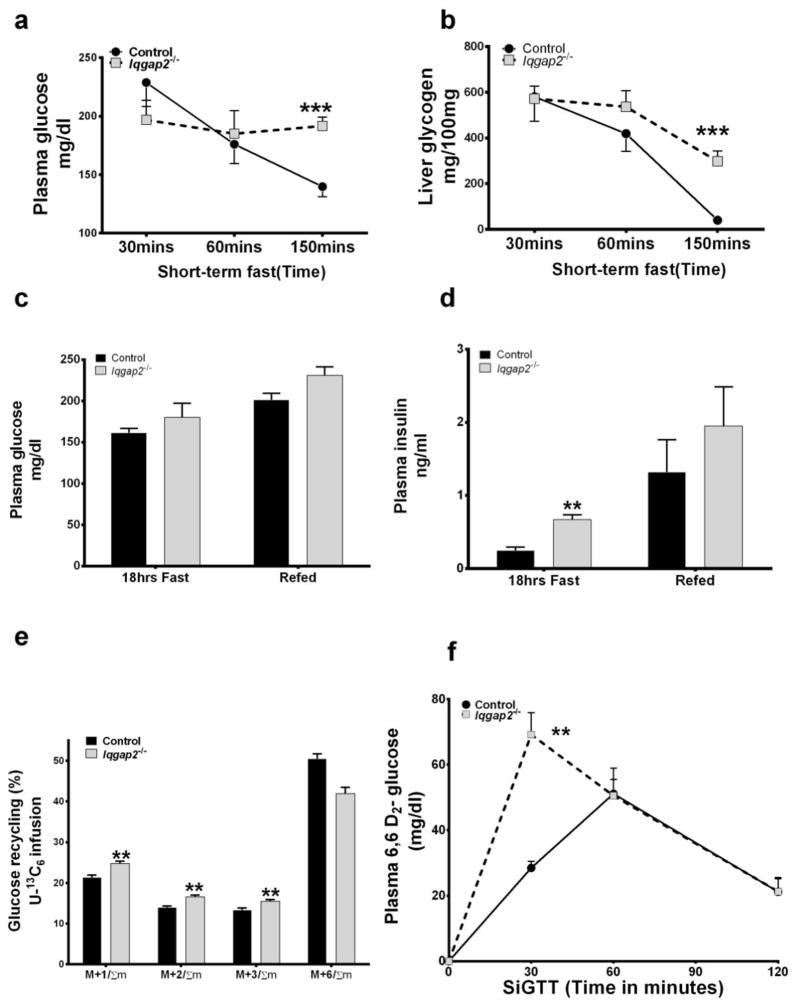
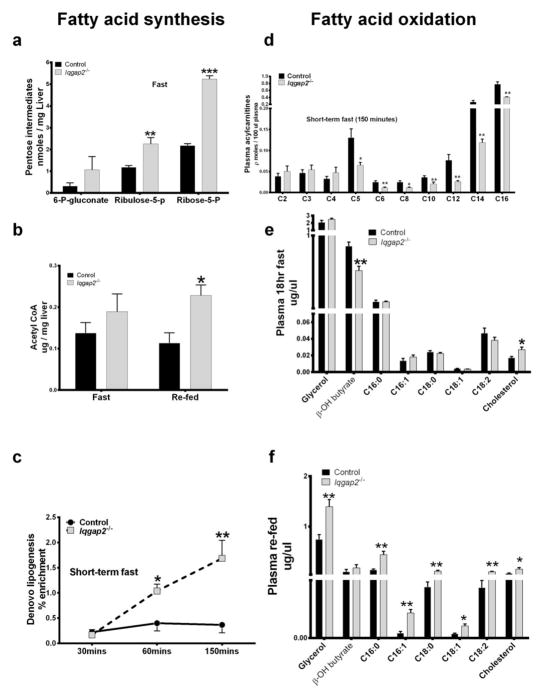
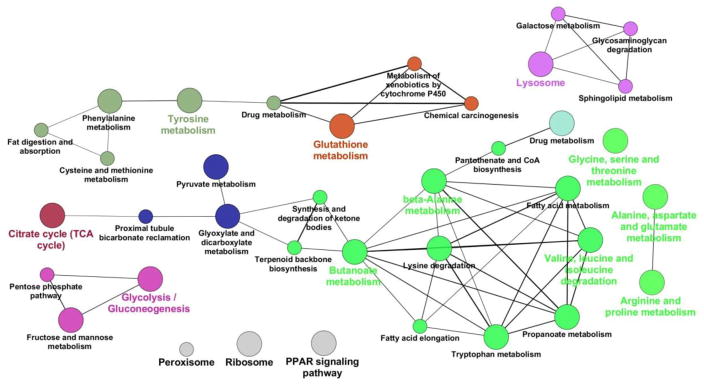
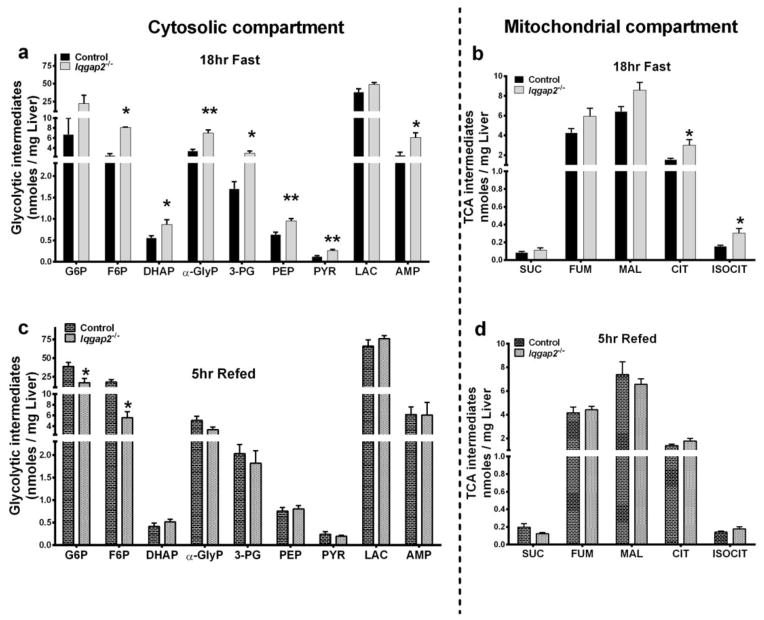
Deficiency of IQGAP2, a scaffolding protein expressed primarily in liver leads to rearrangements of hepatic protein compartmentalization and altered regulation of enzyme functions predisposing development of hepatocellular carcinoma and diabetes. Employing a systems approach with proteomics, metabolomics and fluxes characterizations, we examined the effects of IQGAP2 deficient proteomic changes on cellular metabolism and the overall metabolic phenotype. Iqgap2-/- mice demonstrated metabolic inflexibility, fasting hyperglycemia and obesity. Such phenotypic characteristics were associated with aberrant hepatic regulations of glycolysis/gluconeogenesis, glycogenolysis, lipid homeostasis and futile cycling corroborated with corresponding proteomic changes in cytosolic and mitochondrial compartments. IQGAP2 deficiency also led to truncated TCA-cycle, increased anaplerosis, increased supply of acetyl-CoA for de novo lipogenesis, and increased mitochondrial methyl-donor metabolism necessary for nucleotides synthesis. Our results suggest that changes in metabolic networks in IQGAP2 deficiency create a hepatic environment of a 'pre-diabetic' phenotype and a predisposition to non-alcoholic fatty liver disease (NAFLD) which has been linked to the development of hepatocellular carcinoma.


Figures

Figure 1
Figure 1
Indirect Calorimetry: Respiratory exchange ratio (RER) for Iqgap2−/− and control mice were determined during the diurnal cycle and fasted to refed transitions. Day (light cycle) and night (dark cycle) 12 hours, (over)night fast – 15hrs, day refed - 5hrs in duration. n=8, Data are mean ±SEM. Error bars are represented only in one direction for clarity.
Figure 2
Figure 2
Hepatic metabolomic analysis of glycolytic and the TCA cycle intermediates following an 18hr fast (panels a and c) and 5hr refed (panels b and d) experiments are illustrated. Intermediates are separated according to the cytosolic (left panel) and mitochondrial (right panel) compartments. Data are mean ± SEM for n=5, *p<0.05, **p<0.01 control and Iqgap2−/− mice. G6P-glucose-6-phosphate, F6P-fructose-6-phosphate, DHAP-dihydroxyacetone phosphate, α-GlyP-α-glycerophosphate, 3-PG- 3 phosphoglycerate, PEP-phosphoenol pyruvate, PYR-pyruvate, LAC-lactate, AMP- adenosine mono phosphate. SUC-succinate, FUM-fumarate, MAL-malate, CIT-citrate, ISOCIT-isocitrate.
Figure 3
Figure 3
Experiments illustrating glucose homeostasis for Iqgap2−/− versus control mice. Top panel illustrates glycogenolysis with (a) represents plasma glucose disappearance (b) represents glycogen break down, after 30, 60 and 150 minutes following a short term fast; Each point represents the mean ± SEM, n=5. *p<0.05, ** p <0.01 for Iqgap2−/− vs. control mice. Center panel illustrates levels of plasma glucose (c), plasma insulin (d) after 18 hrs fast/re-feeding; Data is mean ± SEM, n=5. Bottom panel illustrates glucose clearance measured during stable isotope studies (e) represents Cori cycling during [U-13C6]-glucose infusion studies, mi/Σm is the mass isotopomers with i number’13C substitutions as a fraction of the total labeled molecules. Since there are no 13C enriched molecules before the infusion, F is a fraction of (new) plasma glucose derived from U13C-glucose infused as well as 13C glucose from Cori cycle recycling. Plotted data points indicate the mean value ± SEM, n=5, *p<0.05, ** p <0.01 for Iqgap2−/− vs. control mice; and (f) represents peripheral glucose utilization during SipGTT for overnight fasted, Iqgap2−/− vs. control mice. Time course of plasma [6, 6-2H2]-glucose after the bolus i.p injection of [6, 6-2H2]-glucose is shown. Each point shown represents the mean ± SEM, n=5. *p<0.05, ** p <0.01 for Iqgap2−/− vs. control mice.
Figure 4
Figure 4
Metabolomic analyses for lipid homeostasis comprising fatty acid synthesis (left panel) and fatty acid oxidation (right panel). (a) represents hepatic pentose intermediates during 18hr fast. 6-P-glucontate - 6-phospho gluconic acid, Ribulose-5-p – ribulose-5-phosphate, Ribose-5-p – ribose-5-phosphate. (b) represents hepatic acetyl CoA concentrations during 18hr fast and refed states. (c) represents hepatic de novo lipogeneic flux assessed as deuterium incorporation from 2H2O. Each point shown represents the mean ± SEM for fatty acid deuterium enrichment, n=5. *p<0.05, **p <0.01 for Iqgap2−/− vs. control mice. d) represents plasma acylcarnitine profile at (150mins) at the end of a short-term fast experiment. e) represents plasma lipid metabolites during 18hr fast, (f) represents plasma lipid metabolites during 5hr re-feeding experiment. All plotted data points indicate the mean value ± SEM, n=5, *p<0.05, **p <0.01, ***p <0.001 for Iqgap2−/− vs. control mice.
Figure 5
Figure 5
The Cytoscape ClueGO plugin was used to identify enriched KEGG pathways amongst all statistically significant proteins in the fasted and refed comparisons. Nodes containing proteins from related KEGG terms are colored the same, with node size indicating the associated Benjamini-Hochberg corrected p-value for enrichment (smaller p-values are indicated by larger node size), and line width indicating the level of overlap between related nodes (thicker lines indicate a greater overlap).

Similar articles

Cited by

References

    1. Brandt DT, Grosse R. Get to grips: steering local actin dynamics with IQGAPs. EMBO Rep. 2007;8(11):1019–23. - PMC - PubMed
    1. Shannon KB. IQGAP Family Members in Yeast, Dictyostelium, and Mammalian Cells. Int J Cell Biol. 2012;2012:894817. - PMC - PubMed
    1. Briggs MW, Sacks DB. IQGAP proteins are integral components of cytoskeletal regulation. EMBO Rep. 2003;4(6):571–4. - PMC - PubMed
    1. Kuroda S, et al. Identification of IQGAP as a putative target for the small GTPases, Cdc42 and Rac1. J Biol Chem. 1996;271(38):23363–7. - PubMed
    1. McCallum SJ, Erickson JW, Cerione RA. Characterization of the association of the actin-binding protein, IQGAP, and activated Cdc42 with Golgi membranes. J Biol Chem. 1998;273(35):22537–44. - PubMed

LinkOut - more resources