. 2014 Sep 24:5:13.
doi: 10.1186/2041-2223-5-13. eCollection 2014.

Human paternal and maternal demographic histories: insights from high-resolution Y chromosome and mtDNA sequences

Affiliations

Human paternal and maternal demographic histories: insights from high-resolution Y chromosome and mtDNA sequences

Sebastian Lippold et al. Investig Genet. .

Abstract

Background: Comparisons of maternally-inherited mitochondrial DNA (mtDNA) and paternally-inherited non-recombining Y chromosome (NRY) variation have provided important insights into the impact of sex-biased processes (such as migration, residence pattern, and so on) on human genetic variation. However, such comparisons have been limited by the different molecular methods typically used to assay mtDNA and NRY variation (for example, sequencing hypervariable segments of the control region for mtDNA vs. genotyping SNPs and/or STR loci for the NRY). Here, we report a simple capture array method to enrich Illumina sequencing libraries for approximately 500 kb of NRY sequence, which we use to generate NRY sequences from 623 males from 51 populations in the CEPH Human Genome Diversity Panel (HGDP). We also obtained complete mtDNA genome sequences from the same individuals, allowing us to compare maternal and paternal histories free of any ascertainment bias.

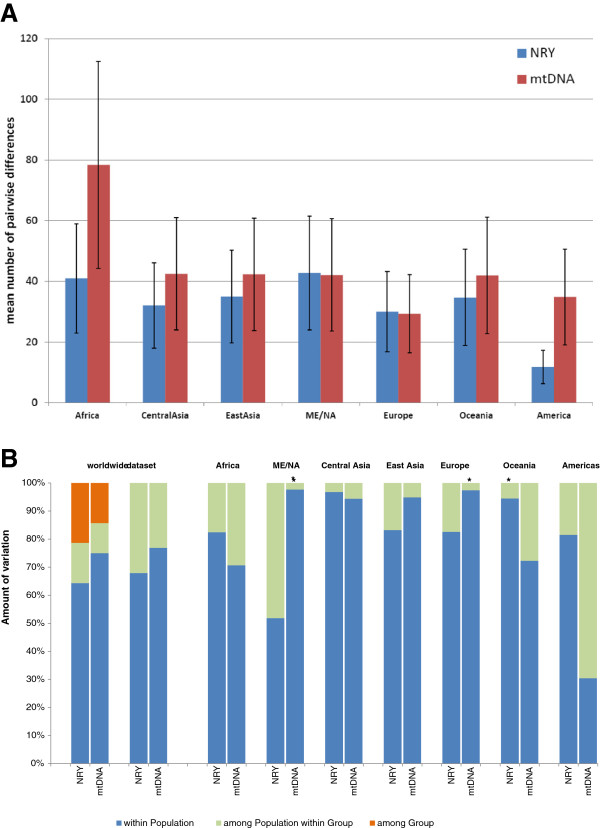
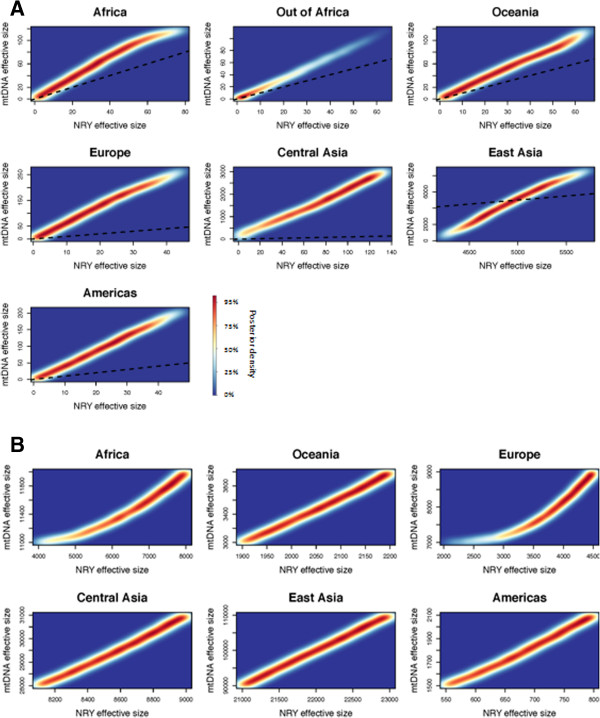
Results: We identified 2,228 SNPs in the NRY sequences and 2,163 SNPs in the mtDNA sequences. Our results confirm the controversial assertion that genetic differences between human populations on a global scale are bigger for the NRY than for mtDNA, although the differences are not as large as previously suggested. More importantly, we find substantial regional variation in patterns of mtDNA versus NRY variation. Model-based simulations indicate very small ancestral effective population sizes (<100) for the out-of-Africa migration as well as for many human populations. We also find that the ratio of female effective population size to male effective population size (Nf/Nm) has been greater than one throughout the history of modern humans, and has recently increased due to faster growth in Nf than Nm.

Conclusions: The NRY and mtDNA sequences provide new insights into the paternal and maternal histories of human populations, and the methods we introduce here should be widely applicable for further such studies.

Keywords: HGDP; Population genetics; Population size; Simulations.


Figures

Figure 1
Figure 1
The model of population history used in simulations. We assumed a single out-of-Africa migration and further population divergence events (see text for further details). The model begins with the ancestral population in Africa (at time T1), a single out-of-Africa migration (T2), the first split between Oceania and Eurasia (T3), then Europe and Asia (T4), followed by Central and East Asia (T5), and finally between East Asia and the Americas (T6). We also required T2 to be greater than T3. The model assumes no migration between regions following divergence; in support of this assumption, there is very little sequence sharing between regions. We do allow changes in population size. This model was first used to estimate divergence times with combined mtDNA and NRY sequences, then the model and estimated mean divergence times were used in separate simulations of the mtDNA and NRY sequences to estimate ancestral and current Nf and Nm.
Figure 2
Figure 2
Diversity and AMOVA results. (A) Mean number of pairwise differences (and SE bars) for the NRY and mtDNA sequences from each regional group. (B) AMOVA results for the entire worldwide dataset, and for each regional group of populations. Two comparisons are shown for the entire dataset; the left comparison includes regional groups as an additional hierarchical level, while the right one does not. * indicates that the among-population component of diversity does not differ significantly from zero (after Bonferroni adjustment of the P value for multiple comparisons).
Figure 3
Figure 3
Bayesian trees and divergence time estimates for mtDNA and NRY haplogroups. (A) mtDNA haplogroups; (B) NRY haplogroups with the fast mutation rate; (C) NRY haplogroups with the slow mutation rate. Red asterisks denote nodes with low support values (<0.95). F* in the NRY trees indicates a sample that was assigned to haplogroup F by SNP genotyping, but does not fall with other haplogroup F samples. Some NRY haplogroup K samples formed a monophyletic clade (labelled K in the trees) while others fell with haplogroup M samples (labelled KM in the trees); see also Additional file 3: Figure S8.
Figure 4
Figure 4
Bayesian skyline plots of population size change through time for regional groups. Two curves are shown for the NRY data, based on ‘fast’ and ‘slow’ mutation rate estimates.
Figure 5
Figure 5
Distribution of Nf and Nm values, based on simulations. The density of the top 1% of the posterior values obtained from simulations of the mtDNA and NRY sequences are shown. (A) ancestral effective population sizes; (B) current effective population sizes. The dashed line in each plot follows a 1:1 ratio.
Figure 6
Figure 6
Pictorial representation of the divergence time and female and male effective population size estimates, based on the simulation results. Red numbers reflect Nf (with ancestral Nf at the point of the red triangle and current Nf at the base of the red triangle) and blue numbers correspondingly reflect ancestral and current Nm. The numbers in the black oval indicate the founding effective sizes for the initial out-of-Africa migration, and dates on arrows indicate divergence times based on the model in Figure 1. Arrows are meant to indicate the schematic direction of migrations and should not be taken as indicating literal migration pathways, for example, the results indicate divergence of the ancestors of Oceanians 61,000 years ago, but not the route(s) people took to get to Oceania.

References

    1. Jobling MA. The impact of recent events on human genetic diversity. Philos Trans R Soc Lond B Biol Sci. 2012;367:793–799. - PMC - PubMed
    1. Heyer E, Chaix R, Pavard S, Austerlitz F. Sex-specific demographic behaviours that shape human genomic variation. Mol Ecol. 2012;21:597–612. - PubMed
    1. Wilkins JF. Unraveling male and female histories from human genetic data. Curr Opin Genet Dev. 2006;16:611–617. - PubMed
    1. Dupanloup I, Pereira L, Bertorelle G, Calafell F, Prata MJ, Amorim A, Barbujani G. A recent shift from polygyny to monogamy in humans is suggested by the analysis of worldwide Y-chromosome diversity. J Mol Evol. 2003;57:85–97. - PubMed
    1. Wei W, Ayub Q, Xue Y, Tyler-Smith C. A comparison of Y-chromosomal lineage dating using either resequencing or Y-SNP plus Y-STR genotyping. Forensic Sci Int Genet. 2013;7:568–572. - PMC - PubMed