. 2014 Aug 12;3(2):269-81.
doi: 10.1016/j.stemcr.2014.06.003. Epub 2014 Jul 4.

Calcium transients closely reflect prolonged action potentials in iPSC models of inherited cardiac arrhythmia

Affiliations

Calcium transients closely reflect prolonged action potentials in iPSC models of inherited cardiac arrhythmia

C Ian Spencer et al. Stem Cell Reports. .

Abstract

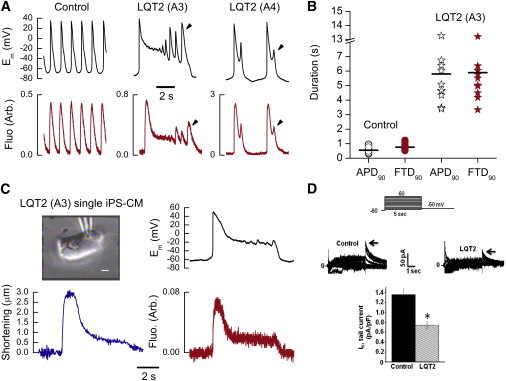
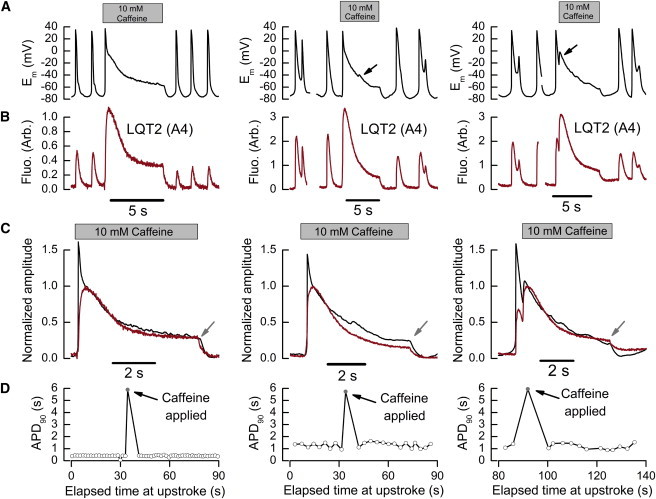
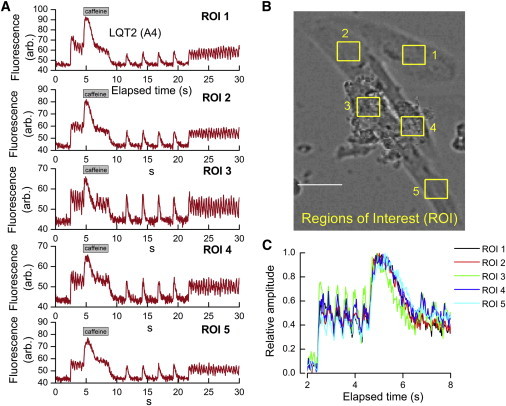
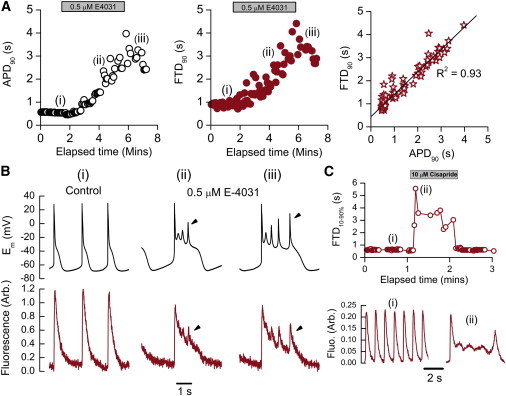
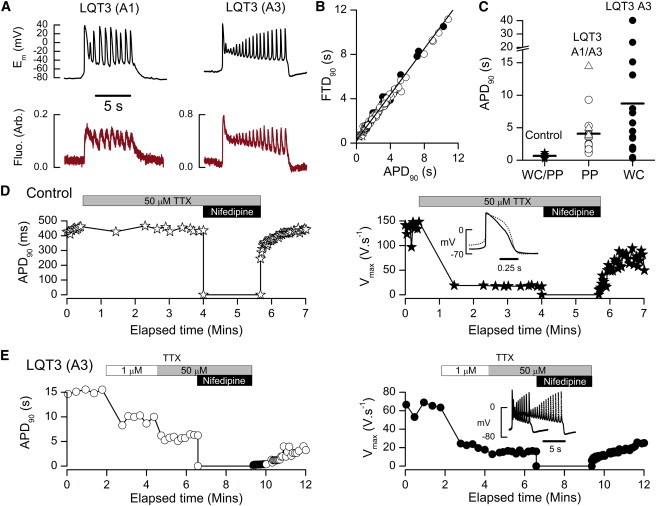
Long-QT syndrome mutations can cause syncope and sudden death by prolonging the cardiac action potential (AP). Ion channels affected by mutations are various, and the influences of cellular calcium cycling on LQTS cardiac events are unknown. To better understand LQTS arrhythmias, we performed current-clamp and intracellular calcium ([Ca(2+)]i) measurements on cardiomyocytes differentiated from patient-derived induced pluripotent stem cells (iPS-CM). In myocytes carrying an LQT2 mutation (HERG-A422T), APs and [Ca(2+)]i transients were prolonged in parallel. APs were abbreviated by nifedipine exposure and further lengthened upon releasing intracellularly stored Ca(2+). Validating this model, control iPS-CM treated with HERG-blocking drugs recapitulated the LQT2 phenotype. In LQT3 iPS-CM, expressing NaV1.5-N406K, APs and [Ca(2+)]i transients were markedly prolonged. AP prolongation was sensitive to tetrodotoxin and to inhibiting Na(+)-Ca(2+) exchange. These results suggest that LQTS mutations act partly on cytosolic Ca(2+) cycling, potentially providing a basis for functionally targeted interventions regardless of the specific mutation site.


Figures

Figure 1
Figure 1
Electrophysiological Phenotypes in Control and LQT2 iPS-CM (A) Upper: spontaneous APs (Em) recorded from representative control iPS-CM and the two clones of LQT2 (as labeled). Lower: simultaneously recorded [Ca2+]i transients (red) in arbitrary units (Fluo). Y axes refer to all traces to the right, and the timescale bar refers to all traces. Arrowheads point to EADs. (B) Mean APD90 and simultaneously acquired FTD90 from control and LQT2 (A3) microclusters. Grand mean values represented by horizontal lines were: control, APD90 0.55 ± 0.05 s and FTD90 0.76 ± 0.06 s (n = 14); LQT2, APD90 5.80 ± 0.90 s (p < 0.001 versus control) and FTD90 5.89 ± 0.86 s, (p < 0.001 versus control) (n = 10). (C) Left, top: photomicrograph of a single LQT2 (A3) iPS-CM (with patch pipette), scale bar, 10 μm. Clockwise from top right: AP from the same myocyte; [Ca2+]i transient (red); cell shortening (blue trace). The signal durations coincided: APD90 = 6.89 s; FTD90 = 6.89 s; and mechanical transient duration at 90% relaxation (MTD90) = 7.01 s. (D) Representative families of E-4031-sensitive IKr tail currents (arrows) in control and LQT2 (A4) iPS-CM, and voltage protocol shown above. The histogram represents peak IKr tail-current densities for control (n = 8), and both LQT2 clones, pooled (n = 19, p < 0.05). Error bars (SEM).
Figure 2
Figure 2
Effects of the Ca2+ Antagonist Nifedipine on Spontaneous APs and [Ca2+]i Transients in Control and LQT2 iPS-CM (A) Upper panel, time course of APs (Em) during superfusion with nifedipine (gray bar) in a representative control iPS-CM microcluster, with numerals to indicate regions of interest (ROI). Center and lower panels: labeled ROI shown on an expanded scale. (B) Upper and center panels, equivalent plots to (A), from a representative LQT2 iPS-CM cluster. Note the increase in beating rate during nifedipine exposure (gray bar). Lower panel, [Ca2+]i transients (red, labeled Fluo, in arbitrary units) from ROI indicated by numerals above. (C) APD90 in (A) and (B) plotted against elapsed time, defined by assigning the point of nifedipine addition (gray bar) to time zero. (Control responses occurred at negative values of elapsed time.) Note that, in the LQT2 microcluster, nifedipine reduced APD90 by 84% (to 0.71 ± 0.01 s), which was still longer than mean pre-nifedipine APD90 in the control microcluster. (D) Changes in [Ca2+]i transients (Fluo, in arbitrary units; red trace) when an unpatched LQT2 microcluster was exposed to 2 μM nifedipine (gray bar), followed by 50 μM tetrodotoxin (TTX) in the continued presence of nifedipine (white bar), which arrested beating. Downward trace steps represent the blocking of excitation light by the shutter.
Figure 3
Figure 3
LQT2 AP Profiles Were Influenced by [Ca2+]i Transients Stimulated by Caffeine-Induced SR Ca2+ Release (A) LQT2 (A4) APs (Em) with slight initial AP prolongation (left) or modest AP prolongation (center and right), before, during, and after the applications of 10 mM caffeine (gray bars). Caffeine was applied in diastole (left, center) or during the ongoing AP (right). Arrows highlight EADs. (B) The [Ca2+]i transients (red, in arbitrary units) associated with the APs of (A); gaps in the traces indicate shutter closings. (C) Overlays of Fluo-4 fluorescence, normalized to the caffeine-induced peak and Em divided by its value at the same time point (peak of caffeine-induced [Ca2+]i transient). Graphs were produced from traces in (A) and (B). Gray arrows indicate caffeine washout. (D) APD90 determined beat-by-beat for the entire experiments of (A). Points corresponding to APs affected by caffeine are shown in gray.
Figure 4
Figure 4
Comparing Spontaneous and Caffeine-Evoked [Ca2+]i Transients in Individual Myocytes in an LQT2 Microcluster (A) Fluo-4 fluorescence averaged in small, numbered regions of interest (ROIs) each within a myocyte of an LQT2 microcluster, plotted (top to bottom) versus time in the videomicrograph. During the time indicated by the gray bar, 10 mM caffeine was added to the superfusion solution. (B) The numbered ROIs in which fluorescence was averaged (yellow rectangles) superimposed on a transmitted light image of the microcluster (scale bar, 50 μm). (C) Overlaid time courses for each ROI at 30 ms resolution (33 frames/s in the videomicrograph). The rising phase of both spontaneous and caffeine-evoked [Ca2+]i transients superimposed completely. Similar results were obtained from five different LQT2 microclusters.
Figure 5
Figure 5
Control Action Potentials and [Ca2+]i Transients Were Prolonged by HERG Blockers (A) Left: APD90 in a representative control microcluster plotted against elapsed time, before and after adding 0.5 μM E-4031 to the superfusion solution (gray bar). Center: equivalent plot of FTD90 (in the same microcluster). Numerals identify individual traces shown in more detail below. Right: FTD90 (from center panel) assigned to the dependent variable and plotted against APD90 (left panel). For the linear fit: slope = 0.97 ± 0.03, intercept = 437.64 ± 38.51 ms, R2 = 0.93. (B) Individual APs (Em, upper panels) and [Ca2+]i transients (red traces in lower panels) denoted by numerals in part (A). These ROI consisted of (i) before exposure to E-4031; (ii) midway; and (iii) at maximal AP prolongation. Arrowheads indicate EADs. (C) Plot of [Ca2+]i transient duration (FTD at 10%–90%) versus elapsed time during an experiment where a control iPS-CM microcluster was exposed to 10 μM cisapride, a rapidly reversible HERG blocker. Individual, numbered [Ca2+]i transients are displayed below. Mean duration increased about 10-fold during cisapride treatment (representative of six microclusters).
Figure 6
Figure 6
Phenotype and Pharmacology of LQT3 iPS-CM (A) APs (Em in mV, top) and [Ca2+]i transients (Fluo in arbitrons, bottom) from microclusters representative of the two LQT3 clones (as labeled). Axes refer to traces to the right, and timescale bar refers to all traces. (B) Plots of FTD90 versus APD90 from clone A1 (filled symbols) and A3 (open symbols) on the same axes, with a combined linear fit: slope = 1.03 ± 0.07, intercept = 0.25 ± 0.02, R2 = 0.99. (C) Dot plot showing APD90 from microclusters under whole cell mode (WC, closed symbols) and perforated patch clamp (PP, open symbols) in control (stars), LQT3 clone A1 (triangles), and LQT3 clone A3 (circles). Means were nonsignificantly different between LQT3 clones, or between PP and WC in any single cell type. Lines represent the overall mean in each category (combined in Table S1). (D) Left: APD90 in a representative control microcluster when exposed to 50 μM TTX (gray bar), and later after adding 2 μM nifedipine (black bar). Introducing TTX initially interrupted beating for 51 s (mean pause 24 ± 7 s, n = 7), but recovery followed. Right: Vmax for upstrokes (in the same APs) diminished from 134.5 ± 4.8 V/s to 17.9 ± 0.3 V/s in TTX. Inset: sample APs before (broken trace) and during (solid trace) TTX exposure showing that TTX altered the AP profile, leaving APD90 unchanged. (E) Left: APD90 changes, equivalent to (D), in an LQT3 (A3) microcluster during exposure to 1 μM TTX (white bar), 50 μM TTX (gray bar), and 50 μM TTX plus 2 μM nifedipine (black bar). Right: Vmax plot in the same LQT3 microcluster. Inset: APs before (broken trace) and during exposure to 50 μM TTX (solid trace).
Figure 7
Figure 7
The Role of Cytosolic Ca2+ in the LQT3 Phenotype (A) Representative LQT3 (A3) APs (top) and [Ca2+]i transients (bottom) before (left) and during (right) exposure to 10 mM caffeine (gray bar). Axes refer to traces to the right, and timescale bar refers to all traces (representative of ten LQT3 (A3) and four LQT3 (A1) microclusters). (B) Inward current (top trace) recorded, at −80 mV, from an LQT3 (A3) myocyte under perforated patch, during a caffeine puff (gray bar) that evoked SR Ca2+ release (lower panel). Li+ sensitivity (not shown) confirmed this current as INCX (n = 5). (C) A prolonged LQT3 (A3) AP was rapidly terminated after most extracellular NaCl (except 5 mM) was replaced by with LiCl (black bar). Em was hyperpolarized, cytosolic Ca2+ was tonically elevated, and Li+ washout evoked another AP. Results were similar in eight replicate microclusters. (D) In a different preparation, the AP accompanying LiCl washout was more delayed, fortuitously revealing that unblocking INCX produced Ca2+ efflux and a simultaneous depolarization (dotted line). (E) LiCl, applied in Ca2+-free extracellular solution (black bar) to additionally eliminate outward INCX, terminated LQT3 (A1) APs, as in (C) (n = 8). The AP associated with Li+ washout was markedly prolonged relative to prior APs (labeled “control”). (F) Time course of LQT3 (A3) APs (upper panel) and [Ca2+]i transients (lower, red trace) during exposure to 50 μM cyclopiazonic acid (CPA) to block SERCA (gray bar). A slowly decaying, prolonged plateau of cytosolic Ca2+ established a corresponding long depolarization, proceeding beyond CPA washout. Gaps in the fluorescence trace correspond to shutter closures. (Representative of five microclusters showing similar responses.)

References

    1. Abassi Y.A., Xi B., Li N., Ouyang W., Seiler A., Watzele M., Kettenhofen R., Bohlen H., Ehlich A., Kolossov E. Dynamic monitoring of beating periodicity of stem cell-derived cardiomyocytes as a predictive tool for preclinical safety assessment. Br. J. Pharmacol. 2012;165:1424–1441. - PMC - PubMed
    1. Bailie D.S., Inoue H., Kaseda S., Ben-David J., Zipes D.P. Magnesium suppression of early afterdepolarizations and ventricular tachyarrhythmias induced by cesium in dogs. Circulation. 1988;77:1395–1402. - PubMed
    1. Bankston J.R., Yue M., Chung W., Spyres M., Pass R.H., Silver E., Sampson K.J., Kass R.S. A novel and lethal de novo LQT-3 mutation in a newborn with distinct molecular pharmacology and therapeutic response. PLoS ONE. 2007;2:e1258. - PMC - PubMed
    1. Bellin M., Casini S., Davis R.P., D’Aniello C., Haas J., Ward-van Oostwaard D., Tertoolen L.G., Jung C.B., Elliott D.A., Welling A. Isogenic human pluripotent stem cell pairs reveal the role of a KCNH2 mutation in long-QT syndrome. EMBO J. 2013;32:3161–3175. - PMC - PubMed
    1. Bokil N.J., Baisden J.M., Radford D.J., Summers K.M. Molecular genetics of long QT syndrome. Mol. Genet. Metab. 2010;101:1–8. - PubMed

Publication types

MeSH terms