. 2014 Sep 25;10(9):e1004572.
doi: 10.1371/journal.pgen.1004572. eCollection 2014 Sep.

Admixture in Latin America: geographic structure, phenotypic diversity and self-perception of ancestry based on 7,342 individuals

Affiliations

Admixture in Latin America: geographic structure, phenotypic diversity and self-perception of ancestry based on 7,342 individuals

Andrés Ruiz-Linares et al. PLoS Genet. .

Abstract

The current genetic makeup of Latin America has been shaped by a history of extensive admixture between Africans, Europeans and Native Americans, a process taking place within the context of extensive geographic and social stratification. We estimated individual ancestry proportions in a sample of 7,342 subjects ascertained in five countries (Brazil, Chile, Colombia, México and Perú). These individuals were also characterized for a range of physical appearance traits and for self-perception of ancestry. The geographic distribution of admixture proportions in this sample reveals extensive population structure, illustrating the continuing impact of demographic history on the genetic diversity of Latin America. Significant ancestry effects were detected for most phenotypes studied. However, ancestry generally explains only a modest proportion of total phenotypic variation. Genetically estimated and self-perceived ancestry correlate significantly, but certain physical attributes have a strong impact on self-perception and bias self-perception of ancestry relative to genetically estimated ancestry.


Conflict of interest statement

The authors have declared that no competing interests exist.

Figures
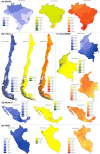
Figure 1
Figure 1. Geographic distribution of Native American (blue), African (green) and European (red) ancestry based on individual estimates for samples from (A) Brazil, (B) Chile, (C) Colombia, (D) México and (E) Perú.
To facilitate comparison, color intensity transitions occur at 10% ancestry intervals for all maps. The birthplace of individuals are indicated by purple dots on the African ancestry map. Sampling density is shown in Figure S4. Maps were obtained using Kriging interpolation as detailed in the text.
Figure 2
Figure 2. Bar plots contrasting skin pigmentation (Melanin Index) to proportion of European genetic ancestry across four self-identified ethno/racial categories in samples from Brazil, Chile, Colombia, México and Perú.
Sample sizes and all estimates of pigmentation and ancestry, are presented in Table S4. In Perú no individual self-identified as “Black”.
Figure 3
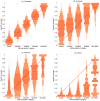
Figure 3. Vertical histograms (pyramid plots) showing the distribution of genetic ancestry for each of the five self-perceived ancestry categories.
As reference, (A) shows the theoretical case of agreement between self-perceived and genetically estimated ancestry. For this plot random values were drawn from a beta distribution such that, for each self-perception band, the median ancestry lies at the centre of a 0.2 interval containing 75% of the simulated ancestry values. The number of simulated values was fixed at our sample size. Panels (B), (C) and (D) show respectively, the observed distributions for European, Native American and African ancestries. The red diagonal line indicates the midpoint, on the genetic ancestry scale, of each self-perceived ancestry category. Distributions are coded in three shades of orange: the darkest shade denotes the central quartiles (the median shown as a brown line), the medium-shade indicates the 5%–95% range, and the lightest shade refers to samples outside this range. For European ancestry, self-perception tends to underestimate genetic ancestry (the distributions are mostly above the diagonal). By contrast, self-perception tends to overestimate African ancestry (the distributions are mostly below the diagonal). At increasing levels of Native American genetic ancestry self-perception first underestimates then overestimates genetic ancestry (the distributions are on both sides of the diagonal). Simulations and plots were carried out using MATLAB .

References

    1. Sturm RA (2009) Molecular genetics of human pigmentation diversity. Hum Mol Genet 18: R9–17. - PubMed
    1. Liu F, Wollstein A, Hysi PG, Ankra-Badu GA, Spector TD, et al. (2010) Digital quantification of human eye color highlights genetic association of three new loci. PLoS Genet 6: e1000934. - PMC - PubMed
    1. Jacobs LC, Wollstein A, Lao O, Hofman A, Klaver CC, et al. (2013) Comprehensive candidate gene study highlights UGT1A and BNC2 as new genes determining continuous skin color variation in Europeans. Hum Genet 132: 147–158. - PubMed
    1. Zhang M, Song F, Liang L, Nan H, Zhang J, et al. (2013) Genome-wide association studies identify several new loci associated with pigmentation traits and skin cancer risk in European Americans. Hum Mol Genet 22: 2948–2959. - PMC - PubMed
    1. Morner M (1967) Race Mixture in the History of Latin America. Little Brown & Company. 178 p.

Publication types

LinkOut - more resources