Clinical Trial
. 2014 Sep 25;9(9):e107903.
doi: 10.1371/journal.pone.0107903. eCollection 2014.

Assessment of humoral immune responses to blood-stage malaria antigens following ChAd63-MVA immunization, controlled human malaria infection and natural exposure

Affiliations
Clinical Trial

Assessment of humoral immune responses to blood-stage malaria antigens following ChAd63-MVA immunization, controlled human malaria infection and natural exposure

Sumi Biswas et al. PLoS One. .

Abstract

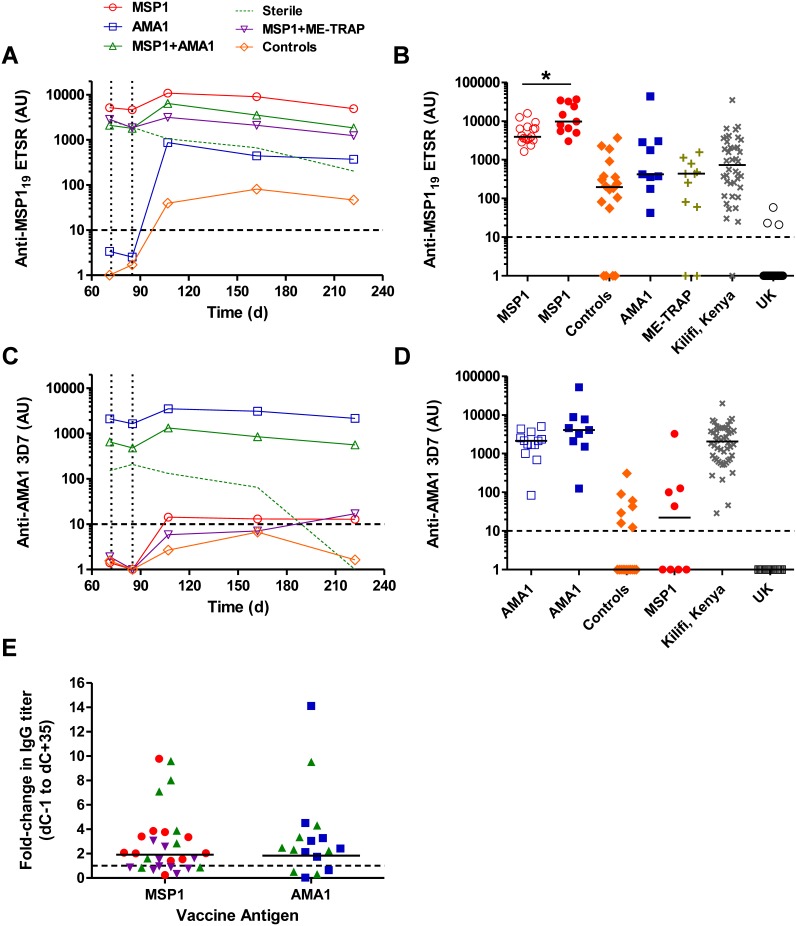
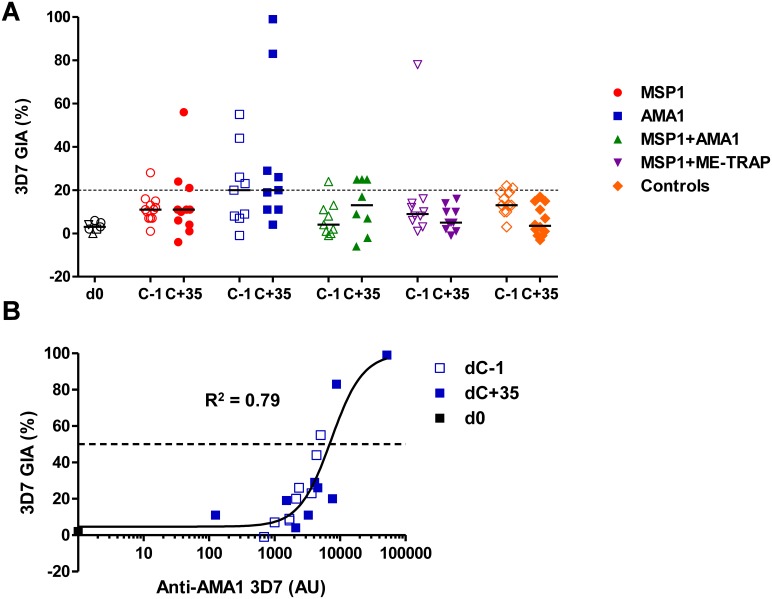
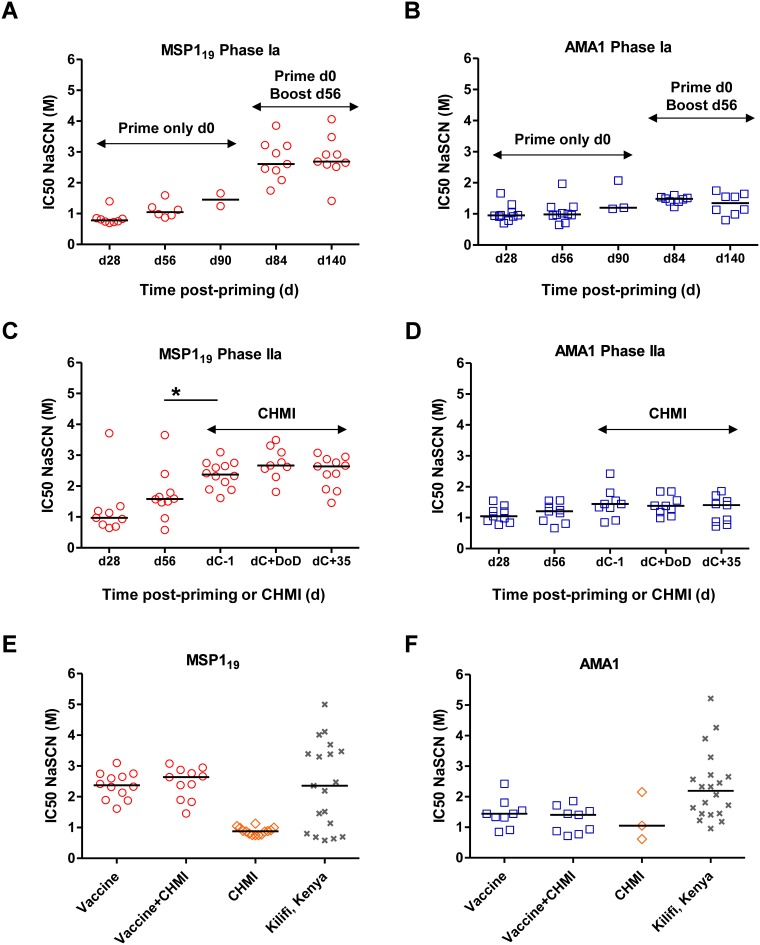
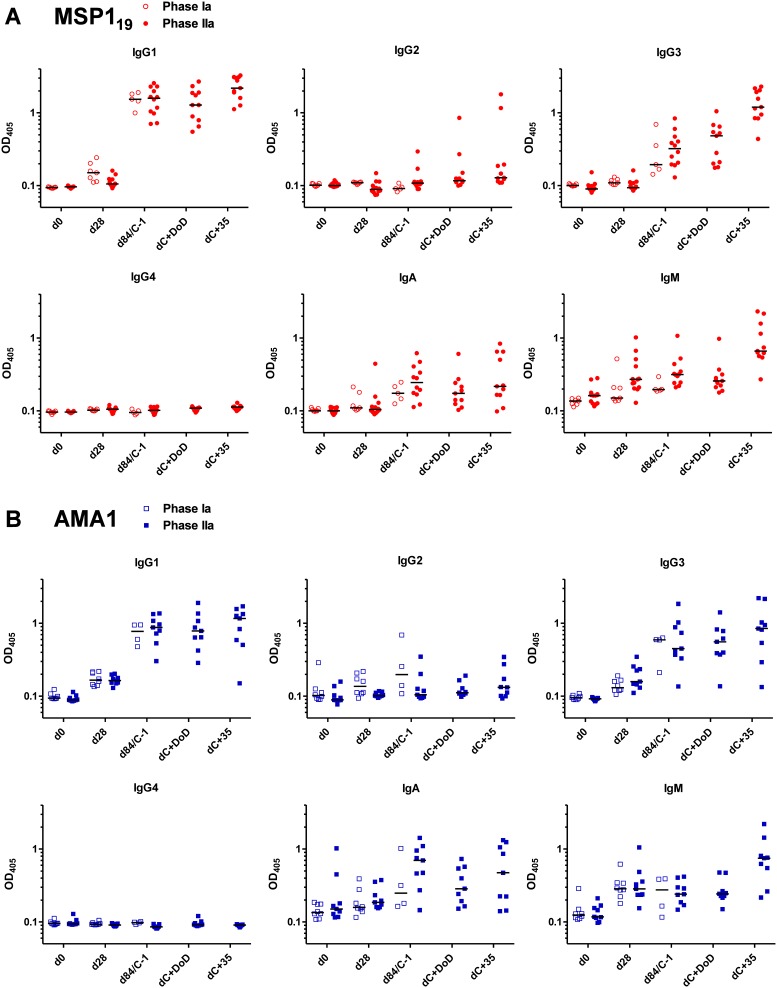
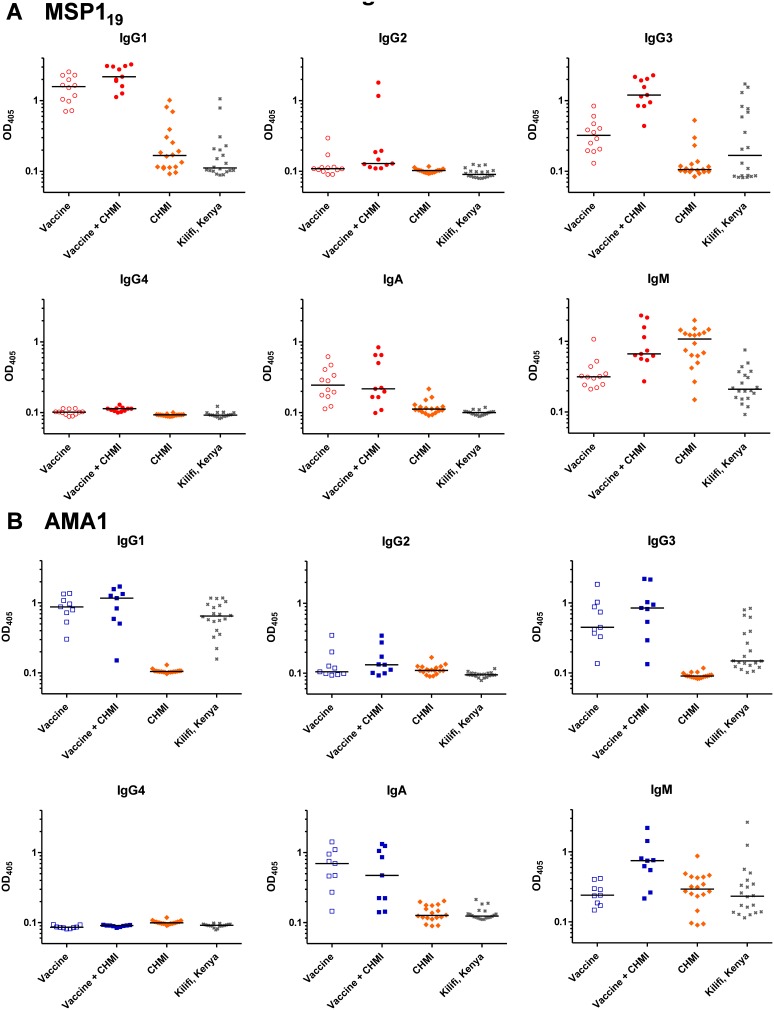
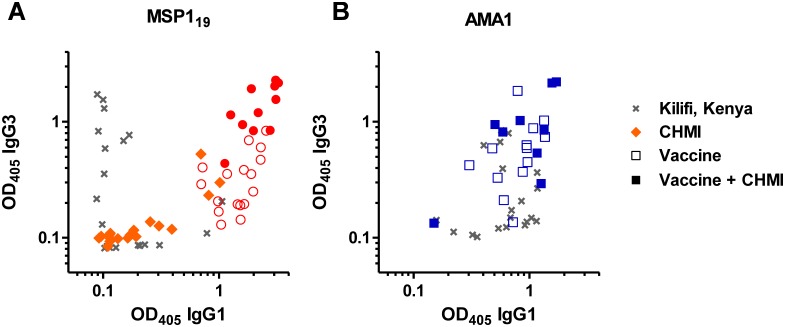
The development of protective vaccines against many difficult infectious pathogens will necessitate the induction of effective antibody responses. Here we assess humoral immune responses against two antigens from the blood-stage merozoite of the Plasmodium falciparum human malaria parasite--MSP1 and AMA1. These antigens were delivered to healthy malaria-naïve adult volunteers in Phase Ia clinical trials using recombinant replication-deficient viral vectors--ChAd63 to prime the immune response and MVA to boost. In subsequent Phase IIa clinical trials, immunized volunteers underwent controlled human malaria infection (CHMI) with P. falciparum to assess vaccine efficacy, whereby all but one volunteer developed low-density blood-stage parasitemia. Here we assess serum antibody responses against both the MSP1 and AMA1 antigens following i) ChAd63-MVA immunization, ii) immunization and CHMI, and iii) primary malaria exposure in the context of CHMI in unimmunized control volunteers. Responses were also assessed in a cohort of naturally-immune Kenyan adults to provide comparison with those induced by a lifetime of natural malaria exposure. Serum antibody responses against MSP1 and AMA1 were characterized in terms of i) total IgG responses before and after CHMI, ii) responses to allelic variants of MSP1 and AMA1, iii) functional growth inhibitory activity (GIA), iv) IgG avidity, and v) isotype responses (IgG1-4, IgA and IgM). These data provide the first in-depth assessment of the quality of adenovirus-MVA vaccine-induced antibody responses in humans, along with assessment of how these responses are modulated by subsequent low-density parasite exposure. Notable differences were observed in qualitative aspects of the human antibody responses against these malaria antigens depending on the means of their induction and/or exposure of the host to the malaria parasite. Given the continued clinical development of viral vectored vaccines for malaria and a range of other diseases targets, these data should help to guide further immuno-monitoring studies of vaccine-induced human antibody responses.


Conflict of interest statement

Competing Interests: SCdC, KAC, AVSH and SJD are named inventors on patent applications covering malaria vaccines and immunization regimes (Adenoviral vectors encoding a pathogen or tumour antigen, WO/2008/122811; Viral vector immunogenic compositions, GB1016471.3). This does not alter the authors' adherence to PLoS ONE policies on sharing data and materials.

Figures

Figure 1
Figure 1. Assessment of IgG antibody responses post-CHMI.
Mean anti-MSP119 serum IgG responses were assessed over time by ELISA in a Phase IIa CHMI trial . Dashed vertical lines represent: day 72 (d72) = day of CHMI; and d85 = nominal day of diagnosis. The first follow-up time-point after CHMI = day 107 (dC+35). (A) VAC039: MSP1 vaccinees (n = 89 depending on time-point assessed); AMA1-only vaccinees (n = 9); MSP1+AMA1 vaccinees (n = 8) plus one volunteer who was steriley protected in this group (dashed line); MSP1+ME-TRAP (n = 10); and infectivity controls (n = 6). The second Phase IIa CHMI trial with MSP1 vaccinees (VAC037) is shown in Figure S2. (B) Individual and median anti-MSP119 serum IgG responses are shown for MSP1 vaccinees at the peak after the MVA boost (open symbols, n = 17) , and at dC+35 following CHMI (closed symbols, n = 11) ; at dC+35 for 18 infectivity control volunteers from three separate CHMI studies , ; at dC+35 for AMA1 vaccinees (n = 9) and non-sterilely protected ME-TRAP vaccinees (n = 11) ; from 40 naturally-exposed immune adults from Kilifi, Kenya; and 59 malaria-naïve UK adults (prior to immunization or CHMI). (C) Anti-AMA1 serum IgG responses for each group as in panel A. (D) Individual and median anti-AMA1 serum IgG responses are shown for AMA1 vaccinees at the peak after the MVA boost (open symbols, n = 13) , and at dC+35 following CHMI (closed symbols, n = 9) ; at dC+35 for 18 infectivity control volunteers from three separate CHMI studies , ; at dC+35 for MSP1-only vaccinees (n = 8) ; from 50 naturally-exposed immune adults from Kilifi, Kenya; and 19 malaria-naïve UK adults (prior to immunization or CHMI). (E) The fold-change in IgG titer from dC−1 (d71) to dC+35 (d107) is reported. Individual responses and geomean are shown, with symbol colouring according to group in panels A and C. The limit of detection in both ELISA assays was 10 AU (dashed horizontal line), and we assigned the AU value of 1.0 for any test samples with less than 10 AU. Any values more than 10 AU are considered as positive responses. *P<0.05 (Wilcoxon matched-pairs signed rank test).
Figure 2
Figure 2. Assessment of functional GIA post-CHMI.
(A) In vitro GIA of purified IgG was assessed at 10mg/mL against 3D7 clone P. falciparum parasites. Individual data and medians are shown for each vaccinated or control group at the dC−1 and dC+35 time-points (n = 812). Pre-immunization (d0) sera were either tested individually or pooled (n = 7). Responses >20% are typically regarded as positive. (B) Relationship between GIA and anti-AMA1 serum IgG responses measured by ELISA. Results for volunteers immunized with ChAd63-MVA AMA1 are shown on dC−1 (before CHMI) and dC+35 (after CHMI). Non-linear regression curve is also shown (n = 19). The level of AMA1 antibody measured in this ELISA assay that gave 50% GIA (EC50, dashed black line) was 7294 AU (95% C.I. = 398113362).
Figure 3
Figure 3. Assessment of IgG avidity following vaccination, CHMI and natural exposure. Avidity of serum IgG responses was assessed by NaSCN-displacement ELISA and is reported as the molar concentration of NaSCN required to reduce the OD405 to 50% of that without NaSCN (IC50).
Where samples at specific time-points tested negative for antigen-specific total IgG responses by ELISA or these responses were too low to analyse, the avidity is not reported. Individual responses are shown, plus the median of the positive samples (i.e. those with a detectable antigen-specific response in the total IgG ELISA that enabled assessment for avidity). (A) Anti-MSP119 responses in the VAC037 Phase Ia clinical trial following ChAd63 MSP1 priming immunization (at d28, d56 and d90) or following the MVA MSP1 boost (d84 and d140). (B) Anti-AMA1 responses in the VAC036 Phase Ia clinical trial , reported as in panel A. (C) Anti-MSP119 responses in the VAC039 Phase IIa clinical trial following ChAd63 MSP1 priming immunization (at d28 and d56); or following the MVA MSP1 boost (dC−1, equivalent to d84 in panel A); or following CHMI at day of diagnosis, dC+DoD, or at first follow-up post-drug treatment, dC+35. (D) Anti-AMA1 responses in the VAC039 Phase IIa clinical trial , reported as in panel C. In panels A–D, n = 212 depending on sample availability for each tested time-point. (E) Individual and median anti-MSP119 serum IgG avidity responses are shown for MSP1-only vaccinees at the peak after the MVA MSP1 boost (“Vaccine”, n = 12) and at dC+35 following CHMI (“Vaccine+CHMI”, n = 11) ; at dC+35 for 14 infectivity control volunteers from three separate CHMI studies (“CHMI”) , ; and from 19 naturally-exposed immune adults from Kilifi, Kenya. (F) Individual and median anti-AMA1 serum IgG avidity responses are shown for AMA1-only vaccinees at the peak after the MVA AMA1 boost (n = 9) and at dC+35 following CHMI (n = 9) ; and for 3 infectivity control volunteers and 20 naturally-exposed immune adults from Kilifi, Kenya. *P<0.05 (Wilcoxon matched-pairs signed rank test).
Figure 4
Figure 4. Assessment of antibody isotype profiles following vaccination and CHMI. Isotype profiles of serum antibody responses were assessed by ELISA.
(A) Anti-MSP119 responses in the VAC037 Phase Ia clinical trial (open symbols) and the VAC039 Phase IIa clinical trial (closed symbols) . Responses are shown at baseline (d0); following ChAd63 MSP1 priming immunization (d28); following the MVA MSP1 boost (d84 in the Phase Ia trial or dC−1 in the Phase IIa trial); or following CHMI at day of diagnosis, dC+DoD, or at first follow-up post drug treatment, dC+35. (B) Anti-AMA1 responses in the VAC036 Phase Ia clinical trial and VAC039 Phase IIa trial , reported as in panel A. In all panels, individual and median responses are shown, n = 413 depending on sample availability for each tested time-point.
Figure 5
Figure 5. Assessment of antibody isotype profiles following vaccination, CHMI and natural exposure.
Isotype profiles of serum antibody responses were assessed by ELISA. (A) Individual and median anti-MSP119 serum antibody isotype responses are shown for MSP1-only vaccinees at the peak after the MVA MSP1 boost (“Vaccine”, n = 12) and at dC+35 following CHMI (“Vaccine+CHMI”, n = 11) ; at dC+35 for 18 infectivity control volunteers from three separate CHMI studies , ; and from 20 naturally-exposed immune adults from Kilifi, Kenya. (B) Individual and median anti-AMA1 serum antibody isotype responses are shown for AMA1-only vaccinees at the peak after the MVA AMA1 boost (n = 9) and at dC+35 following CHMI (n = 9) ; and for infectivity control volunteers and naturally-exposed immune adults from Kilifi, Kenya as in panel A.
Figure 6
Figure 6. Correlations between anti-MSP119 and –AMA1 IgG1 and IgG3 isotype ELISA responses in different exposure populations.
Serum IgG1 and IgG3 isotype responses were assessed by ELISA against (A) MSP119 (ETSR allele) and (B) AMA1 (3D7 allele). Correlations are shown: following MSP1 (n = 17) or AMA1 (n = 13) viral vectored vaccination only d84/dC−1 sera (open circle and square symbols respectively); following MSP1 (n = 11) or AMA1 (n = 9) vaccination followed by CHMI dC+35 sera (closed circle and square symbols respectively); following CHMI only (n = 18 for MSP119 only) in control volunteers’ dC+35 sera (closed diamond symbols); and for immune sera from Kenyan adults (n = 20; cross symbols).

References

    1. Hill AV (2011) Vaccines against malaria. Philos Trans R Soc Lond B Biol Sci 366: 2806–2814. - PMC - PubMed
    1. Murray CJ, Rosenfeld LC, Lim SS, Andrews KG, Foreman KJ, et al. (2012) Global malaria mortality between 1980 and 2010: a systematic analysis. Lancet 379: 413–431. - PubMed
    1. Alonso PL, Tanner M (2013) Public health challenges and prospects for malaria control and elimination. Nat Med 19: 150–155. - PubMed
    1. Langhorne J, Ndungu FM, Sponaas AM, Marsh K (2008) Immunity to malaria: more questions than answers. Nat Immunol 9: 725–732. - PubMed
    1. Goodman AL, Draper SJ (2010) Blood-stage malaria vaccines - recent progress and future challenges. Ann Trop Med Parasitol 104: 189–211. - PubMed

Publication types

MeSH terms