

Intra- and inter-pandemic variations of antiviral, antibiotics and decongestants in wastewater treatment plants and receiving rivers
- PMID: 25254643
- PMCID: PMC4177917
- DOI: 10.1371/journal.pone.0108621
Intra- and inter-pandemic variations of antiviral, antibiotics and decongestants in wastewater treatment plants and receiving rivers
Abstract
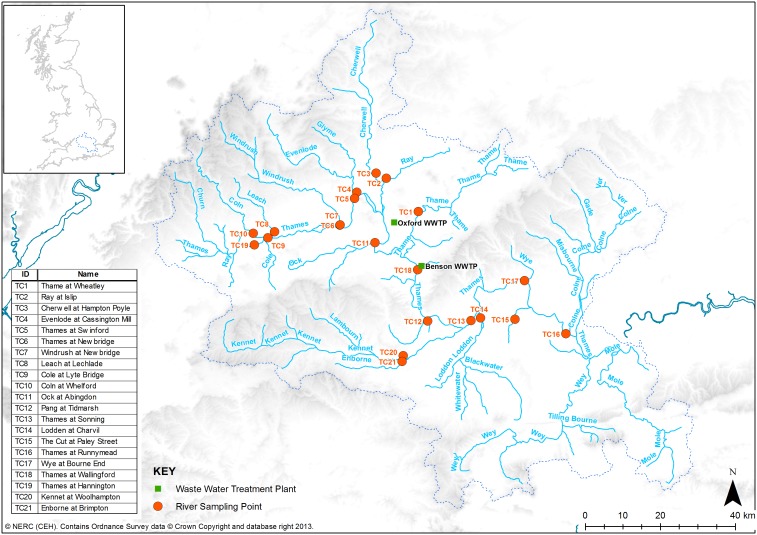
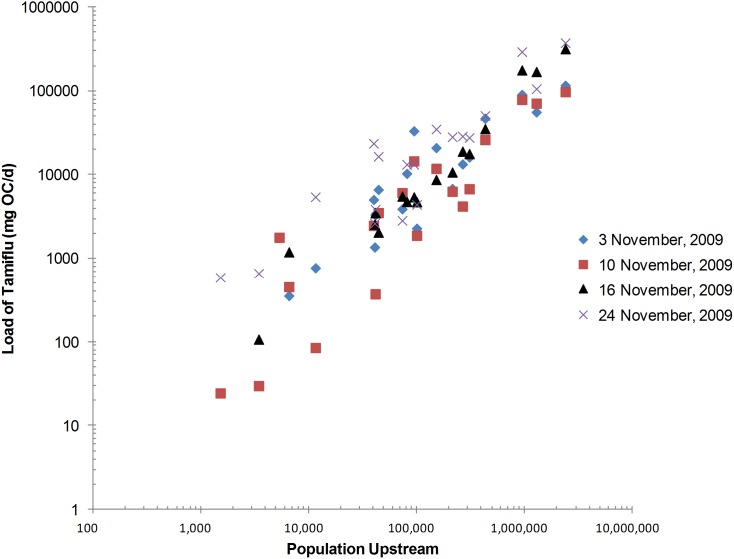
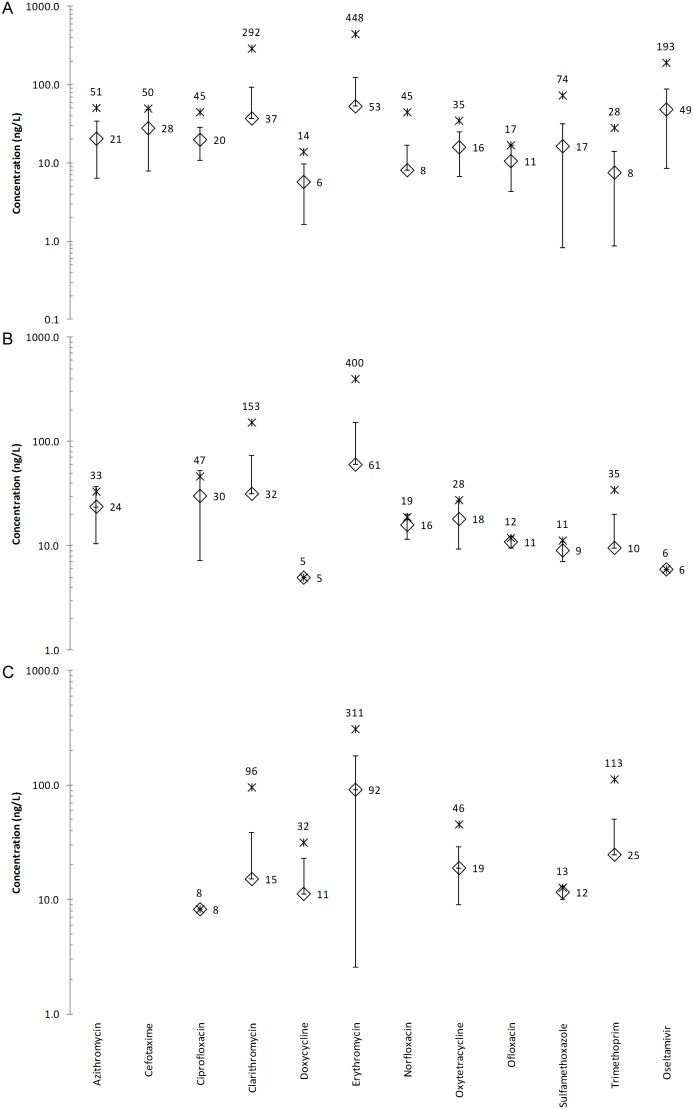
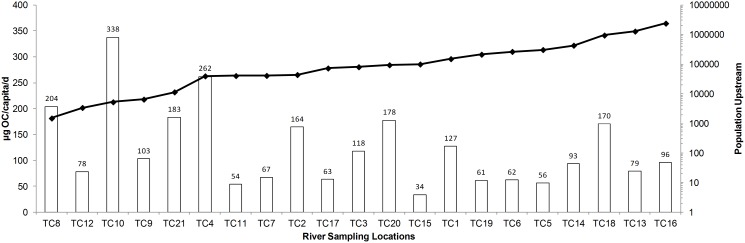
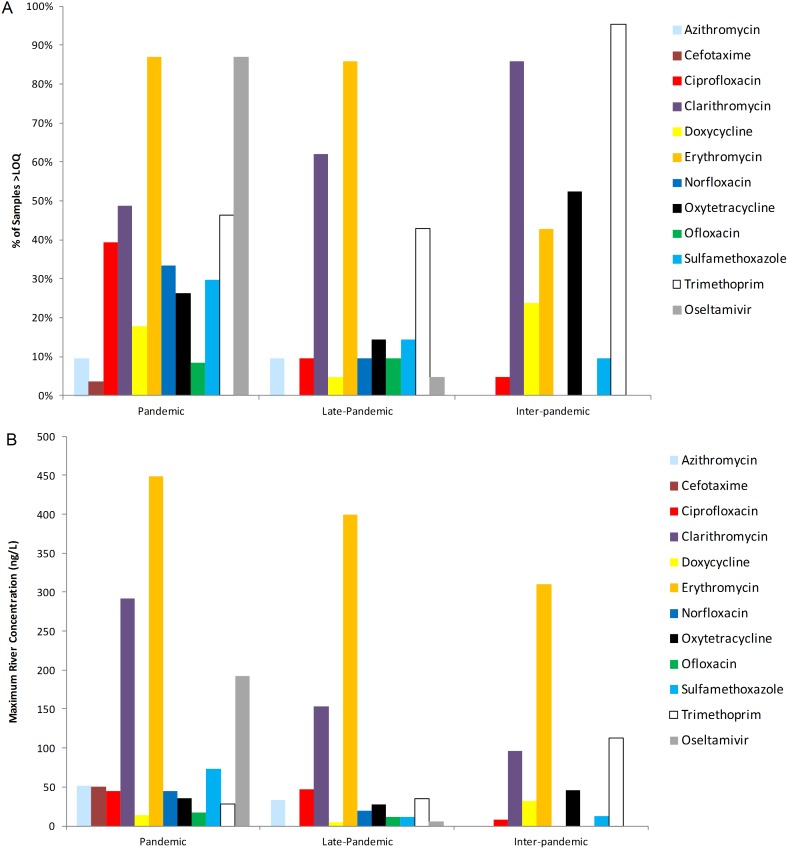
The concentration of eleven antibiotics (trimethoprim, oxytetracycline, ciprofloxacin, azithromycin, cefotaxime, doxycycline, sulfamethoxazole, erythromycin, clarithromycin, ofloxacin, norfloxacin), three decongestants (naphazoline, oxymetazoline, xylometazoline) and the antiviral drug oseltamivir's active metabolite, oseltamivir carboxylate (OC), were measured weekly at 21 locations within the River Thames catchment in England during the month of November 2009, the autumnal peak of the influenza A[H1N1]pdm09 pandemic. The aim was to quantify the pharmaceutical response to the pandemic and compare this to drug use during the late pandemic (March 2010) and the inter-pandemic periods (May 2011). A large and small wastewater treatment plant (WWTP) were sampled in November 2009 to understand the differential fate of the analytes in the two WWTPs prior to their entry in the receiving river and to estimate drug users using a wastewater epidemiology approach. Mean hourly OC concentrations in the small and large WWTP's influent were 208 and 350 ng/L (max, 2070 and 550 ng/L, respectively). Erythromycin was the most concentrated antibiotic measured in Benson and Oxford WWTPs influent (max=6,870 and 2,930 ng/L, respectively). Napthazoline and oxymetazoline were the most frequently detected and concentrated decongestant in the Benson WWTP influent (1650 and 67 ng/L) and effluent (696 and 307 ng/L), respectively, but were below detection in the Oxford WWTP. OC was found in 73% of November 2009's weekly river samples (max=193 ng/L), but only in 5% and 0% of the late- and inter-pandemic river samples, respectively. The mean river concentration of each antibiotic during the pandemic largely fell between 17-74 ng/L, with clarithromycin (max=292 ng/L) and erythromycin (max=448 ng/L) yielding the highest single measure. In general, the concentration and frequency of detecting antibiotics in the river increased during the pandemic. OC was uniquely well-suited for the wastewater epidemiology approach owing to its nature as a prodrug, recalcitrance and temporally- and spatially-resolved prescription statistics.
Conflict of interest statement
Figures
References
-
- Azuma T, Nakada N, Yamashita N, Tanaka H (2013) Mass balance of anti-influenza drugs discharged into the Yodo River system, Japan, under an influenza outbreak. Chemosphere 93: 1672–1677. - PubMed
-
- Dollery C (1999) Therapeutic Drugs. London: Harcourt Brace and Company Limited.
Publication types
MeSH terms
Substances
LinkOut - more resources
Full Text Sources
Other Literature Sources
Medical
Research Materials
Miscellaneous
