

Fascicular ratio: a new parameter to evaluate peripheral nerve pathology on magnetic resonance imaging: a feasibility study on a 3T MRI system
- PMID: 25255018
- PMCID: PMC4616287
- DOI: 10.1097/MD.0000000000000068
Fascicular ratio: a new parameter to evaluate peripheral nerve pathology on magnetic resonance imaging: a feasibility study on a 3T MRI system
Abstract
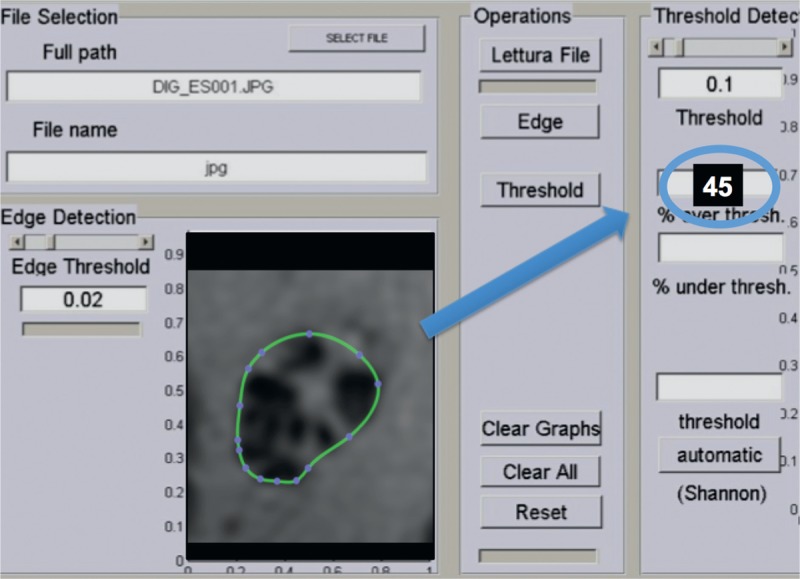
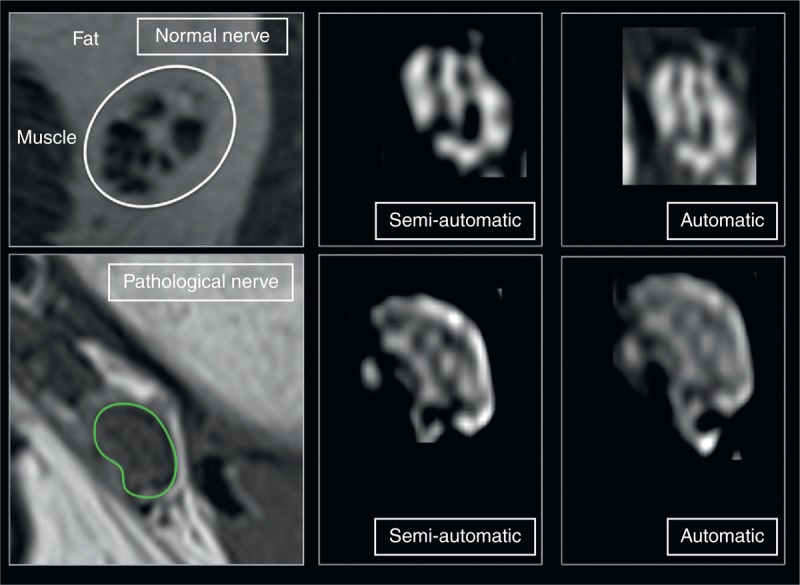
The objective of the study was to define and quantitatively evaluate the fascicular ratio (FR) on magnetic resonance imaging (MRI) in patients with peripheral neuropathies compared with healthy controls. Forty control subjects (20 women, 20 men; age, 44.6 ± 13.4 years) and 40 patients with peripheral neuropathy (22 women, 18 men; age, 50.3 ± 10.2 years) were examined with a standard 3T MRI protocol. With customized software (with semiautomatic and automatic interface), the hypointense and hyperintense areas of the peripheral nerves corresponding to fascicular and nonfascicular tissue were examined on T1-weighted sequences. The ratio of fascicular pixels to total pixels was called FR. Correlation with FR calculated on high-resolution ultrasound was performed. The statistical analysis included the Mann-Whitney U test of controls versus patients, the receiver operating characteristic (ROC) analysis, and the subgroup analysis of patients according to etiologies of neuropathy. Intraobserver and interobserver agreement was calculated based on the evaluation made by 3 readers. Finally, a complete automatic evaluation was performed. On MRI, FRs were significantly increased in patients compared with controls (FR, 76.7 ± 15.1 vs 56 ± 12.3; P < 0.0001 for the semiautomatic interface; and FR 66.3 ± 17.5 vs 47.8 ± 18.4; P < 0.0001 for the automatic interface). The increase in FR was caused mainly by an increase in the hypointense part of the nerve. This observation was valid for all causes of neuropathies. ROC analysis found an area under the curve of 0.75 (95% confidence interval, 0.44-0.81) for FR to discriminate neuropathy from control. The correlation coefficient between MRI and ultrasound was significant (r = 0.49; 95% confidence interval for r, 0.21-0.70; P = 0.012). With the semiautomated evaluation, the mean intraobserver agreement was good (K = 0.86). The interobserver agreements were also good (reader 1 vs reader 2, k = 0.71; reader 2 vs reader 3, k = 0.78; reader 3 vs reader 1, k = 0.71). There were no statistically significant differences between the results obtained using the 2 methods. FR calculation on MRI is feasible, and it may be used in adjunct to standard MRI evaluation in peripheral nerve disorders.
Conflict of interest statement
The authors have no conflicts of interest to disclose.
Figures
References
-
- Bäumer P, Reimann M, Decker C, et al. Peripheral nerve perfusion by dynamic contrast-enhanced magnetic resonance imaging: demonstration of feasibility. Invest Radiol. 2014;49:518–523. - PubMed
-
- Bäumer P, Dombert T, Staub F, et al. Ulnar neuropathy at the elbow: MR neurography–nerve T2 signal increase and caliber. Radiology. 2011;260:199–206. - PubMed
-
- Chalian M, Soldatos T, Faridian-Aragh N, et al. 3T magnetic resonance neurography of tibial nerve pathologies. J Neuroimaging. 2013;23:296–310. - PubMed
-
- Tagliafico A, Succio G, Serafini G, et al. Diagnostic accuracy of MRI in adults with suspect brachial plexus lesions: a multicentre retrospective study with surgical findings and clinical follow-up as reference standard. Eur J Radiol. 2012;81:2666–2672. - PubMed
-
- Beeckman R, Schoemaker MC, Van der Plas JP, et al. Diagnostic value of high-resolution sonography in ulnar neuropathy at the elbow. Neurology. 2004;62:767–773. - PubMed
Publication types
MeSH terms
LinkOut - more resources
Full Text Sources
Other Literature Sources
Medical
