. 2014 Sep 25;8(9):e3194.
doi: 10.1371/journal.pntd.0003194. eCollection 2014 Sep.

Cathepsin B in antigen-presenting cells controls mediators of the Th1 immune response during Leishmania major infection

Affiliations

Cathepsin B in antigen-presenting cells controls mediators of the Th1 immune response during Leishmania major infection

Iris J Gonzalez-Leal et al. PLoS Negl Trop Dis. .

Abstract

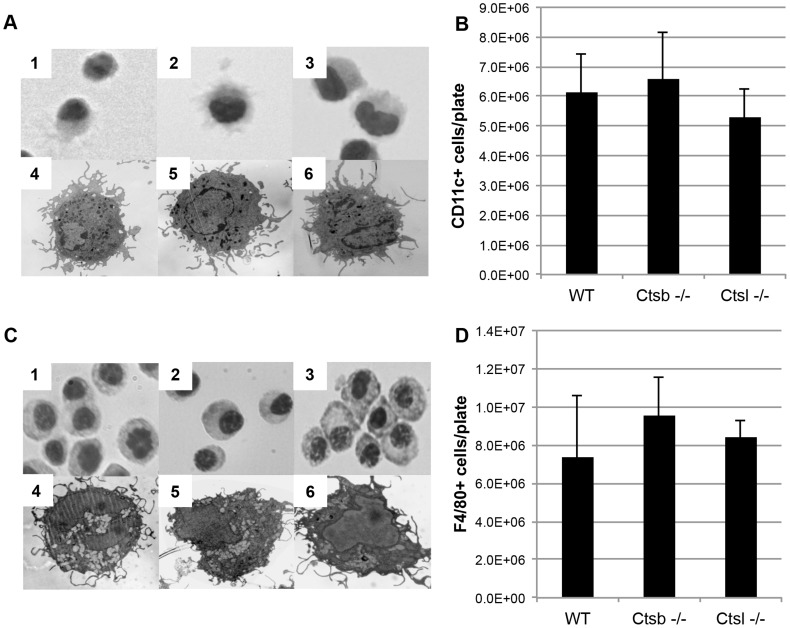
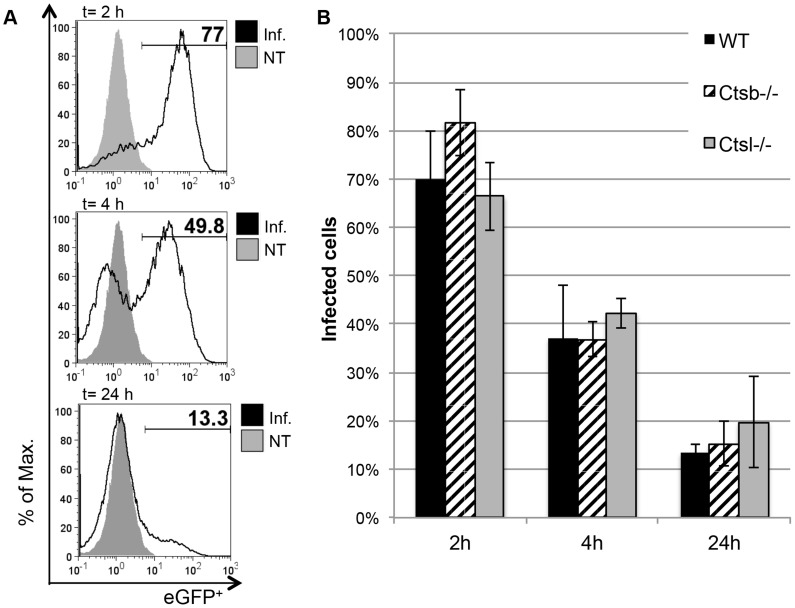
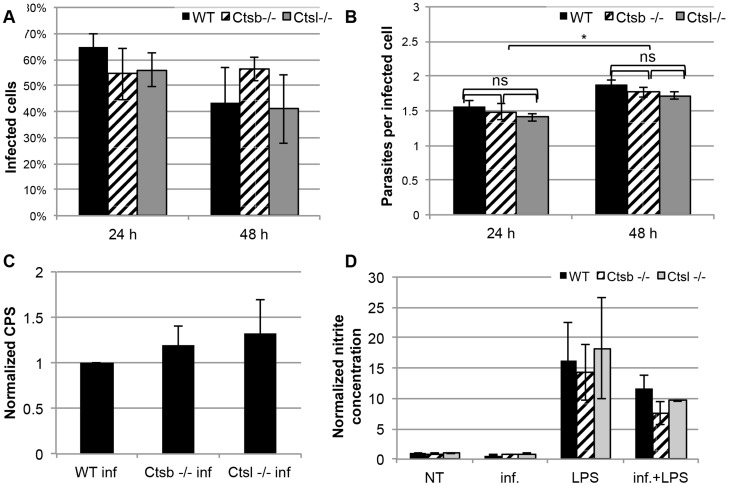
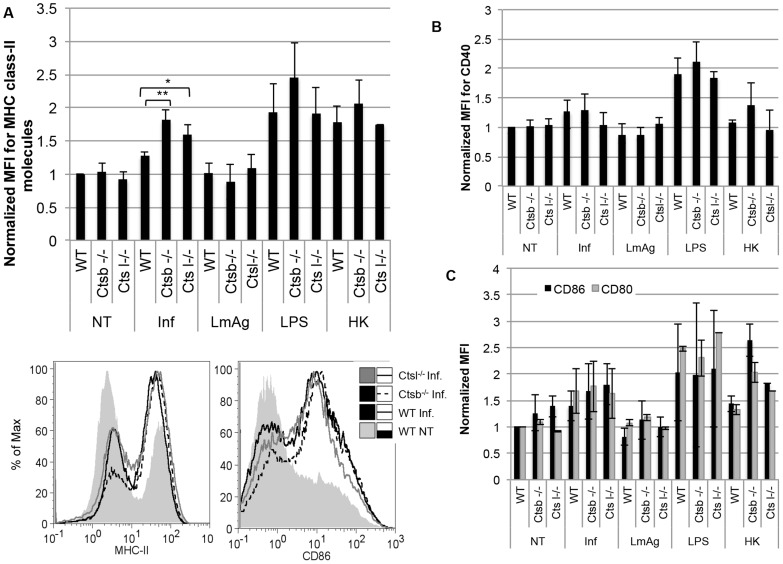
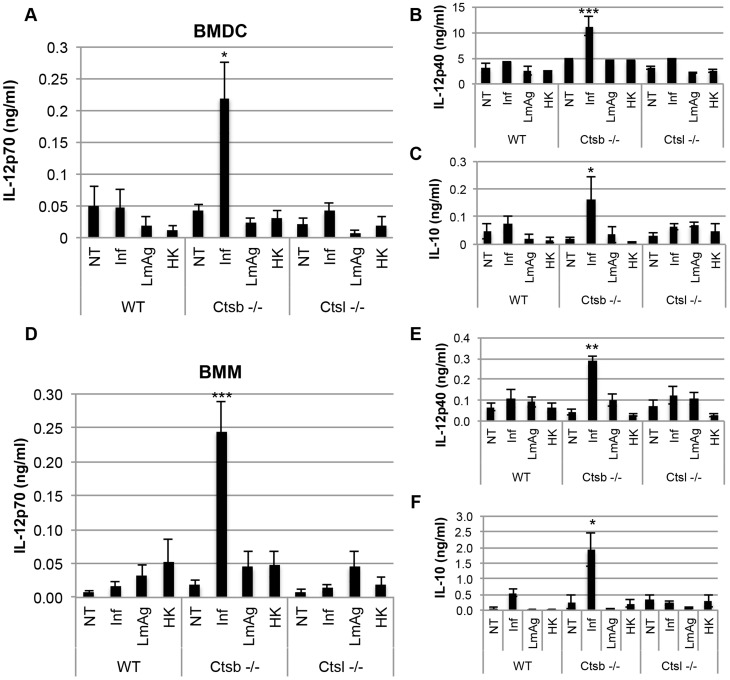
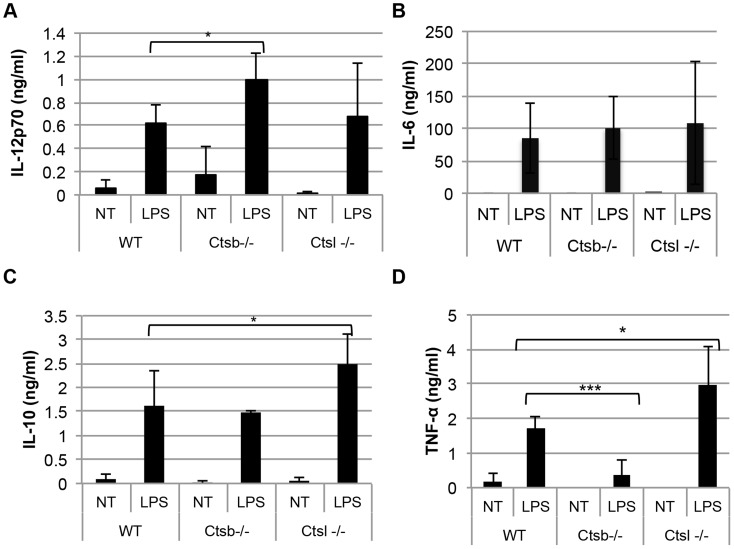
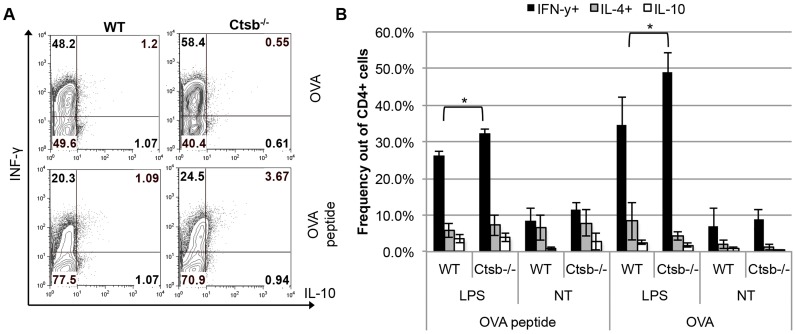
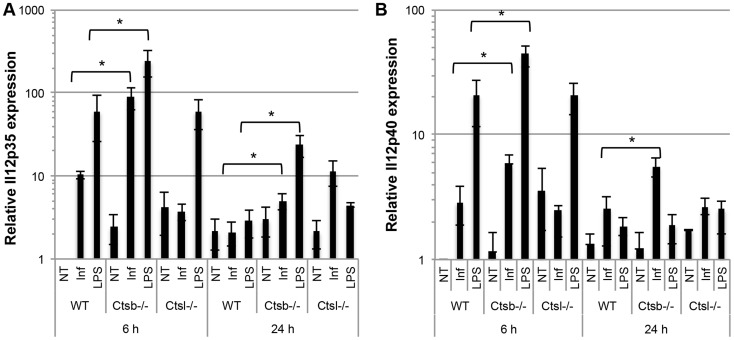
Resistance and susceptibility to Leishmania major infection in the murine model is determined by the capacity of the host to mount either a protective Th1 response or a Th2 response associated with disease progression. Previous reports involving the use of cysteine cathepsin inhibitors indicated that cathepsins B (Ctsb) and L (Ctsl) play important roles in Th1/Th2 polarization during L. major infection in both susceptible and resistant mouse strains. Although it was hypothesized that these effects are a consequence of differential patterns of antigen processing, the mechanisms underlying these differences were not further investigated. Given the pivotal roles that dendritic cells and macrophages play during Leishmania infection, we generated bone-marrow derived dendritic cells (BMDC) and macrophages (BMM) from Ctsb-/- and Ctsl-/- mice, and studied the effects of Ctsb and Ctsl deficiency on the survival of L. major in infected cells. Furthermore, the signals used by dendritic cells to instruct Th cell polarization were addressed: the expression of MHC class II and co-stimulatory molecules, and cytokine production. We found that Ctsb-/- BMDC express higher levels of MHC class II molecules than wild-type (WT) and Ctsl-/- BMDC, while there were no significant differences in the expression of co-stimulatory molecules between cathepsin-deficient and WT cells. Moreover, both BMDC and BMM from Ctsb-/- mice significantly up-regulated the levels of interleukin 12 (IL-12) expression, a key Th1-inducing cytokine. These findings indicate that Ctsb-/- BMDC display more pro-Th1 properties than their WT and Ctsl-/- counterparts, and therefore suggest that Ctsb down-regulates the Th1 response to L. major. Moreover, they propose a novel role for Ctsb as a regulator of cytokine expression.


Conflict of interest statement

The authors have declared that no competing interests exist.

Figures

Figure 1
Figure 1. Comparable yields and phenotypes of BMDC and BMM generated from cathepsin B- and cathepsin L-deficient mice.
BMDC from Ctsb−/− and Ctsl−/− mice present similar morphologies as WT BMDC. (A) Light microscopy pictures, using 40× magnification, of BMDC stained with Diff-Quik, 1: WT, 2: Ctsb−/−, 3: Ctsl−/−, and TEM pictures of BMDC, using a 4400× magnification, 4: WT, 5: Ctsb−/−, 6: Ctsl−/−. (B) No significant differences in the amount of CD11c+ cells generated per plate were found in Ctsb−/− and Ctsl−/− mice in comparison with WT mice. The results are expressed as mean ± SD of cells recovered per plate from 3 animals. (C) Similar morphologies found in BMM derived from WT and cathepsin-deficient mice (Diff-Quik staining 1: WT, 2: Ctsb−/−, 3: Ctsl−/−; TEM 4: WT, 5: Ctsb−/− and 6: Ctsl−/−). (D) No significant differences were found in the amount of F4/80+ cells generated per plate from WT, Ctsb−/− and Ctsl−/− mice.
Figure 2
Figure 2. Comparison of L. major promastigote uptake and processing by BMDC from WT and cathepsin-deficient mice.
(A) Representative histograms for WT BMDC (CD11c+-gated) infected for 2 hours with eGFP-tg L. major promastigotes, and further incubated for 4 and 24 hours in fresh medium. The percentage of eGFP+ cells was considered as percentage of remaining infected cells. (B) No significant differences between BMDC from WT and cathepsin-deficient mice were found in the uptake and processing of eGFP-tg promastigotes over the course of 24 hours. The results are expressed as mean ± SD of 3 independent experiments.
Figure 3
Figure 3. L. major promastigotes survive comparably in BMM from cathepsin B- and cathepsin L-deficient mice, and these BMM show similar levels of NO production in response to L. major and LPS.
WT, Ctsb−/− and Ctsl−/− BMM were infected with eGFP-tg L. major promastigotes, and the percentage of infected cells 24 hours post infection (p.i.) and 48 hours p.i. was determined by fluorescence microscopy (A). No statistically significant differences were found in the amounts of infected cells between WT and cathepsin-deficient BMM. (B) As in (A) the number of parasites per infected cells was determined by fluorescence microscopy, and used as an indicator for parasite proliferation. Although no significant differences were found between WT and cathepsin-deficient BMM, each line showed significant differences in the counts of parasites per infected cell between 24 hours and 48 hours p.i. (C) Parasite proliferation determined by luminescence of Luc-tg L. major promastigotes within BMM at 48 hours p.i. Data are shown as counts per second (CPS). (D) NO production in supernatants from BMM 48 hours after infection with L. major and stimulation with LPS. Results are expressed as mean ± SD from 3 independent experiments.
Figure 4
Figure 4. BMDC from cathepsin B-deficient mice express higher levels of MHC class II molecules in comparison with BMDC from cathepsin L-deficient and WT mice, but no differences were observed in the expression of co-stimulatory molecules.
The expression of MHC class II molecules, CD40, CD86 and CD80 was measured by flow cytometry in BMDC in response to infection with L. major promastigotes (Inf), LmAg, heat-killed parasites (HK), or LPS. (A) Average MFI of MHC class II molecules, normalized to non-treated (NT) WT BMDC. (B) Average MFI of CD40, normalized WT NT BMDC. (C) Average MFI of CD80 and CD86, normalized WT NT BMDC. MFI values are expressed as mean ± SD of 4 independent experiments. Statistical significance was assessed between WT BMDC and Ctsb−/− BMDC, and between WT BMDC and Ctsl−/− BMDC for every single treatment, * p<0.05, *** p<0.005.
Figure 5
Figure 5. BMDC and BMM from cathepsin B-deficient mice express higher levels of IL-12 in response to L. major than cells derived from WT and cathepsin L-deficient mice.
(A) IL-12p70 in supernatants from non-treated BMDC(NT), BMDC infected (Inf) with L. major promastigotes at 48 hours p.i., BMDC stimulated with parasite lysate (LmAg), or with heat-killed parasites (HK), for 48 hours. (B) IL-12p40 and (C) IL-10 concentration in supernatants of BMDC at 48 hours p.i., or stimulation with LmAg or HK parasites. (D) IL-12p70 production in supernatants from non-treated BMM (NT), BMM infected (Inf) with L. major promastigotes at 48 hours p.i., and BMM stimulated for 48 hours with LmAg or HK parasites. (E) IL-12p40 and (F) IL-10 concentration in supernatants of BMM at 48 hours p.i., or stimulation with either LmAg or HK parasites. The results are expressed as mean ± SD of 5 independent experiments. For each experimental group (NT, Inf, LmAg and HK), statistical significance was estimated between WT and Ctsb−/− cells, and between WT and Ctsl−/− cells, * p<0.05, **p<0.01, *** p<0.005.
Figure 6
Figure 6. BMDC from cathepsin B-deficient mice express higher levels of IL-12 in response to LPS than cells from WT and cathepsin L-deficient mice.
Concentration of different cytokines in supernatants from non-treated BMDC (NT) or LPS-stimulated BMDC (LPS, 1 µg/ml) after 24 hours: (A) IL-12p70, (B) IL-6, (C) IL-10, and (D) TNF-α. The results are expressed as mean ± SD of 5 independent experiments. The statistical significance in each treatment was assessed between WT and Ctsb−/− BMDC, and between WT and Ctsl−/− BMDC. * p<0.05, **p<0.01, *** p<0.005.
Figure 7
Figure 7. Th1 polarization of OT-II CD4+ naïve T cells by BMDC from WT C57BL/6 and Ctsb−/− mice.
Isolated CD4+ CD25 T cells from OT-II mice were co-cultured with BMDC generated from WT C57BL/6 and Ctsb−/− mice in the presence of LPS as a stimulus and OVA peptide (327–339) or ovalbumin (OVA) as antigens. A) Zebra plots from one representative experiment. B) Average percentages of IFN-γ, IL-4, or IL-10+ CD4+ T cells from 3 independent experiments ± SD. * p<0.05.
Figure 8
Figure 8. IL-12 is up-regulated at the transcriptional level in BMM from cathepsin B-deficient mice in response to L. major infection and LPS stimulation.
Relative expression levels of (A) IL-12p40 and (B) IL-12p35 transcripts in mRNA from BMM at 6 hours or 24 hours p.i. with L. major promastigotes or LPS stimulation. Non-treated (NT) BMM from each mouse line were used as negative controls. The expression levels were estimated using the 2− ΔΔC T method, using WT NT BMM at t = 6 hours as a reference. The results are shown as mean ± SD of 4 independent experiments, * p<0.05.

References

    1. World Health Organization (2010) Control of the leishmaniasis: report of a meeting of the WHO Expert Commitee on the Control of Leishmaniases. Geneva: World Health Organization 949: : 949.
    1. World Health Organization (2012) Leishmaniasis: worldwide epidemiological and drug access update. WHO. Available: http://www.who.int/leishmaniasis/resources/Leishmaniasis_worldwide_epide....
    1. Mitchell GF, Anders RF, Brown GV, Handman E, Roberts-Thomson IC, et al. (1982) Analysis of infection characteristics and antiparasite immune responses in resistant compared with susceptible hosts. Immunol Rev 61: 137–188. - PubMed
    1. Stebut von E (2007) Immunology of cutaneous leishmaniasis: the role of mast cells, phagocytes and dendritic cells for protective immunity. Eur J Dermatol 17: 115–122. - PubMed
    1. Moll H, Fuchs H, Blank C, Röllinghoff M (1993) Langerhans cells transport Leishmania major from the infected skin to the draining lymph node for presentation to antigen-specific T cells. Eur J Immunol 23: 1595–1601. - PubMed

Publication types