

MIF contributes to Trypanosoma brucei associated immunopathogenicity development
- PMID: 25255103
- PMCID: PMC4177988
- DOI: 10.1371/journal.ppat.1004414
MIF contributes to Trypanosoma brucei associated immunopathogenicity development
Abstract
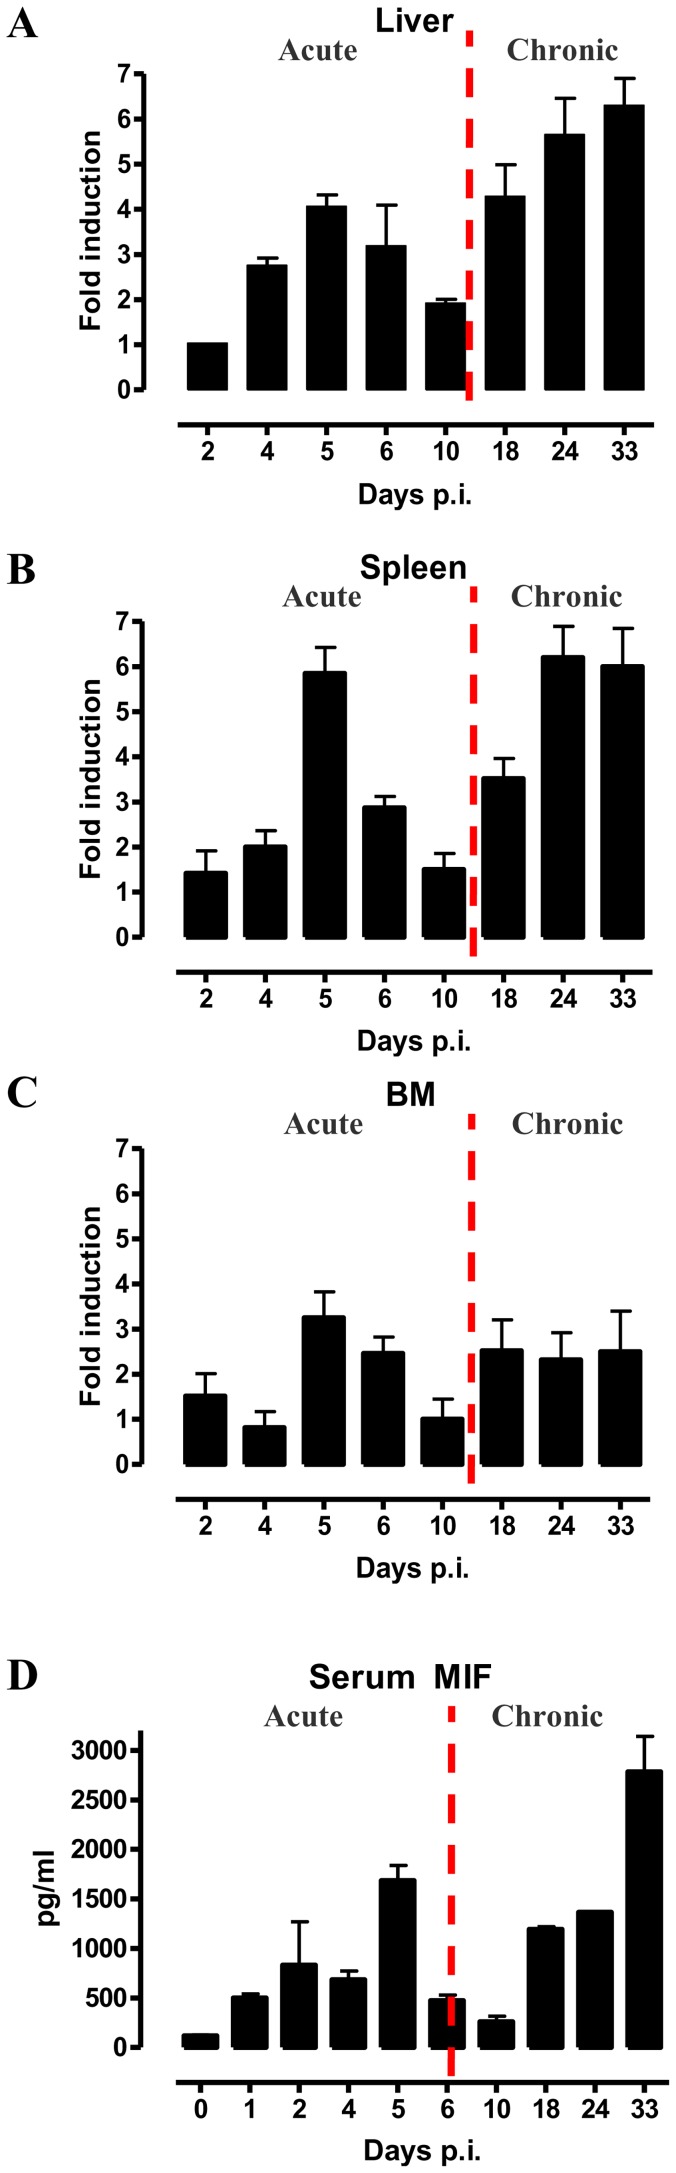
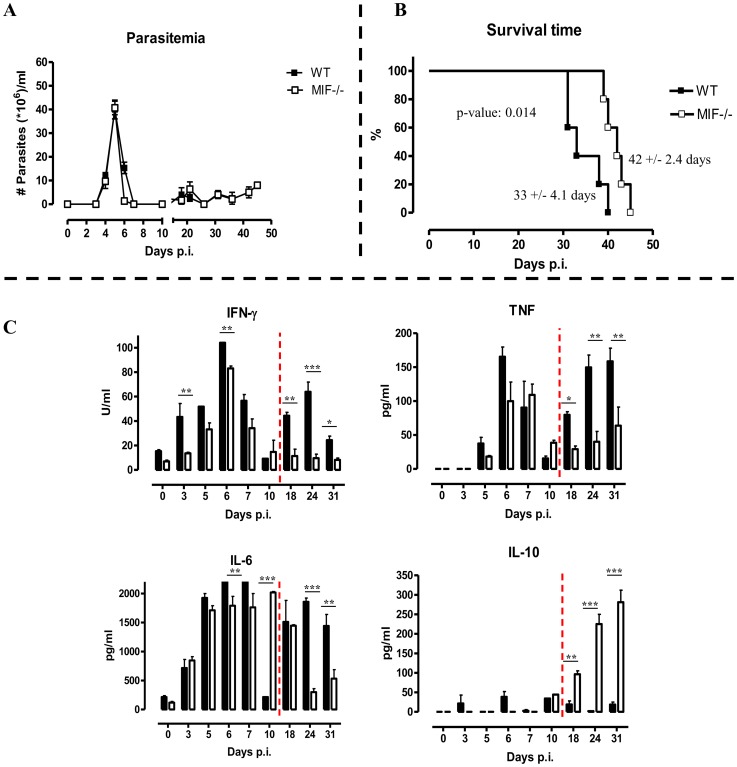
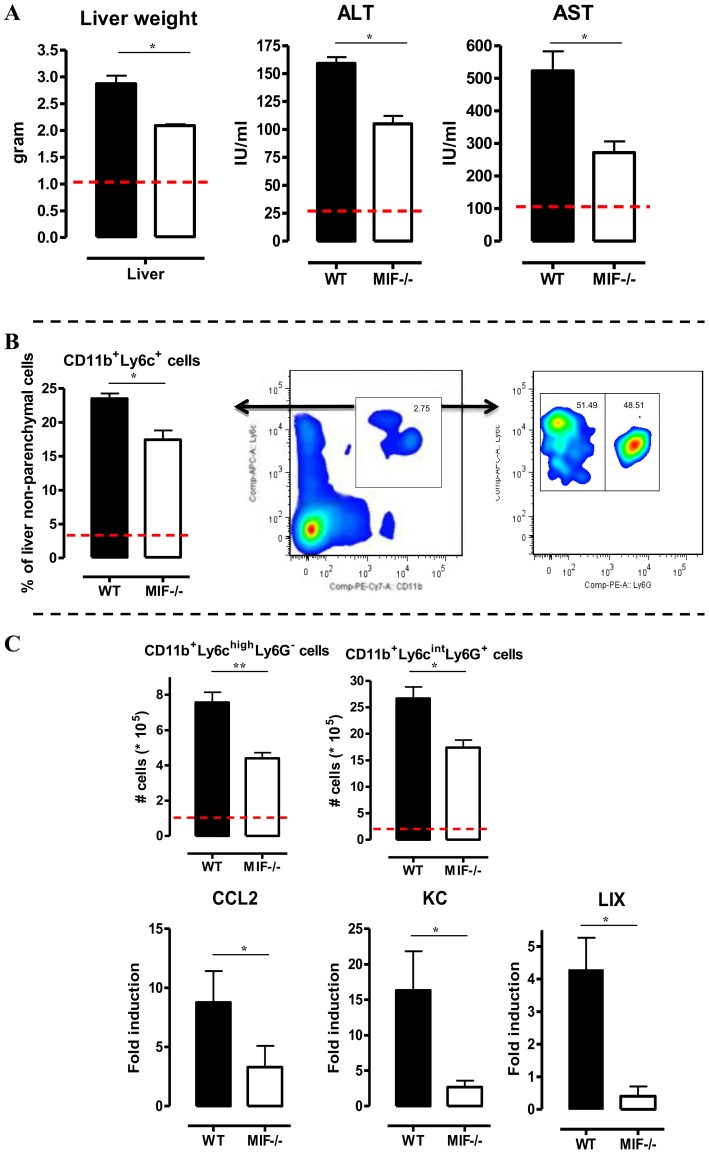
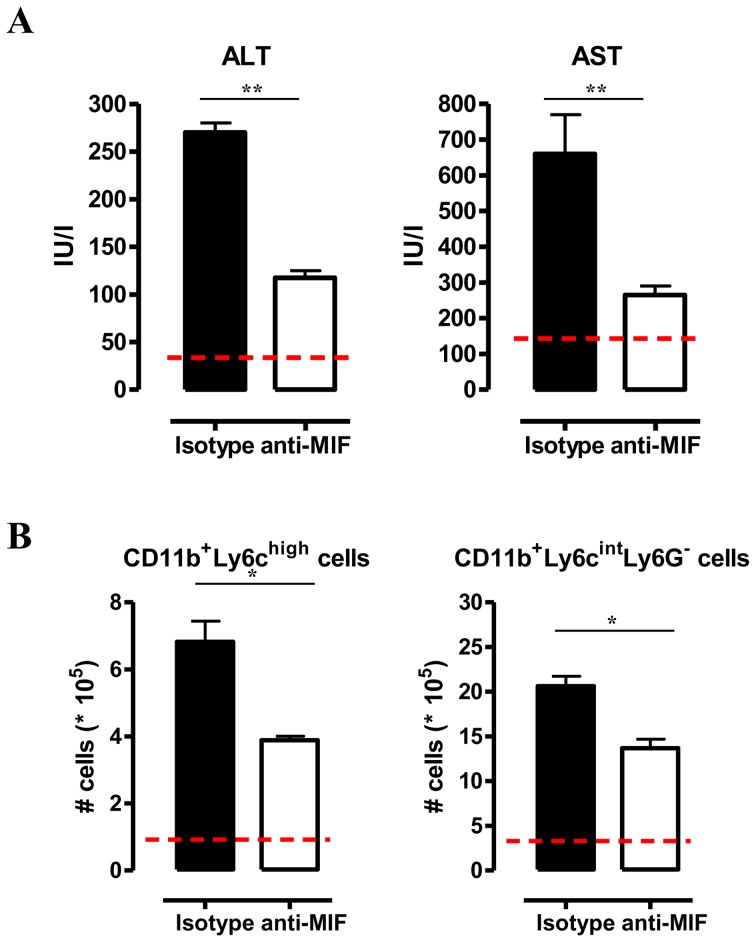
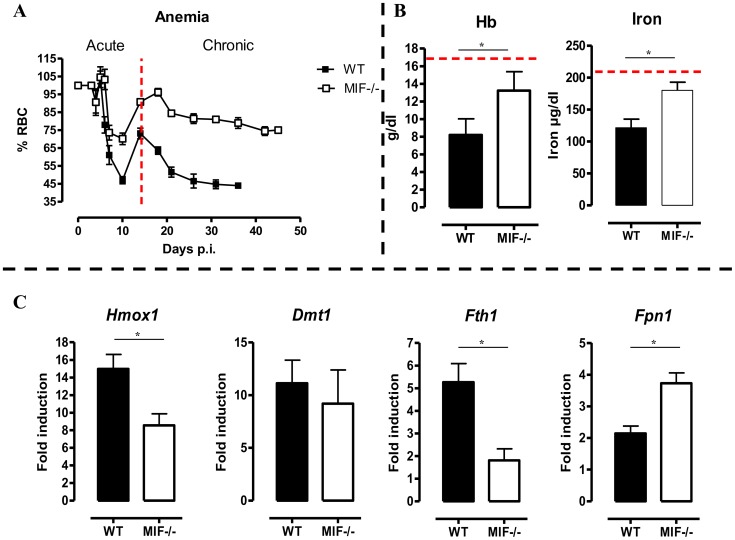
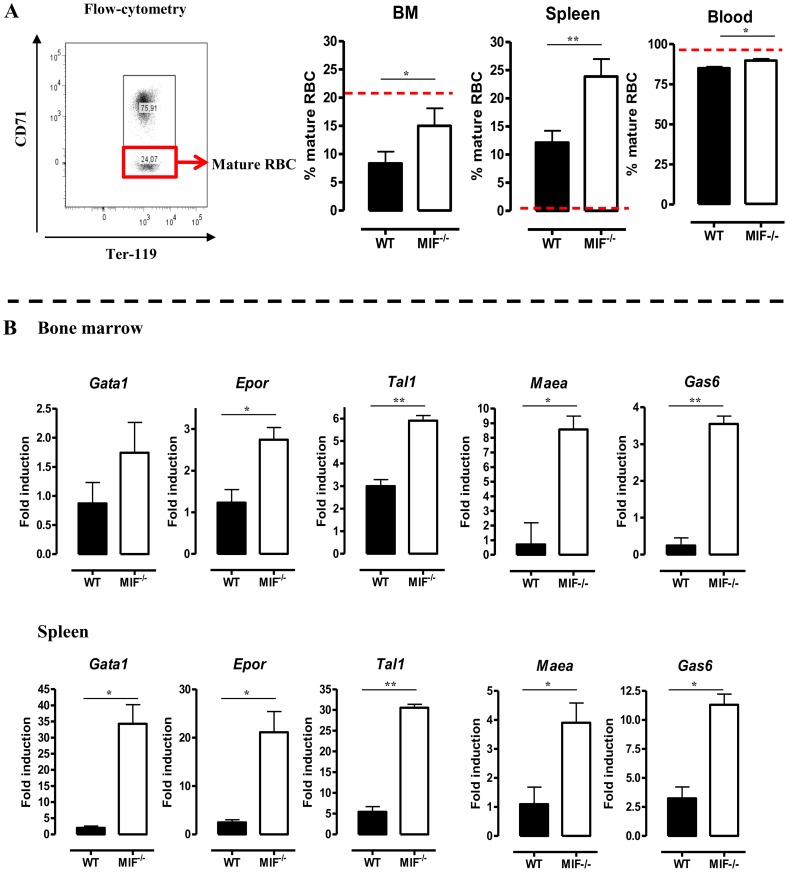
African trypanosomiasis is a chronic debilitating disease affecting the health and economic well-being of many people in developing countries. The pathogenicity associated with this disease involves a persistent inflammatory response, whereby M1-type myeloid cells, including Ly6C(high) inflammatory monocytes, are centrally implicated. A comparative gene analysis between trypanosusceptible and trypanotolerant animals identified MIF (macrophage migrating inhibitory factor) as an important pathogenic candidate molecule. Using MIF-deficient mice and anti-MIF antibody treated mice, we show that MIF mediates the pathogenic inflammatory immune response and increases the recruitment of inflammatory monocytes and neutrophils to contribute to liver injury in Trypanosoma brucei infected mice. Moreover, neutrophil-derived MIF contributed more significantly than monocyte-derived MIF to increased pathogenic liver TNF production and liver injury during trypanosome infection. MIF deficient animals also featured limited anemia, coinciding with increased iron bio-availability, improved erythropoiesis and reduced RBC clearance during the chronic phase of infection. Our data suggest that MIF promotes the most prominent pathological features of experimental trypanosome infections (i.e. anemia and liver injury), and prompt considering MIF as a novel target for treatment of trypanosomiasis-associated immunopathogenicity.
Conflict of interest statement
The authors have declared that no competing interests exist.
Figures


Similar articles
-
MIF-Mediated Hemodilution Promotes Pathogenic Anemia in Experimental African Trypanosomosis.PLoS Pathog. 2016 Sep 15;12(9):e1005862. doi: 10.1371/journal.ppat.1005862. eCollection 2016 Sep. PLoS Pathog. 2016. PMID: 27632207 Free PMC article.
-
Ly6C- Monocytes Regulate Parasite-Induced Liver Inflammation by Inducing the Differentiation of Pathogenic Ly6C+ Monocytes into Macrophages.PLoS Pathog. 2015 May 28;11(5):e1004873. doi: 10.1371/journal.ppat.1004873. eCollection 2015 May. PLoS Pathog. 2015. PMID: 26020782 Free PMC article.
-
Iron Homeostasis and Trypanosoma brucei Associated Immunopathogenicity Development: A Battle/Quest for Iron.Biomed Res Int. 2015;2015:819389. doi: 10.1155/2015/819389. Epub 2015 May 18. Biomed Res Int. 2015. PMID: 26090446 Free PMC article. Review.
-
African Trypanosomiasis-Associated Anemia: The Contribution of the Interplay between Parasites and the Mononuclear Phagocyte System.Front Immunol. 2018 Feb 15;9:218. doi: 10.3389/fimmu.2018.00218. eCollection 2018. Front Immunol. 2018. PMID: 29497418 Free PMC article. Review.
-
Differential effects of Trypanosoma brucei gambiense and Trypanosoma brucei brucei on rat macrophages.J Parasitol. 2011 Feb;97(1):48-54. doi: 10.1645/GE-2466.1. Epub 2010 Aug 27. J Parasitol. 2011. PMID: 21348606
Cited by
-
Candidate gene polymorphisms study between human African trypanosomiasis clinical phenotypes in Guinea.PLoS Negl Trop Dis. 2017 Aug 21;11(8):e0005833. doi: 10.1371/journal.pntd.0005833. eCollection 2017 Aug. PLoS Negl Trop Dis. 2017. PMID: 28827791 Free PMC article.
-
Macrophage miR-210 induction and metabolic reprogramming in response to pathogen interaction boost life-threatening inflammation.Sci Adv. 2021 May 7;7(19):eabf0466. doi: 10.1126/sciadv.abf0466. Print 2021 May. Sci Adv. 2021. PMID: 33962944 Free PMC article.
-
No evidence for association between APOL1 kidney disease risk alleles and Human African Trypanosomiasis in two Ugandan populations.PLoS Negl Trop Dis. 2018 Feb 22;12(2):e0006300. doi: 10.1371/journal.pntd.0006300. eCollection 2018 Feb. PLoS Negl Trop Dis. 2018. PMID: 29470556 Free PMC article.
-
MIF-Mediated Hemodilution Promotes Pathogenic Anemia in Experimental African Trypanosomosis.PLoS Pathog. 2016 Sep 15;12(9):e1005862. doi: 10.1371/journal.ppat.1005862. eCollection 2016 Sep. PLoS Pathog. 2016. PMID: 27632207 Free PMC article.
-
Trypanosoma brucei brucei Induced Hypoglycaemia Depletes Hepatic Glycogen and Altered Hepatic Hexokinase and Glucokinase Activities in Infected Mice.Acta Parasitol. 2022 Sep;67(3):1097-1106. doi: 10.1007/s11686-022-00550-4. Epub 2022 Apr 27. Acta Parasitol. 2022. PMID: 35476260
References
-
- Barrett MP, Burchmore RJ, Stich A, Lazzari JO, Frasch AC, et al. (2003) The trypanosomiases. Lancet 362: 1469–1480. - PubMed
-
- d'Ieteren GD, Authie E, Wissocq N, Murray M (1998) Trypanotolerance, an option for sustainable livestock production in areas at risk from trypanosomosis. Rev Sci Tech 17: 154–175. - PubMed
-
- Stijlemans B, Vankrunkelsven A, Caljon G, Bockstal V, Guilliams M, et al. (2010) The central role of macrophages in trypanosomiasis-associated anemia: rationale for therapeutical approaches. Endocr Metab Immune Disord Drug Targets 10: 71–82. - PubMed
-
- Naessens J (2006) Bovine trypanotolerance: A natural ability to prevent severe anaemia and haemophagocytic syndrome? Int J Parasitol 36: 521–528. - PubMed
-
- Stijlemans B, Vankrunkelsven A, Brys L, Magez S, De Baetselier P (2008) Role of iron homeostasis in trypanosomiasis-associated anemia. Immunobiology 213: 823–835. - PubMed
Publication types
MeSH terms
Substances
Grants and funding
LinkOut - more resources
Full Text Sources
Other Literature Sources
Medical
Molecular Biology Databases
Miscellaneous
