

Memory and fitness optimization of bacteria under fluctuating environments
- PMID: 25255314
- PMCID: PMC4177670
- DOI: 10.1371/journal.pgen.1004556
Memory and fitness optimization of bacteria under fluctuating environments
Erratum in
- PLoS Genet. 2014 Oct;10(10):e1004793. Kussel, Edo [corrected to Kussell, Edo]
Abstract
Bacteria prudently regulate their metabolic phenotypes by sensing the availability of specific nutrients, expressing the required genes for their metabolism, and repressing them after specific metabolites are depleted. It is unclear, however, how genetic networks maintain and transmit phenotypic states between generations under rapidly fluctuating environments. By subjecting bacteria to fluctuating carbon sources (glucose and lactose) using microfluidics, we discover two types of non-genetic memory in Escherichia coli and analyze their benefits. First, phenotypic memory conferred by transmission of stable intracellular lac proteins dramatically reduces lag phases under cyclical fluctuations with intermediate timescales (1-10 generations). Second, response memory, a hysteretic behavior in which gene expression persists after removal of its external inducer, enhances adaptation when environments fluctuate over short timescales (< 1 generation). Using a mathematical model we analyze the benefits of memory across environmental fluctuation timescales. We show that memory mechanisms provide an important class of survival strategies in biology that improve long-term fitness under fluctuating environments. These results can be used to understand how organisms adapt to fluctuating levels of nutrients, antibiotics, and other environmental stresses.
Conflict of interest statement
The authors have declared that no competing interests exist.
Figures
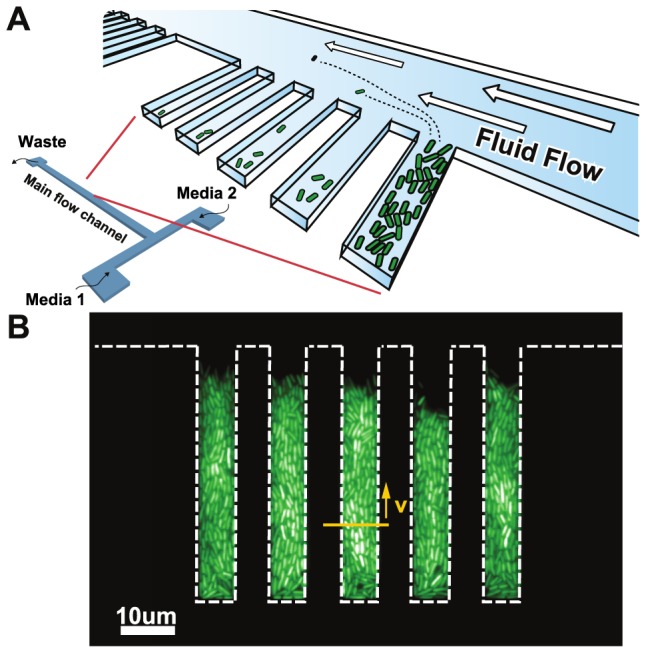
 of cells 15 microns away from the closed end of the growth chamber (yellow arrow).
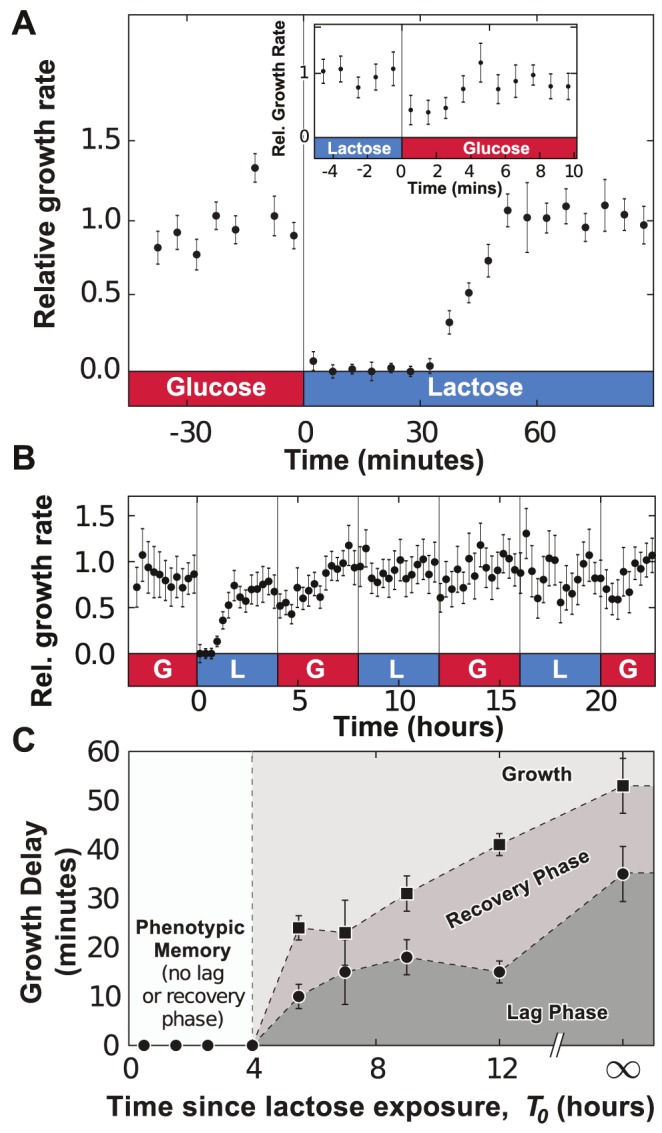
 , data binned over 15-minute intervals), cells remember previous lac induction and do not enter a lag phase when lactose is reintroduced. C) The duration of the lag (bullets) and lag+recovery phases (black squares) for lac-induced cells depends on the amount of time between lactose exposures. Error bars are computed from the standard error of the regression parameters used to measure the lag+recovery times.
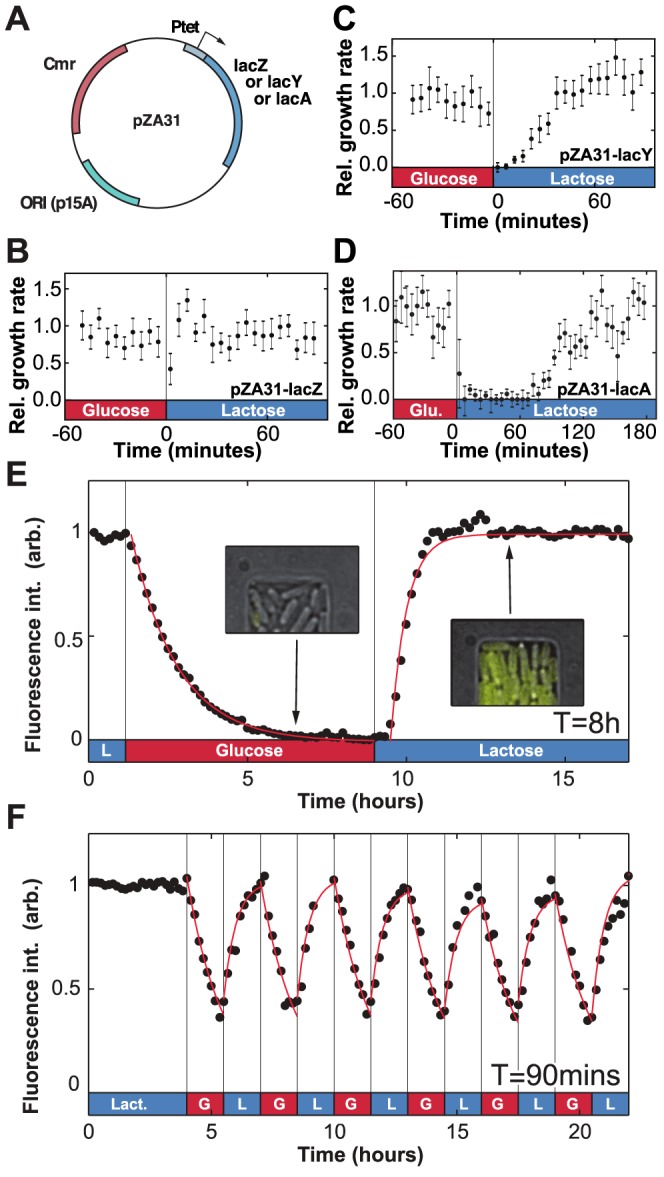
 , where
  ; induction was fit to the form
  for
for  , where
  and
and  minutes. Red lines in panel F are a plot of the fit found from panel E, starting at each period from the measured initial values.
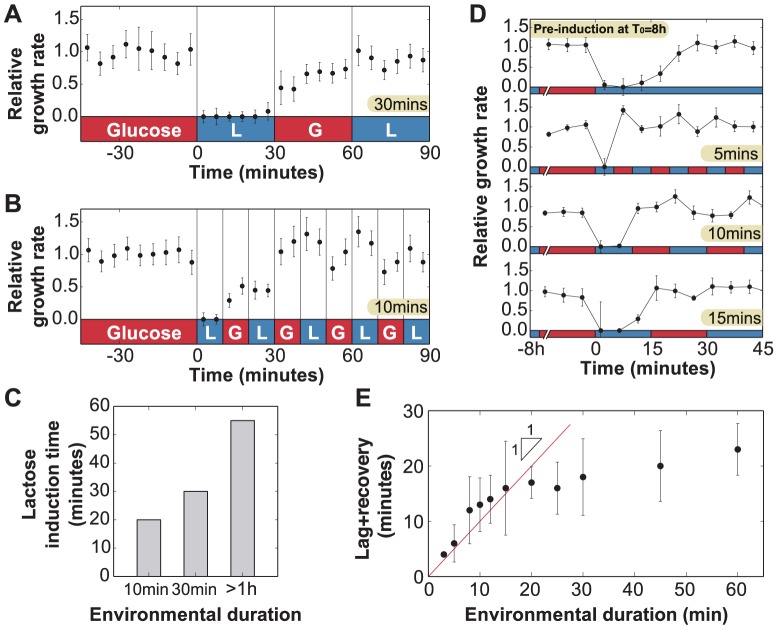
 ) enter a lag phase following the first exposure to lactose only. No lag phase is measured at t = 60 minutes, indicating that cells are fully induced when lactose is reintroduced. B) Similarly, when the environmental duration is 10 minutes, cells only spend the first lactose exposure in a lag phase (N = 5 GCs, error bars = SEM). C) Amount of time uninduced cells were exposed to lactose conditions before reaching complete growth recovery. Under environmental durations T = 10 and 30 minutes, cells recover following 20 and 30 minutes of lactose exposure, respectively, compared with the 55 minutes necessary when the environmental duration
  . D) Cells pre-induced at
  have a 25 minutes lag+recovery phase (N = 5 GCs, error bars = SEM). Exposure to rapidly fluctuating glucose/lactose conditions increases adaptation rate, and cells are able to recover after only one exposure to lactose for environmental durations T = 5, 10 and 15 minutes. E) Measured lag+recovery times for
  pre-induced cells exposed to fluctuating conditions with an environmental duration T = 3-60 minutes. Error bars = standard error obtained from lag+recovery regression parameters. All datapoints from T = 3–15 minutes indicate that cells recover shortly after glucose is reintroduced (red line indicates cases where the lag+recovery times and T are equal), demonstrating that cells are able to fully grow on lactose after a single exposure to lactose conditions.
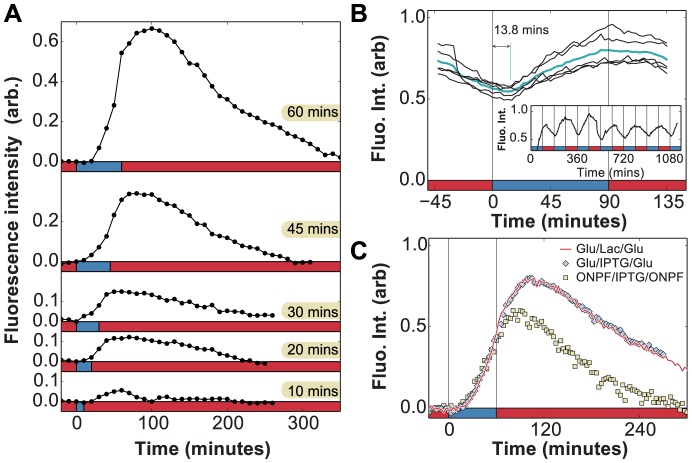
 of glucose between induction events (x-axis: red = glucose, blue = lactose). B) Measurement of phase difference between the glucose/lactose environment and expression level (cyan line = average over 5 periods) due to LacY-Venus protein production and maturation times. Measurements from a long experiment in a
  periodic environment (inset) are superimposed onto a single period. The LacY-Venus reporter delay lasts 13.8 minutes on average (x-axis: red = glucose, blue = lactose). C) Induction by either 60 minutes of 0.4% lactose (red line, x-axis: red = glucose, blue = lactose) or 1 mM IPTG (blue diamonds, x-axis: red = glucose, blue = glucose + 1 mM IPTG) leads to similar lac induction profiles. The anti-inducer ONPF decreases the duration of response memory, causing lac levels to peak only 20 minutes after inducer removal (yellow squares, x-axis: red = glucose + 1 mM ONPF, blue = glucose + 1 mM IPTG).
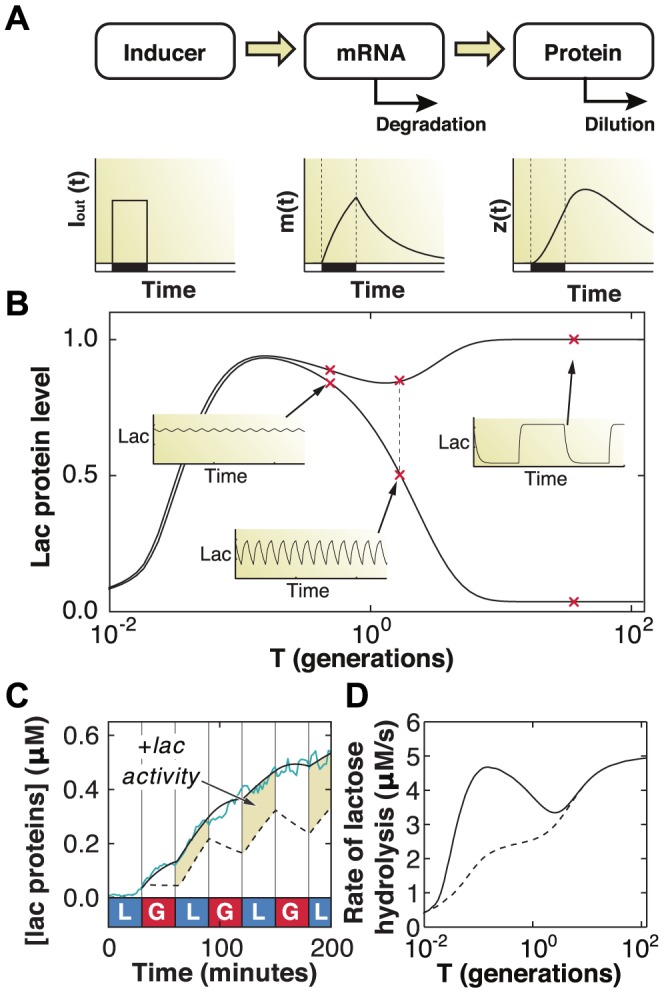
 ), mRNA (
 ), and protein (
 ). B) The maximum and minimum (top and bottom dashed curves, respectively) lac protein concentrations depend on the environmental duration
  , shown in units of generation time (1 generation = 60 minutes). A few representative examples of how lac levels evolve under fluctuating conditions are shown in the insets. C) A difference in lac expression levels is observed for models with (solid line) and without (dashed line) response memory. The model that includes response memory correctly predicts the experimentally measured IPTG induction dynamics (cyan line). Response memory leads to increased intracellular LacZ levels and higher catabolic activity. D) The lactose hydrolyzed per unit time at equilibrium during a complete glucose/lactose cycle (
 ) is compared between the two models (dashed line: no response memory; solid line: response memory). Cells making use of response memory consume up to 100% more lactose under rapid fluctuations.
References
-
- Monod J (1942) Recherches sur la croissance des cultures bactériennes. Paris: Hermann & cie.
-
- Monod J (1949) The growth of bacterial cultures. Annu Rev Microbiol 3: 371–394.
-
- Dekel E, Alon U (2005) Optimality and evolutionary tuning of the expression level of a protein. Nature 436: 588–592. - PubMed
-
- Magasanik B (1961) Catabolite repression. Cold Spring Harb Sym 26: 249–256. - PubMed
-
- Gorke B, Stulke J (2008) Carbon catabolite repression in bacteria: many ways to make the most out of nutrients. Nat Rev Microbiol 6: 613–624. - PubMed
Publication types
MeSH terms
Associated data
Grants and funding
LinkOut - more resources
Full Text Sources
Other Literature Sources
