

Clique of functional hubs orchestrates population bursts in developmentally regulated neural networks
- PMID: 25255443
- PMCID: PMC4177675
- DOI: 10.1371/journal.pcbi.1003823
Clique of functional hubs orchestrates population bursts in developmentally regulated neural networks
Abstract
It has recently been discovered that single neuron stimulation can impact network dynamics in immature and adult neuronal circuits. Here we report a novel mechanism which can explain in neuronal circuits, at an early stage of development, the peculiar role played by a few specific neurons in promoting/arresting the population activity. For this purpose, we consider a standard neuronal network model, with short-term synaptic plasticity, whose population activity is characterized by bursting behavior. The addition of developmentally inspired constraints and correlations in the distribution of the neuronal connectivities and excitabilities leads to the emergence of functional hub neurons, whose stimulation/deletion is critical for the network activity. Functional hubs form a clique, where a precise sequential activation of the neurons is essential to ignite collective events without any need for a specific topological architecture. Unsupervised time-lagged firings of supra-threshold cells, in connection with coordinated entrainments of near-threshold neurons, are the key ingredients to orchestrate population activity.
Conflict of interest statement
The authors have declared that no competing interests exist.
Figures
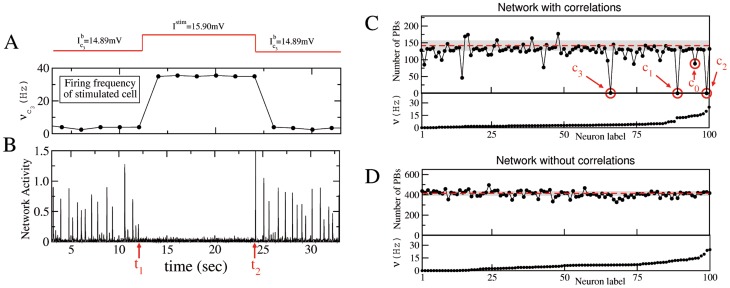
 is stimulated with a DC step for a time interval
  (as shown by the red line on the top panel). Average firing rate of neuron
  (A) and network activity (B) as measured during the experiment. (C) and (D) refer to correlated and uncorrelated networks, respectively. Upper panels display the number of population bursts, PBs, delivered during SNS experiments versus the stimulated neuron, ordered accordingly to their average firing rates
  under control conditions (bottom panels). Each neuron
  was stimulated with a DC step (switching its excitability from
  to
to  ) for an interval
  s. The critical neurons are signaled by red circles. The number of PBs, emitted in control conditions within an interval
  s, are also displayed: red dashed lines indicate their averages, while the shaded gray areas correspond to three standard deviations. The data refer to
  mV and
  neurons.
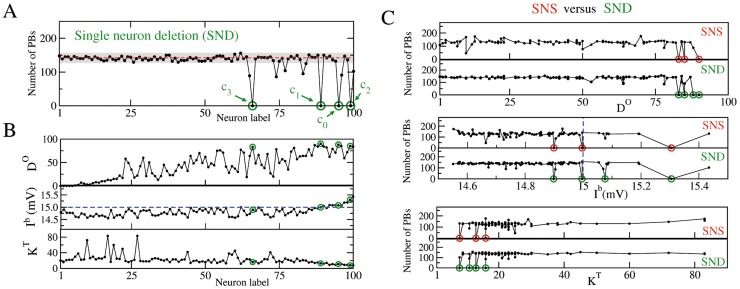
 , intrinsic excitability
  , and total structural connectivity
  . The red dashed line and the gray shaded area in (A) as well as the neuron labels are as in Fig. 1 C, the blue dashed line denotes
  mV. (C) Comparison between SNS and SND: the number of PBs occurring during SNS (resp. SND) is reported as a function of
  ,
,  and
and  . In all panels the green (red) circles mark the critical neurons, which under SND (SNS) can silence the bursting activity of the network. The bursting activity is recorded over an interval
  s.
s.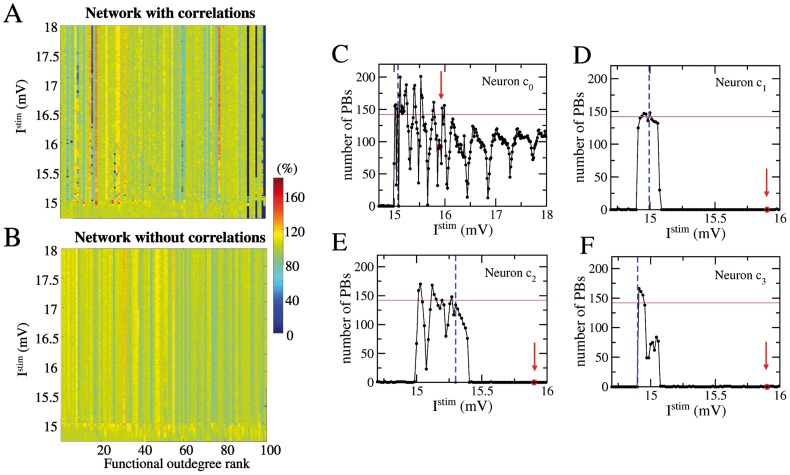
 (y-axis) in networks with correlations of type T1 plus T2 (A) and without any correlations (B). The neurons are ordered according to their functional out-degree rank (x-axis) and the PB rates during SNS are normalized to the PB rate in control conditions. (C–F) Number of PBs emitted during SNS of the critical neurons
  ,
, ,
, ,
,  versus the stimulation current
  . The red arrows indicate
  employed for the SNS experiments in Fig. 1 C. The blue vertical dashed lines mark the value of the intrinsic excitability and the horizontal magenta solid line the bursting activity of the network, both measured at rest. The number of PBs are measured over a time interval
  84 s.
84 s.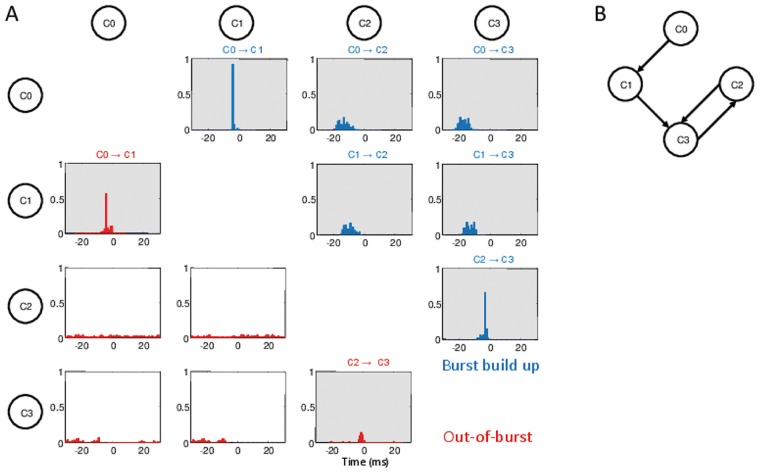
 ) between the spike trains of two critical neurons.
  has been measured as the position of the maximum of the cross correlation between the time series of the two considered neurons. The panels refer to all the possible pair combinations of the critical neurons, furthermore blue (red) histograms refer to the analysis performed during the population burst build up (during periods out of the bursting activity). For more details see the subsection Functional Connectivity in Methods. The order of activation of each pair is reported on the top of the corresponding panel, whenever the cross-correlation has a significant maximum at some finite time
  . Note that during the PB onset, neurons activate reliably in the following order
  . During the out-of-burst activity, clear time-lagged activations are present only among the pairs
  -
- and
and  -
- . (B) Structural connections among the four critical neurons: the black arrows denote the directed connections. The data here reported, as well in all the following figures, refer to a network with correlations of type T1 plus T2.
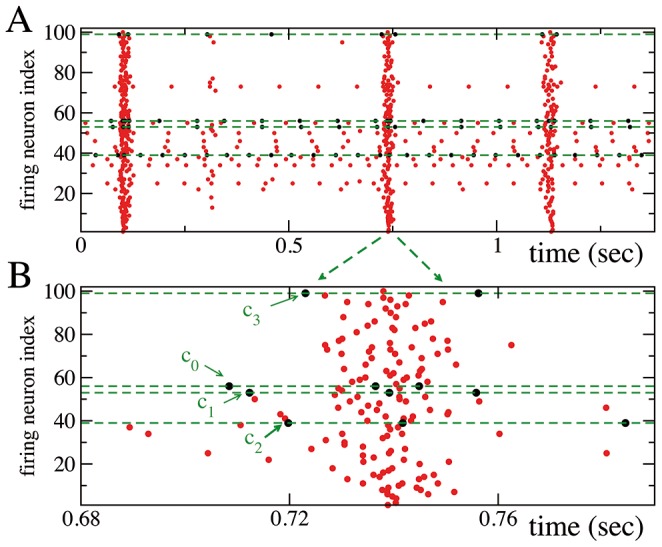
 . For clarity reasons, in the raster plots, at variance with all the other figures, the neuronal labels are not ordered accordingly to their firing rates.
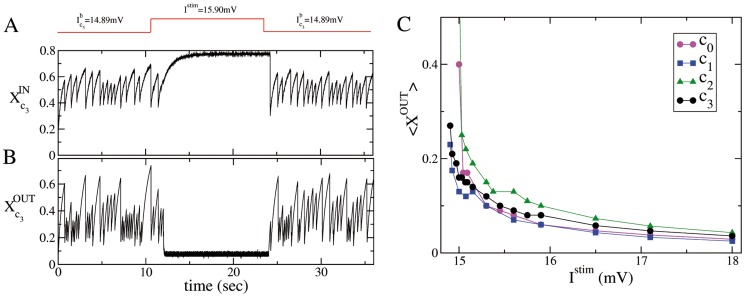
 during SNS with
  mV (these data corresponds to the experiment reported in Fig. 1). The output (input) effective synaptic strength is measured in terms of the average value of the fraction
  (
( ) of the synaptic transmitters in the recovered state associated to the efferent (afferent) synapses (see Methods). (C) Time averaged synaptic strengths
  as measured during SNS experiments performed on each of the four critical neurons for various stimulation currents
  . The legend clarifies to which neuron corresponds the average synaptic strengths displayed in the figure, the averages have been performed over 84 s.
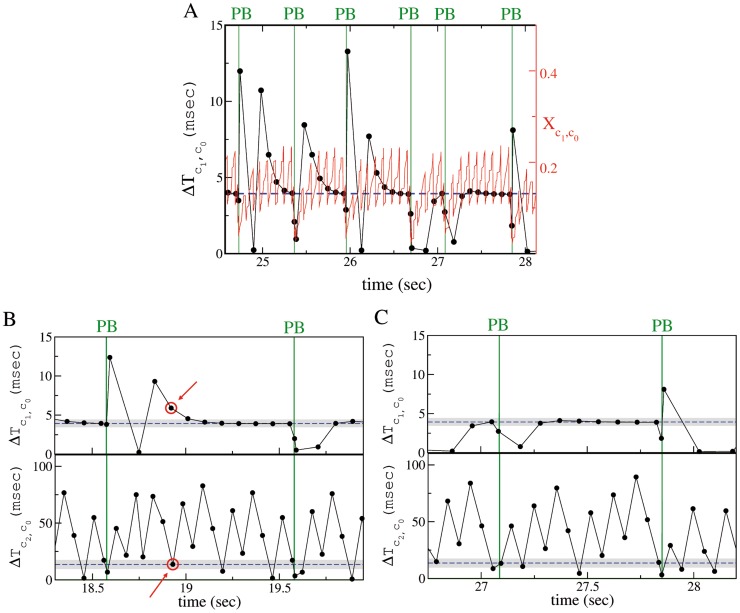
 (red solid line and right y-axis) and of the firing time delay
  (black line with dots and left y-axis). (B),(C) Failures and successes in population burst ignition. Spike time delay
  (top panel) and
  (bottom panel) of neuron
  and
and  , respectively, referred to the last firing time of
  . Panels (B) and (C) clearly show that PBs (denoted by green vertical lines) can occur only when the neuron
  and
and  fire within precise time windows after the firing of neuron
  . In (B) a clear failure is indicated by red circles, in this case
  fired at the right time, but
  was too slow; in (C) neuron
  fires at the right moment several times (black dots are within the gray shaded area in the top panel), but the avalanche is not initiated until
  does not emit a spike within a precise time interval after the firing of
  . In all the figures, the data refer to control conditions. The blue horizontal dashed lines refer to the average value of
  or
or  at the PB onset, while the shaded gray areas indicate the corresponding standard deviations.
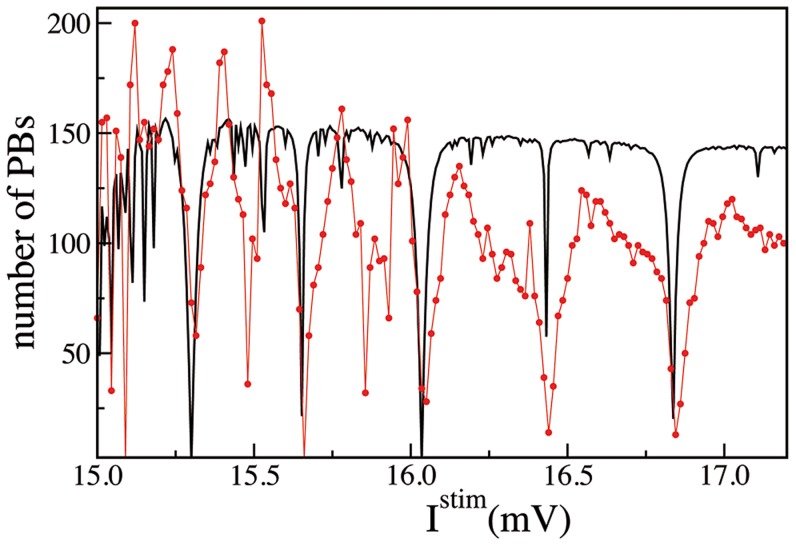
 applied to the neuron
  . The red line with dots refers to the results of the SNS experiment on
  (same curve as in Fig. 3 C) and the black line to the estimations obtained by measuring the PB occurrence with the simple model for SNS, described in the Methods. The measurement were performed in both cases over a time interval
  s.
s.References
-
- Wolfe J, Houweling AR, Brecht M (2010) Sparse and powerful cortical spikes. Current Opinion in Neurobiology 20: 306–312. - PubMed
-
- Brecht M, Schneider M, Sakmann B, Margrie TW (2004) Whisker movements evoked by stimulation of single pyramidal cells in rat motor cortex. Nature 427: 704–710. - PubMed
-
- Houweling AR, Brecht M (2007) Behavioural report of single neuron stimulation in somatosensory cortex. Nature 451: 65–68. - PubMed
-
- Bonifazi P, Goldin M, Picardo MA, Jorquera I, Cattani A, et al. (2009) Gabaergic hub neurons orchestrate synchrony in developing hippocampal networks. Science 326: 1419–1424. - PubMed
Publication types
MeSH terms
LinkOut - more resources
Full Text Sources
Other Literature Sources
